
INNOVATION ASSESSMENT VIA ENTERPRISE INFORMATION
MARKETS
Stephan Stathel, Tobias Kranz
Research Center for Information Technology, Karlsruhe, Germany
Florian Teschner, Clemens van Dinther, Christof Weinhardt
Institute of Information Systems and Management (IISM), Karlsruhe Institute of Technology (KIT), Karlsruhe, Germany
Tobias Kullnig
Energie Baden-W
¨
urttemberg (EnBW), Karlsruhe, Germany
Keywords:
Innovation Assessment, Enterprise Information Markets, Information Aggregation, Market Systems.
Abstract:
The assessment and evaluation of ideas and innovations has always been a challenging task in innovation
management. Depending on the business culture, innovation proposals can be reviewed and assessed by
employees in order to get valuable information before the innovation implementation. Employees often have
direct contact to customers and consumers which is of highest importance in innovation management. In
this paper, we present Enterprise Information Markets (EIM) as a tool for innovation evaluation. In a field
experiment at EnBW, one of the biggest electricity suppliers in Germany, we adopted an Information Market
web tool to assess innovation proposals submitted by employees during an innovation workshop in order to
test the success of EIM in an enterprise context. We analyze the motivation of employees as well as their
expectations for a set of innovations compared to the expectations of decision makers. The results show
that EIM are accepted by employees and that markets are a valuable tool for the innovation assessment in
enterprises.
1 INTRODUCTION
Companies have been pursuing innovation manage-
ment for years. Managing ideas with structured pro-
cesses should guaranty that valuable ideas won’t get
lost and innovation processes can be conducted with
success. For example, employees often have good
ideas to improve processes or organizational struc-
tures. Instead of disregarding these ideas, the abil-
ity to innovate is a key success factor for growth
and competitiveness (Christensen and Raynor, 2003).
Following (Corsten et al., 2006),, an innovation con-
sists of 3 major steps: First of all, somebody has to
have an idea (1). If the idea is promising, it will be
worked out to a functioning prototype or a proof of
concept: the invention (2). Last but not least, it must
be rolled out in the market to complete the proper-
ties of an innovation: the diffusion (3). In the follow-
ing, we focus on the assessment of ideas in order to
pick the most promising one out of a pool of ideas en-
gaging employees via Enterprise Information Markets
(EIM).
The evaluation of new ideas and identification of
future trends is a challenging task since it is often
based on vague information and uncertainty due to
long time horizons. In order to complete this task
successfully companies often follow the iterative Del-
phi process of distributing questionnaires and collect-
ing experts opinions. Information Markets (IM) on
the other hand rely on the fact that stock prices carry
and aggregate diverse information in a single attribute
price. (Green et al., 2007) compared both methods to
elicit forecasts from groups. Compared to the Delphi
method, IMs bear the advantage that the results (i.e.
valuations of participants) can be interpreted contin-
uously, that new information can be integrated im-
mediately, and that trading itself is often intuitively
understood by the participants. Furthermore, IMs
are often considered as a method to support “Wis-
dom of Crowds” because they aggregate information
held by many people and have a participative element
(Surowiecki, 2005). On the other hand, trading in IMs
206
Stathel S., Kranz T., Teschner F., van Dinther C., Weinhardt C. and Kullnig T. (2010).
INNOVATION ASSESSMENT VIA ENTERPRISE INFORMATION MARKETS.
In Proceedings of the Multi-Conference on Innovative Developments in ICT, pages 206-216
DOI: 10.5220/0003037802060216
Copyright
c
SciTePress

gets cumbersome for large studies with many ques-
tions and low liquidity for very small sample groups.
The use of IMs in the context of innovation processes
and forecasting appears advantageous since the par-
ticipants do not have to exhibit their complete knowl-
edge. Thus, participants use their information to gain
profits from stock trading and report their opinion in-
directly. Additionally, IMs have also a playful aspect.
Soukhoroukova and Spann successfully used IMs
for the assessment product innovation alternatives,
e.g. mp3 players (Soukhoroukova and Spann, 2005).
Compared to conjoint analysis and other methods,
IMs with 8-12 participants are more robust and re-
liable compared to conjoint analysis with 307 partic-
ipants. Spann emphasizes that IMs must have an ap-
propriate amount of traders to work well (Spann and
Skiera, 2004). But people do not want to trade if mar-
kets are thin. One way to add liquidity is the intro-
duction of Market Makers. In financial stock markets
like NYSE or NASDAQ Market Makers are common
in order to provide liquidity. Stathel et al. analyzed
the impact of automated market making in virtual IMs
(Stathel et al., 2009). In a field experiment for the
European Soccer Championship in 2008, the results
show a significant gain in liquidity through the usage
of automated market making.
IMs bear several advantages compared to other
methods for information aggregation like surveys or
nominal group techniques. As traders reveal their ex-
pectations via buying and selling shares representing
a future event, the trading success can be bound to
a performance based incentive system. The better
a participant trades in the market, the more he gets
compensated either with prizes or real money. Hence,
this powerful incentive mechanism motivates people
to stay active in the Information Market. Furthermore,
people in IMs are a subject to the so-called “self selec-
tion” process. Only people having superior informa-
tion are supposed to join the Information Market and
to make profit by contributing their information. An-
other advantage is the continuous trading possibility.
As online Information Markets are fully automated
they operate 24 hours a day, 7 days a week. There-
fore, once a participant likes to reveal his information,
he can use the market at any time. A survey or Delphi
study represents only a snapshot in time compared to
an Information Market. Furthermore, IMs tackle sev-
eral challenges regarding common resistance against
business change. In general, every innovation can be
considered as a change project. Therefore, we discuss
challenges of change projects in the following section.
In change projects, several challenges exist in
enterprises and the business culture that may steer
innovation projects into trouble. (Jørgensen et al.,
2008) conducted a comprehensive survey among
1.500 practitioners worldwide in order to investigate
the reasons of project failures
1
.
Figure 1 shows the results of the survey regard-
ing the project success rate in companies that project
leaders reported. Therefore, 59 % were somehow
troubled, whereas 15 % out of these missed their goals
or were stopped.
ticipants do not have to exhibit their complete knowl-
edge. Thus, participants use their information to gain
profits from stock trading and report their opinion in-
directly. Additionally, IMs have also a playful aspect.
Soukhoroukova and Spann successfully used IMs
for the assessment product innovation alternatives,
e.g. mp3 players (Soukhoroukova and Spann, 2005).
Compared to conjoint analysis and other methods,
IMs with 8-12 participants are more robust and re-
liable compared to conjoint analysis with 307 partic-
ipants. Spann emphasizes that IMs must have an ap-
propriate amount of traders to work well (Spann and
Skiera, 2004). But people do not want to trade if mar-
kets are thin. One way to add liquidity is the intro-
duction of Market Makers. In financial stock markets
like NYSE or NASDAQ Market Makers are common
in order to provide liquidity. Stathel et al. analyzed
the impact of automated market making in virtual IMs
(Stathel et al., 2009). In a field experiment for the
European Soccer Championship in 2008, the results
show a significant gain in liquidity through the usage
of automated market making.
IMs bear several advantages compared to other
methods for information aggregation like surveys or
nominal group techniques. As traders reveal their ex-
pectations via buying and selling shares representing
a future event, the trading success can be bound to
a performance based incentive system. The better
a participant trades in the market, the more he gets
compensated either with prizes or real money. Hence,
this powerful incentive mechanism motivates people
to stay active in the Information Market. Furthermore,
people in IMs are a subject to the so-called “self selec-
tion” process. Only people having superior informa-
tion are supposed to join the Information Market and
to make profit by contributing their information. An-
other advantage is the continuous trading possibility.
As online Information Markets are fully automated
they operate 24 hours a day, 7 days a week. There-
fore, once a participant likes to reveal his information,
he can use the market at any time. A survey or Delphi
study represents only a snapshot in time compared to
an Information Market. Furthermore, IMs tackle sev-
eral challenges regarding common resistance against
business change. In general, every innovation can be
considered as a change project. Therefore, we discuss
challenges of change projects in the following section.
In change projects, several challenges exist in
enterprises and the business culture that may steer
innovation projects into trouble. (Jørgensen et al.,
2008) conducted a comprehensive survey among
1.500 practitioners worldwide in order to investigate
the reasons of project failures
1
.
1
The survey covered 1.532 organizations of all sizes,
Figure 1 shows the results of the survey regard-
ing the project success rate in companies that project
leaders reported. Therefore, 59 % were somehow
troubled, whereas 15 % out of these missed their goals
or were stopped.
Figure 1: Success Rate in Change Projects.
This indicates that approximately 60 % of all
change projects can be improved in order to reduce
the fraction of troubled projects.
Figure 2: Success Rate in Change Projects.
In figure 2, the three major significant challenges
are the “changing mindset and attitudes” followed
by the “cooperate culture” and the “complexity of
projects”. One cannot rank all these challenges ac-
cording to their importance based on the numbers in
figure 2 which represent the frequency how often the
aspect was mentioned in the survey without relating
them to importance. There are three aspects men-
tioned in the survey which we like to address with
an EIM:
• Lack of higher management commitment (32 %)
• Lack of transparency because of missing or wrong
information (18 %)
• Lack of motivation of involved employees (16 %)
balanced around the globe and across industries. In total, 21
industries, whereby 14 % companies employed more than
100.000 employees and 22 % had less than 1.000 employ-
ees.
Figure 1: Success Rate in Change Projects.
This indicates that approximately 60 % of all
change projects can be improved in order to reduce
the fraction of troubled projects.
ticipants do not have to exhibit their complete knowl-
edge. Thus, participants use their information to gain
profits from stock trading and report their opinion in-
directly. Additionally, IMs have also a playful aspect.
Soukhoroukova and Spann successfully used IMs
for the assessment product innovation alternatives,
e.g. mp3 players (Soukhoroukova and Spann, 2005).
Compared to conjoint analysis and other methods,
IMs with 8-12 participants are more robust and re-
liable compared to conjoint analysis with 307 partic-
ipants. Spann emphasizes that IMs must have an ap-
propriate amount of traders to work well (Spann and
Skiera, 2004). But people do not want to trade if mar-
kets are thin. One way to add liquidity is the intro-
duction of Market Makers. In financial stock markets
like NYSE or NASDAQ Market Makers are common
in order to provide liquidity. Stathel et al. analyzed
the impact of automated market making in virtual IMs
(Stathel et al., 2009). In a field experiment for the
European Soccer Championship in 2008, the results
show a significant gain in liquidity through the usage
of automated market making.
IMs bear several advantages compared to other
methods for information aggregation like surveys or
nominal group techniques. As traders reveal their ex-
pectations via buying and selling shares representing
a future event, the trading success can be bound to
a performance based incentive system. The better
a participant trades in the market, the more he gets
compensated either with prizes or real money. Hence,
this powerful incentive mechanism motivates people
to stay active in the Information Market. Furthermore,
people in IMs are a subject to the so-called “self selec-
tion” process. Only people having superior informa-
tion are supposed to join the Information Market and
to make profit by contributing their information. An-
other advantage is the continuous trading possibility.
As online Information Markets are fully automated
they operate 24 hours a day, 7 days a week. There-
fore, once a participant likes to reveal his information,
he can use the market at any time. A survey or Delphi
study represents only a snapshot in time compared to
an Information Market. Furthermore, IMs tackle sev-
eral challenges regarding common resistance against
business change. In general, every innovation can be
considered as a change project. Therefore, we discuss
challenges of change projects in the following section.
In change projects, several challenges exist in
enterprises and the business culture that may steer
innovation projects into trouble. (Jørgensen et al.,
2008) conducted a comprehensive survey among
1.500 practitioners worldwide in order to investigate
the reasons of project failures
1
.
1
The survey covered 1.532 organizations of all sizes,
Figure 1 shows the results of the survey regard-
ing the project success rate in companies that project
leaders reported. Therefore, 59 % were somehow
troubled, whereas 15 % out of these missed their goals
or were stopped.
Figure 1: Success Rate in Change Projects.
This indicates that approximately 60 % of all
change projects can be improved in order to reduce
the fraction of troubled projects.
Figure 2: Success Rate in Change Projects.
In figure 2, the three major significant challenges
are the “changing mindset and attitudes” followed
by the “cooperate culture” and the “complexity of
projects”. One cannot rank all these challenges ac-
cording to their importance based on the numbers in
figure 2 which represent the frequency how often the
aspect was mentioned in the survey without relating
them to importance. There are three aspects men-
tioned in the survey which we like to address with
an EIM:
• Lack of higher management commitment (32 %)
• Lack of transparency because of missing or wrong
information (18 %)
• Lack of motivation of involved employees (16 %)
balanced around the globe and across industries. In total, 21
industries, whereby 14 % companies employed more than
100.000 employees and 22 % had less than 1.000 employ-
ees.
Figure 2: Success Rate in Change Projects.
In figure 2, the three major significant challenges
are the “changing mindset and attitudes” followed
by the “cooperate culture” and the “complexity of
projects”. One cannot rank all these challenges ac-
cording to their importance based on the numbers in
figure 2 which represent the frequency how often the
aspect was mentioned in the survey without relating
them to importance. There are three aspects men-
tioned in the survey which we like to address with
1
The survey covered 1.532 organizations of all sizes,
balanced around the globe and across industries. In total, 21
industries, whereby 14 % companies employed more than
100.000 employees and 22 % had less than 1.000 employ-
ees.
INNOVATION ASSESSMENT VIA ENTERPRISE INFORMATION MARKETS
207

an EIM:
• Lack of higher management commitment (32 %)
• Lack of transparency because of missing or wrong
information (18 %)
• Lack of motivation of involved employees (16 %)
In the following, we introduce the concept of
EIMs as a tool for innovation management which
we applied during an innovation cycle at EnBW
2
.
The EnBW is one of the biggest electricity suppliers
in Germany and conducts internal innovation work-
shops since 3 years. Employees were invited to de-
velop ideas and describe them in innovation project
proposals in order to improve their working environ-
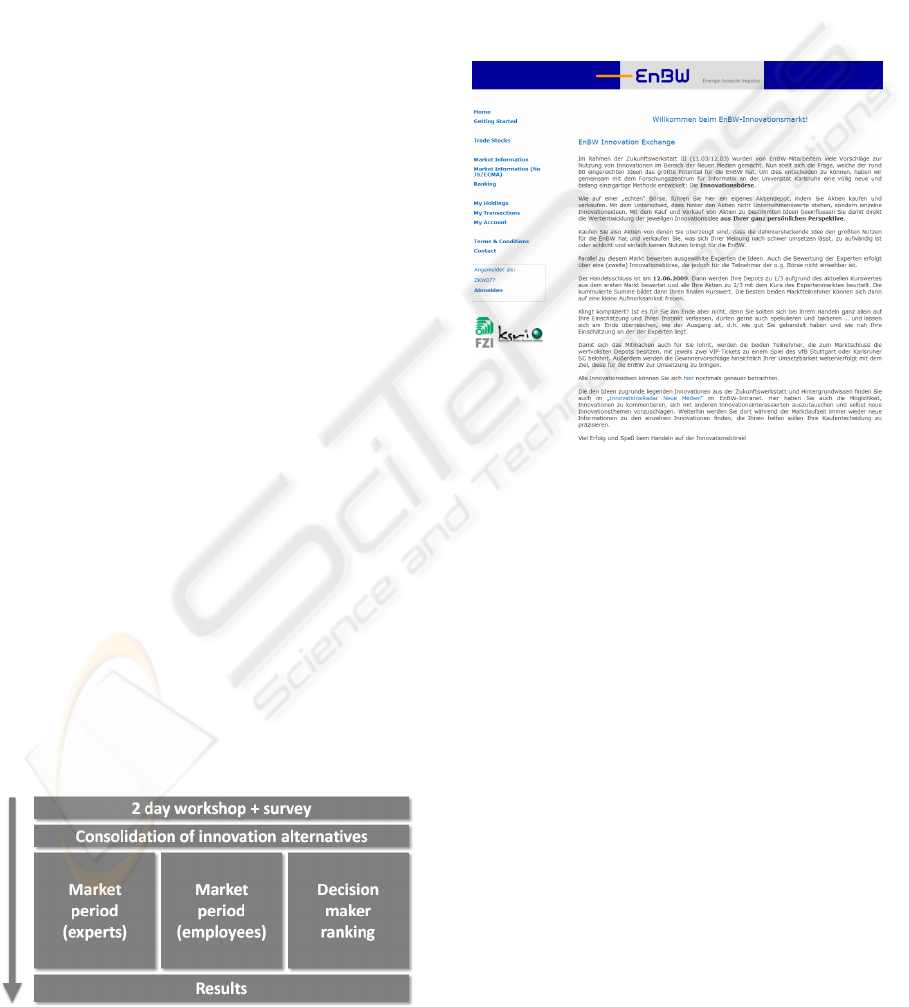
ment. The two day workshop’s scope was exclusively
about IT-Services improving employees’ working en-
vironment. Having the workshop proposals consol-
idated, the remaining innovation project proposals
were traded for several weeks in an EIM by employ-
ees involved in the innovation workshop.
This paper is structured as follows, in the next
section, the EnBW Innovation Market will be intro-
duced, followed by an in depth description of the mar-
ket design and arrangements. In section 3, the field
experiment results are illustrated and related to the
challenges in innovation processes. The paper ends
with a conclusion summarizing the contribution of
this work.
2 THE ENBW INNOVATION
MARKET
In the following section, we present the results of the
EIM at EnBW. We introduce the EIM design before
we state research questions in order to illustrate the
results accordingly.
2.1 Experiment Design
The innovation workshop in March 2009 was held the
3
rd
time and the experience of the executives in doing
workshops for innovation topics is, that employees
are in general interested in contributing their knowl-
edge. The objective of the workshop is to have a mix-
ture of presentations about new technologies concern-
ing internal processes in order to activate the atten-
dants’ creativity of how they could use new technolo-
gies to make their own daily work more efficient.
On the 1
st
workshop day, attendees had been
given a comprehensive overview about interesting re-
cent technological developments. These technologies
2
http://www.enbw.com
Table 1: Products in the EIM.
Name
01. Twitterinfo
02. MEREGIO-Plattform
03. Heim-Automation
04. Parallele Dokumentenbearbeitung
05. Intelligente Terminplanung
06. Web 2.0 Plakate
07. Digitalisieren von Visitenkarten
08. xing@enbw.com
09. new contact networking
10. All in One
11. Ger
¨
ateinventar
12. mobile Z
¨
ahlererfassung
(ranging from interactive social technologies to de-
vices for power management) were identified by com-
pany representatives previous to the workshop. An
initial collection of technologies was gathered by an
agency and the 12 most interesting ones for the com-
pany were selected to be presented in the workshop
presentation slots.
On the 2
nd
day, attendees had the opportunity to
discuss their ideas in groups in order to develop and
improve them further. After every 30 minutes, groups
were mixed up so that everybody could talk with as
many different persons as possible. That guaranteed
the maximum of feedback to ones’ ideas. Finally,
attendees had the chance to submit their innovation
ideas. Altogether, 80 innovation proposals were sub-
mitted.
During the two days workshop the company no-
ticed that attendants were very interested in further
developing their ideas and therefore they supported
discussions with a company internal Wiki software.
Thus, attendees had the possibility to review and dis-
cuss their innovations. After 4 weeks of improvement
and discussion, 12 ideas were consolidated and ready
to be assessed via an EIM. In our experiment setting
we use one EIM for employees and one parallel EIM
limited to experts. Additionally we set up an expert
panel including decision makers. Table 1 gives an
overview of the 12 selected innovation alternatives.
The observation of the workshops in recent years
was that participants were very cooperative and in-
terested during the workshop, but there was no ade-
quate method and process to keep them in the innova-
tion context after the workshop. As innovation work-
shop participants were encouraged to join the EIM,
it should deliver evidence that employees can be ac-
tively engaged in the innovation process.
The EIM was available online from 2009/05/04
till 2009/06/12. Furthermore, compared to a regu-
INNOV 2010 - International Multi-Conference on Innovative Developments in ICT
208
lar financial exchange, the market was available 24
hours, 7 days a week. All in all, 110 people joined
the innovation workshop and everybody received an
anonymous account as well as a password to join the
EIM. The participants were supposed to trade virtual
stocks representing innovation alternatives (Table 1)
in order to rank them according to their personal ex-
pectation about the overall benefit for the company
via buying and selling shares. Each account was ini-
tially endowed with 100 shares of each stock and
100.000 virtual currency units. Therefore, partici-
pants were able to conveniently trade immediately in
each stock and did not have to buy an initial depot
by themselves. Additionally, an automated market
maker was constantly offering trading possibilities in
the EIM to ensure liquidity. The market maker mech-
anism was slightly adapted from the one Stathel et al.
used in their field experiment (Stathel et al., 2009).
The strategy of selling and buying shares depends
on the participant’s individual expectation of the at-
tractiveness of the underlying innovation. If they
thought that an innovation is overvalued compared to
another innovation alternative, which is in their mind
of minor attractiveness, they were supposed to sell
shares. Vice versa, if an innovation alternative is un-
dervalued in their opinion, they should have bought it
in order to raise the market price so that it represents
their expectations.
After the market was closed on the 2009/06/12, it
was expected that the stock prices represent the aggre-
gated valuation of all participants (Fama, 1970; Fama,
1991). Participants gave their private information in
the market via buying/selling orders while the mar-
ket mechanism aggregated all these. Once the mar-
ket was closed the innovations were ordered by their
market price and this ranking could be interpreted.
As a benchmark, opinions from decision makers and
an identical, parallel EIM for experts were taken in
order to evaluate if these expectations are congruent
with the EIM for employees. From decision makers,
a ranking was collected without having them traded
in a market to compare it against the market results.
Figure 3 summarizes the EIM experiment design.
Figure 3: Field Experiment Timeline.
2.2 User Interface
Figure 4 shows the start screen of the EIM. On the left
hand side, the navigation sidebar enables easy access
to the basic functionalities. It was visible at all times.
The content area (in the middle) shows a text explain-
ing the market goals. Traders, accessing the market
for the first time, were informed about the motivation
of the EnBW, why they run the EIM and what they ex-
pect from traders. Furthermore, it states that the two
best performing traders will be rewarded with prizes.
Figure 4: EIM Start Screen.
The content area changes depending on what
traders want to see. On the trading screen, traders
could submit their orders. They could also access
their depot screen or their transaction screen and so
on.
2.3 Research Questions
The main research question we like to investigate
within this work is:
How can we design Information Markets to
assess innovations in companies?
In order to get indications for that question, two
major objectives motivated the field experiment. The
first goal was to motivate participants using the
market system and to actively reveal their personal
(changing) expectations for a certain time period.
Traditionally, these expectations are being collected
via a questionnaire or expert groups. As these struc-
tured approaches are restrictive, the results are only
valid at one point in time. To get another evalua-
tion the questionnaire has to be repeated or the expert
Figure 3: Field Experiment Timeline.
2.2 User Interface
Figure 4 shows the start screen of the EIM. On the left
hand side, the navigation sidebar enables easy access
to the basic functionalities. It was visible at all times.
The content area (in the middle) shows a text explain-
ing the market goals. Traders, accessing the market
for the first time, were informed about the motivation
of the EnBW, why they run the EIM and what they ex-
pect from traders. Furthermore, it states that the two
best performing traders will be rewarded with prizes.
EIM. The participants were supposed to trade virtual
stocks representing innovation alternatives (Table 1)
in order to rank them according to their personal ex-
pectation about the overall benefit for the company
via buying and selling shares. Each account was ini-
tially endowed with 100 shares of each stock and
100.000 virtual currency units. Therefore, partici-
pants were able to conveniently trade immediately in
each stock and did not have to buy an initial depot
by themselves. Additionally, an automated market
maker was constantly offering trading possibilities in
the EIM to ensure liquidity. The market maker mech-
anism was slightly adapted from the one Stathel et al.
used in their field experiment (Stathel et al., 2009).
The strategy of selling and buying shares depends
on the participant’s individual expectation of the at-
tractiveness of the underlying innovation. If they
thought that an innovation is overvalued compared to
another innovation alternative, which is in their mind
of minor attractiveness, they were supposed to sell
shares. Vice versa, if an innovation alternative is un-
dervalued in their opinion, they should have bought it
in order to raise the market price so that it represents
their expectations.
After the market was closed on the 2009/06/12, it
was expected that the stock prices represent the aggre-
gated valuation of all participants (Fama, 1970; Fama,
1991). Participants gave their private information in
the market via buying/selling orders while the mar-
ket mechanism aggregated all these. Once the mar-
ket was closed the innovations were ordered by their
market price and this ranking could be interpreted.
As a benchmark, opinions from decision makers and
an identical, parallel EIM for experts were taken in
order to evaluate if these expectations are congruent
with the EIM for employees. From decision makers,
a ranking was collected without having them traded
in a market to compare it against the market results.
Figure 3 summarizes the EIM experiment design.
Figure 3: Field Experiment Timeline.
2.2 User Interface
Figure 4 shows the start screen of the EIM. On the left
hand side, the navigation sidebar enables easy access
to the basic functionalities. It was visible at all times.
The content area (in the middle) shows a text explain-
ing the market goals. Traders, accessing the market
for the first time, were informed about the motivation
of the EnBW, why they run the EIM and what they ex-
pect from traders. Furthermore, it states that the two
best performing traders will be rewarded with prizes.
Figure 4: EIM Start Screen.
The content area changes depending on what
traders want to see. On the trading screen, traders
could submit their orders. They could also access
their depot screen or their transaction screen and so
on.
2.3 Research Questions
The main research question we like to investigate
within this work is:
How can we design Information Markets to
assess innovations in companies?
In order to get indications for that question, two
major objectives motivated the field experiment. The
first goal was to motivate participants using the
market system and to actively reveal their personal
(changing) expectations for a certain time period.
Traditionally, these expectations are being collected
via a questionnaire or expert groups. As these struc-
tured approaches are restrictive, the results are only
valid at one point in time. To get another evalua-
tion the questionnaire has to be repeated or the expert
Figure 4: EIM Start Screen.
The content area changes depending on what traders
want to see. On the trading screen, traders could sub-
mit their orders. They could also access their depot
screen or their transaction screen and so on.
2.3 Research Questions
The main research question we like to investigate
within this work is:
How can we design Information Markets to
assess innovations in companies?
In order to get indications for that question, two
major objectives motivated the field experiment. The
first goal was to motivate participants using the
market system and to actively reveal their personal
(changing) expectations for a certain time period.
Traditionally, these expectations are being collected
via a questionnaire or expert groups. As these struc-
tured approaches are restrictive, the results are only
valid at one point in time. To get another evalua-
tion the questionnaire has to be repeated or the expert
INNOVATION ASSESSMENT VIA ENTERPRISE INFORMATION MARKETS
209

group has to meet again because expectations and be-
liefs change over time. By introducing an EIM, em-
ployees are able to reveal their expectations continu-
ously over a certain period.
On the other hand, motivating people to take part
in an IM is very important and only the first step to-
wards a successful method. It is equally fundamental
to harness the implicit knowledge of participants via
an appropriate IM design and incentive mechanism.
The aggregation of information in markets can only
work well, if implicit information can be extracted
and interpreted from traders. Results of both aspects
are analyzed in detail in section 3.
The main research question is therefore subdi-
vided into several research questions focusing on the
two aspects mentioned above. The following list
shows the subdivided research questions:
1. Are employees motivated using EIMs?
(a) How is the trading activity spread over time?
(b) How many traders are active during market du-
ration?
(c) How often do traders use the Innovation Mar-
ket?
(d) Will the Innovation Market be accepted by em-
ployees?
(e) How motivated are employees using Informa-
tion Markets?
2. How can implicit knowledge be harnessed?
(a) How do employees assess the method of Infor-
mation Markets?
(b) Do employees think that the EnBW is able to
assess innovations better with Information Mar-
kets?
(c) Do the results of the Information Markets and
the expert panel differ in innovation contexts?
Research question one and the relevant subdivided
questions are intended to indicate how traders are mo-
tivated during the market period. In innovation con-
texts, innovation cycles may last several months or
years. During that time, new information about the
innovation’s feasibility is very likely to occur. For ex-
ample, a technological breakthrough or unexpected
resources may make an innovation viable. In long
lasting Innovation Markets, new technological devel-
opments may be a motive for traders to change their
expectation about the innovations in the market. In
the end, their changed opinions are observable by dif-
ferent depot structures. The second research ques-
tion is also subdivided in several research questions.
These questions are intended to get an indication, how
employees estimate the overall benefit of an EIM.
3 EXPERIMENT RESULTS
As stated in section 2.3, the two main research ques-
tions are divided into two aspects “Motivating Em-
ployees” and “Harnessing implicit Information”. In
the following two subsections, the main results of
both aspects are discussed in detail.
3.1 Motivating Employees
In the following, the motivation of employees using
an EIM will be evaluated via two empirical aspects.
Firstly, the market activity of employees is analyzed
via their trading activity in the EIM (research ques-
tions 1 a-c). Secondly, survey results deliver evidence
for the assessment by employees and their motivation
in using the EIM (1 d-e).
3.1.1 Market Activity
Figure 5 shows the stock price changes for each stock
over time. The stock prices for several products vary
heavily, which is an indication that trading activity
was intensive during the market period. Some stocks
were only sparely traded and were therefore of minor
attractiveness for traders.
Figure 5: EIM Stock Prices over Time.
In order to further analyze the trading activity, fig-
ure 6 exhibits the trading activity on a daily average
basis of all transactions, where human traders were in-
volved. As stated in section 2.1, an automated market
maker mechanism was actively trading in the market
continuously providing traders with trading opportu-
nities. Hence, the market maker only reacts if a hu-
man trader submitted a matching BUY or SELL or-
der. Thus, the following figures focus on transactions
in which at least one human trader was involved, be-
cause the market maker could have traded with itself
to avoid several price effects. For further details, refer
to (Stathel et al., 2009).
One can see that between 05/20-05/25 no trans-
actions occurred. During that timespan, there was a
nationwide holiday and many employees took days
INNOV 2010 - International Multi-Conference on Innovative Developments in ICT
210
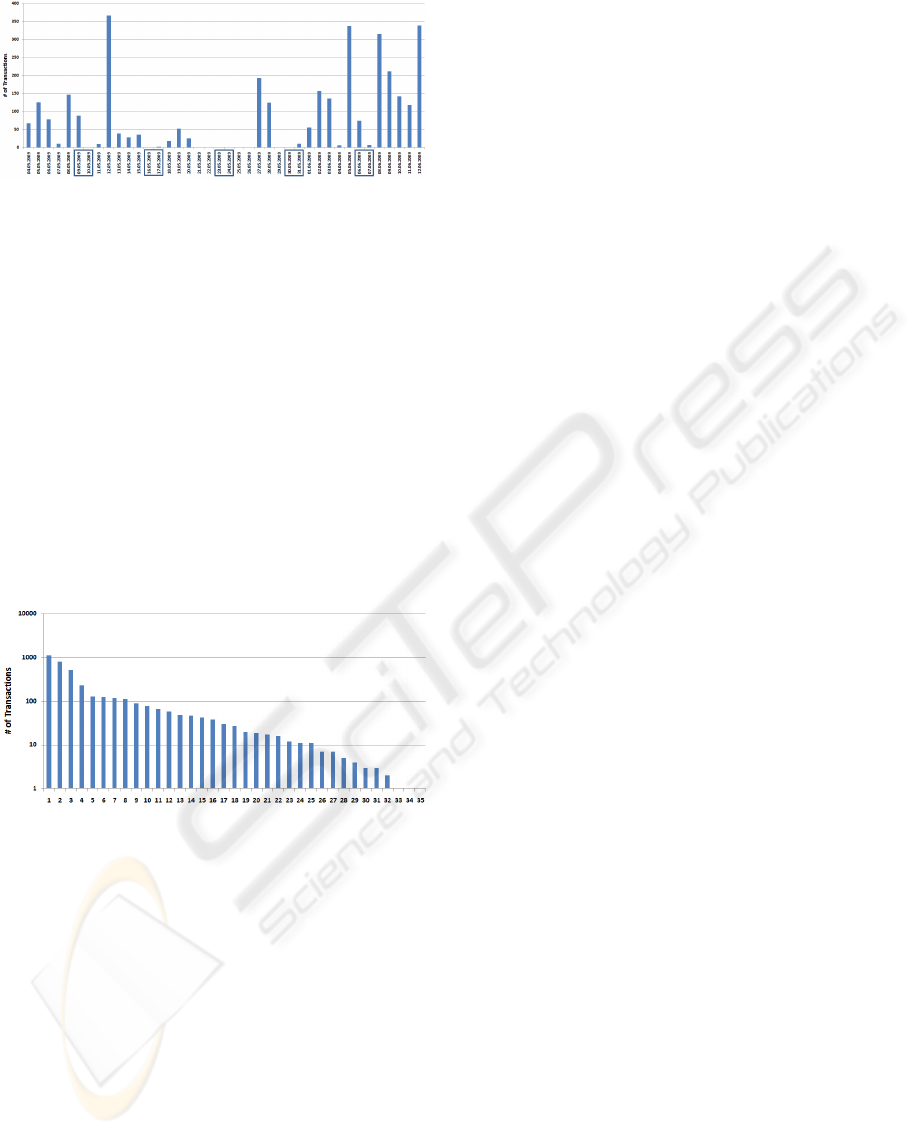
Figure 6: EIM Trading Activity over Time.
off. Besides this, overall trading activity was observ-
able, more or less every day. In total, trading occurred
on 30 out of 40 trading days including weekends.
Some traders remembered their user name and their
password and logged in during weekends, which was
not expected. In figure 6, the weekends are marked
with blue boxes. The daily trading average was 110
transactions with human involvement with a mini-
mum number of 2 and a maximum number of 366
transactions. In total, traders caused more than 2.000
transactions and submitted more than 4.000 orders.
Figure 7 shows the number of transactions per
trader. In total, the most active trader triggered
slightly more than 1000 transactions and the least ac-
tive trader did only one transaction.
Figure 7: Transactions per Trader.
The results in figure 6 and 7 indicate that research
questions 1a, 1b and 1c can be answered. Concerning
1a, the trading activity is spread over the whole mar-
ket period. That is exactly what one may expect be-
fore. The expectation, that the trading activity is only
observable at the beginning of the market period, can
be denied.
Research question 1b can be answered with 35
traders. In total, 110 workshop participants were in-
vited to join the market after the innovation workshop.
About one third followed the invitation and traded
in the market. Approximately 10 traders triggered
nearly 100 transactions, whereas 10 traders performed
less than 10. The rest resides somewhere between 100
and 10 transactions. That is also what one can expect
ex ante and is a typical distribution of trading behavior
reported in IM experiments (Luckner, 2008). Secon-
darily, figures 5, 6 and 7, show that traders used the
EIM nearly every day – even on weekends. On 30
out of 40 market days traders used the market, which
is quite more often than what one may expect. This
indicated that the motivation of traders does not de-
crease over time which is a very nice result regarding
research question 1c.
3.1.2 Survey Results for motivational Aspects
After the innovation workshop at EnBW, workshop
participants were asked by a paper based survey about
their opinion using an EIM at EnBW. The overall re-
sponse rate of the 110 participants was at 69 %, which
is representing. To indicate the related research ques-
tions 1d-e, we focus on two questions from the sur-
vey. One question was intended to get an estimate
about how employees approve the usage of an EIM.
They answered via a 5 point Likert scale where 5
represented “very good” whereas 1 represented “not
good”. On average, employees answered with 3.54, a
median of 4.00, a variance of 0.86 and a standard error
of 0.93. This indicates that the employees positively
judge the approach of using an EIM for innovation as-
sessment. This results supported by the high trading
activity presented in the previous section and the over-
all motivation of employees in using an EIM and indi-
cates, that employees approve the usage of EIM (Re-
search Question 1d). Furthermore, another question
asked about the employees’ motivation using an EIM.
Similarly, employees were expected to answer via a
5 point Likert scale where 5 represents “very high”
and 1 indicates “very low”. On average, employees
answered with 2.85 whereas the median was 3.00.
This indicates that the motivation using an EIM for a
longer time is perceived as neutral (research question
1e). Nevertheless, as results in section 3.1.1 indicate
a high motivation of employees and altogether, the re-
sults show evidence for the motivation of employees
in using an EIM.
3.2 Harnessing implicit Information
A very common way to measure the accuracy of IMs
is to compare its results to an observable benchmark.
In case of sport or political events, results of IMs can
be compared to the final values of the sport event
outcome or the final values of the election (Servan-
Schreiber et al., 2004; Berg et al., 2003; Luckner,
2008; Spann and Skiera, 2004; Stathel et al., 2009).
In case of EIM, a similar final value may exist, if
sales figures or project run times are traded. In case
of using EIM without real world events such as in-
novation assessment, IMs are nevertheless applicable
even if no final value is observable (Soukhoroukova,
2007; Chen et al., 2009). In case that no observable
Figure 6: EIM Trading Activity over Time.
off. Besides this, overall trading activity was observ-
able, more or less every day. In total, trading occurred
on 30 out of 40 trading days including weekends.
Some traders remembered their user name and their
password and logged in during weekends, which was
not expected. In figure 6, the weekends are marked
with blue boxes. The daily trading average was 110
transactions with human involvement with a mini-
mum number of 2 and a maximum number of 366
transactions. In total, traders caused more than 2.000
transactions and submitted more than 4.000 orders.
Figure 7 shows the number of transactions per
trader. In total, the most active trader triggered
slightly more than 1000 transactions and the least ac-
tive trader did only one transaction.
Figure 7: Transactions per Trader.
The results in figure 6 and 7 indicate that research
questions 1a, 1b and 1c can be answered. Concerning
1a, the trading activity is spread over the whole mar-
ket period. That is exactly what one may expect be-
fore. The expectation, that the trading activity is only
observable at the beginning of the market period, can
be denied.
Research question 1b can be answered with 35
traders. In total, 110 workshop participants were in-
vited to join the market after the innovation workshop.
About one third followed the invitation and traded
in the market. Approximately 10 traders triggered
nearly 100 transactions, whereas 10 traders performed
less than 10. The rest resides somewhere between 100
and 10 transactions. That is also what one can expect
ex ante and is a typical distribution of trading behavior
reported in IM experiments (Luckner, 2008). Secon-
darily, figures 5, 6 and 7, show that traders used the
EIM nearly every day – even on weekends. On 30
out of 40 market days traders used the market, which
is quite more often than what one may expect. This
indicated that the motivation of traders does not de-
crease over time which is a very nice result regarding
research question 1c.
3.1.2 Survey Results for motivational Aspects
After the innovation workshop at EnBW, workshop
participants were asked by a paper based survey about
their opinion using an EIM at EnBW. The overall re-
sponse rate of the 110 participants was at 69 %, which
is representing. To indicate the related research ques-
tions 1d-e, we focus on two questions from the sur-
vey. One question was intended to get an estimate
about how employees approve the usage of an EIM.
They answered via a 5 point Likert scale where 5
represented “very good” whereas 1 represented “not
good”. On average, employees answered with 3.54, a
median of 4.00, a variance of 0.86 and a standard error
of 0.93. This indicates that the employees positively
judge the approach of using an EIM for innovation as-
sessment. This results supported by the high trading
activity presented in the previous section and the over-
all motivation of employees in using an EIM and indi-
cates, that employees approve the usage of EIM (Re-
search Question 1d). Furthermore, another question
asked about the employees’ motivation using an EIM.
Similarly, employees were expected to answer via a
5 point Likert scale where 5 represents “very high”
and 1 indicates “very low”. On average, employees
answered with 2.85 whereas the median was 3.00.
This indicates that the motivation using an EIM for a
longer time is perceived as neutral (research question
1e). Nevertheless, as results in section 3.1.1 indicate
a high motivation of employees and altogether, the re-
sults show evidence for the motivation of employees
in using an EIM.
3.2 Harnessing implicit Information
A very common way to measure the accuracy of IMs
is to compare its results to an observable benchmark.
In case of sport or political events, results of IMs can
be compared to the final values of the sport event
outcome or the final values of the election (Servan-
Schreiber et al., 2004; Berg et al., 2003; Luckner,
2008; Spann and Skiera, 2004; Stathel et al., 2009).
In case of EIM, a similar final value may exist, if
sales figures or project run times are traded. In case
of using EIM without real world events such as in-
novation assessment, IMs are nevertheless applicable
even if no final value is observable (Soukhoroukova,
2007; Chen et al., 2009). In case that no observable
Figure 7: Transactions per Trader.
The results in figure 6 and 7 indicate that research
questions 1a, 1b and 1c can be answered. Concerning
1a, the trading activity is spread over the whole mar-
ket period. That is exactly what one may expect be-
fore. The expectation, that the trading activity is only
observable at the beginning of the market period, can
be denied.
Research question 1b can be answered with 35
traders. In total, 110 workshop participants were in-
vited to join the market after the innovation workshop.
About one third followed the invitation and traded
in the market. Approximately 10 traders triggered
nearly 100 transactions, whereas 10 traders performed
less than 10. The rest resides somewhere between 100
and 10 transactions. That is also what one can expect
ex ante and is a typical distribution of trading behavior
reported in IM experiments (Luckner, 2008). Secon-
darily, figures 5, 6 and 7, show that traders used the
EIM nearly every day – even on weekends. On 30
out of 40 market days traders used the market, which
is quite more often than what one may expect. This
indicated that the motivation of traders does not de-
crease over time which is a very nice result regarding
research question 1c.
3.1.2 Survey Results for Motivational Aspects
After the innovation workshop at EnBW, workshop
participants were asked by a paper based survey about
their opinion using an EIM at EnBW. The overall re-
sponse rate of the 110 participants was at 69 %, which
is representing. To indicate the related research ques-
tions 1d-e, we focus on two questions from the sur-
vey. One question was intended to get an estimate
about how employees approve the usage of an EIM.
They answered via a 5 point Likert scale where 5
represented “very good” whereas 1 represented “not
good”. On average, employees answered with 3.54, a
median of 4.00, a variance of 0.86 and a standard error
of 0.93. This indicates that the employees positively
judge the approach of using an EIM for innovation as-
sessment. This results supported by the high trading
activity presented in the previous section and the over-
all motivation of employees in using an EIM and indi-
cates, that employees approve the usage of EIM (Re-
search Question 1d). Furthermore, another question
asked about the employees’ motivation using an EIM.
Similarly, employees were expected to answer via a
5 point Likert scale where 5 represents “very high”
and 1 indicates “very low”. On average, employees
answered with 2.85 whereas the median was 3.00.
This indicates that the motivation using an EIM for a
longer time is perceived as neutral (research question
1e). Nevertheless, as results in section 3.1.1 indicate
a high motivation of employees and altogether, the re-
sults show evidence for the motivation of employees
in using an EIM.
3.2 Harnessing Implicit Information
A very common way to measure the accuracy of IMs
is to compare its results to an observable benchmark.
In case of sport or political events, results of IMs can
be compared to the final values of the sport event
outcome or the final values of the election (Servan-
Schreiber et al., 2004; Berg et al., 2003; Luckner,
2008; Spann and Skiera, 2004; Stathel et al., 2009).
In case of EIM, a similar final value may exist, if
sales figures or project run times are traded. In case
of using EIM without real world events such as in-
novation assessment, IMs are nevertheless applicable
even if no final value is observable (Soukhoroukova,
INNOVATION ASSESSMENT VIA ENTERPRISE INFORMATION MARKETS
211

2007; Chen et al., 2009). In case that no observable
real world benchmark or event can be used to deter-
mine the accuracy of an EIM, other benchmarks are
needed. One option introduced by (Spann and Skiera,
2004)is to run two markets in parallel. Traders are
only allowed to participate in one market. If both
markets are closed, the final stock values of the first
market can be taken as a payout function for the sec-
ond market and vice versa. Other approaches are re-
ported by Slamka or Chen by using the final stock
price as payout function (Slamka, 2009; Chen et al.,
2009). It is doubtful to use the last transaction price
as a benchmark because the payout function has to be
transparent to traders in EIM and therefore strategic
behavior is beneficial for traders. Traders may tend to
steer their favored stocks as they like the market re-
sult should be and that is not what should be fostered.
The payout function should lead traders to reveal their
real expectations based on the goal the market should
fulfill. The payout function should be the dominant
guideline that strategic behavior is neither rewarded
nor incentivized. Therefore, we designed the payout
function that the outcomes of the EIM for employees
were weighted 1/3 and the results of the EIM for ex-
perts were weighted 2/3. The market for experts were
not accessible for employees and vice versa. The in-
tention was to motivate employees to reveal their true
expectation because they did not know what the re-
sults of the expert market would be. Therefore, they
had no incentive to play the market and traded their
true expectation in order to align to the expert market
in order to make a profit.
For the field experiment at EnBW, two bench-
marks were intended to be compared to the results of
the EIM for employees. The first one was an identical
market running in parallel. Dedicated experts chosen
from EnBW and also presenters of the slots during the
innovation workshop were supposed to use the expert
market. These experts were employees mostly from
external companies affiliated with the EnBW. In to-
tal, 8 experts were supposed to participate in the ex-
pert market. Unfortunately, only 7 transaction were
observed in the market so the result cannot serve as
a benchmark. The reason for this was that the ex-
perts were not originally employees of the EnBW and
therefore had no interest or not sufficient information
to trade in the expert market. Regrettably, the results
from the expert market must be discarded.
The second benchmark was the comparison to a
ranking created by decision makers for innovation
processes at EnBW. In the past, the innovation work-
shop was conducted twice and every time the decision
makers came to their decision which innovation will
be implemented by themselves. In 2009, the EIM was
an additional method to get further information from
employees which was a rather new situation even for
decision makers. In the next section, the interaction
between the EIM and decision makers will be illus-
trated.
3.2.1 Expert Expectations and Information
Markets
After the market closed, we payed traders according
to their depot structure and the weighting against the
expert market. Due to the fact that the expert mar-
ket collapsed, the weighting had only minor influence
and did not changed the ranking from the EIM for em-
ployees. Therefore, only the results for the EIM for
employees can be benchmarked against the results of
decision makers. All things considered, there are four
imaginable outcomes of the two benchmarks which
are described in table 2.
Table 2: Possible Outcomes.
EIM
positive negative
Decision
Makers
positive good (1) action required (2)
negative action required (3) good (4)
In the first case (1), market participants as well
as the experts (decision makers) come to the same
or similar innovation ranking. This indicates that the
majority of people involved in innovation processes
think the same way about the most promising inno-
vation. In the second (2) and the third (3) case, either
the experts or the market points in different directions.
For the company, this is an indication that at least one
group think different about the innovations, but it is
left clear, who is right. But in innovation contexts, one
cannot state that the one innovation is right and the
other is not ex ante. Therefore, the indication in case
one is mostly desirable, because the decision makers
in the company may have a suggestion, which innova-
tion they should support by themselves. And if both,
the market and the experts, point in the same direction
the decision to make is easier to assert. In the second
and third case, it is of high importance, that before the
final decision is made the decision makers check the
innovation again, eventually through another control
group like external consultants or internal counselors.
The different direction of the market and the experts
opinions are a valid sign to do so. In the worst (4)
case, the market as well as the experts point to the
same direction, but both groups may have a differ-
ent perception about the innovations compared what
is the right decision. If the decision makers haven’t
such markets, they must decide which innovation they
should go for. Either way, the combination of experts
INNOV 2010 - International Multi-Conference on Innovative Developments in ICT
212

and IMs is a way to have the possibility to get more
opinions from groups with different point of view –
and that is what is very important in innovation con-
texts. In case 2 and 3 this indication may be a valuable
hint to rethink an innovation. Through the self selec-
tion process, only employees with relevant knowledge
are supposed and expected to join the market. One
trader may have information about the customer or
business partners needs and makes his decision about
an innovation based on that information. Another
employee maybe has another business network and
therefore can input that information into the market.
All in all, for the company there is no disadvantage
having an additional information source which inno-
vation the employees prefer. Moreover, they have an
additional control group to experts or consultants in
order to identify the most beneficial innovation.
In case that the market and the experts have the
same expectation about the innovations, it may hap-
pen that the decision makers have a different one.
That is expressed in the table 2 by (negative/negative).
But it cannot be determined ex ante, in which sector
in table 2 the results are, because sector 1 and 4, as
well as 2 and 3 are possible, depending if the results
from decision makers can be assumed as positive or
negative, which is not possible ex ante – and not pos-
sible ex post too. Ex post, it is not feasible to check
if the results of a “wrong” results turn out to be right,
because not all innovations can be implemented and
checked for success. Even if an innovation may be
the best one and is lower ranked from the “positive”-
labeled, it may be the best one. But that cannot
be proved until all innovations are implemented and
evaluated against each other. As already pointed out,
there is no disadvantage having sophisticated infor-
mation about the employees’ expectation via markets
and experts additionally. Either way, it helps to avoid
implementing a barely advantageous innovation – but
not necessarily. Besides the effect, that employees are
integrated in decision making, which has relevance
for the business culture, the EnBW noticed two major
benefits of having the EIM for employees in addition
to expert opinions:
1. Additional ranking of innovations
2. Information from a group of employees
3.2.2 Survey Results for Harnessing Implicit
Information
In table 3, the combined prices of the EIM and the
EIM for experts are displayed. The combined price
is the combination of the weighted EIM prices (1/3)
and the EIM for experts (2/3). As described before,
the EIM will be compared to the ranking by decision
makers. Unfortunately, the expert market only gen-
erated 7 transaction, which is not usable as a bench-
mark. As one can easily see, the results of the ex-
pert market did not change the overall ranking in the
combination of the total payout prices. Therefore, the
payout was realized with the weighting, although the
expert market was illiquid.
Furthermore, table 3 shows the ranked results
from decision makers. The horizontal line divides the
top 5 stocks in the EIM because the final values were
above the issued price of 8.33 currency units. There-
fore, it can be assumed that these 5 innovation pro-
posals are favored by employees. Interestingly, the
top three innovations from decision makers were also
under the top four innovations in the EIM which in-
dicate that in this field experiment the result from the
EIM differs only slightly from the decision makers
(research question 2c). This is a strong indication that
decision makers as well as employees in the EIM have
the same expectation, although they were separated
during the runtime of the EIM.
In this context we also asked employees after the
innovation workshop with 110 participants about their
assessment, if the EnBW will be able to better assess
innovations via EIM than traditional methods prior to
the experiment after a tutorial and and introduction to
EIMs. In total, 68 participants answered that ques-
tion. The 5 point Likert scaled question (5 “strong
agreement”, 1 “no agreement”) was answered with an
average of 3.19 and a median of 3.00. The variance
was 0.86 and the standard deviation was 0.93. One
can see that the overall opinion of employees with an
average of 3.19 is positive, that most of them believe
that the approach of using EIM is beneficial for the
company. The variance as well as the standard er-
ror and especially the median indicate that the results
do vary slightly and the majority of the respondents
consider that a company can assess innovations with
EIM. This indicates that research question 2b can be
answered positively. That result is not surprising, be-
cause the employees can be integrated in innovation
processes via EIM. For employees, it is a simple par-
ticipative way to make their information available to
executives and decision makers anonymously. One
problem in companies with strict, top down hierar-
chies is, that employees think they do have no im-
pact on decisions and the executives make their deci-
sions independent of the employees opinions. It is not
feasible to ask each employee about his opinion, but
with EIM, interested employees can join the market
and offer their information whereas the market mech-
anism aggregates each individual information effec-
tively. Moreover, that is also a benefit for decision
makers and executives.
INNOVATION ASSESSMENT VIA ENTERPRISE INFORMATION MARKETS
213

Table 3: Combined Prices and Decision Makers Ranking.
Name Combined Price Expert Market EIM Decision Makers Ranking
All in One 17,13 7,50 36,40 3
MEREGIO-Plattform 12,58 7,90 21,94 8
Web 2.0 Plakate 11,64 8,34 18,24 1
xing@enbw.com 10,92 8,34 16,07 2
Parallele Dokumentenbearbeitung 9,25 8,34 11,08 7
Geraeteinventar 7,56 8,34 6,00 11
mobile Zaehlererfassung 7,54 8,34 5,93 6
Heim-Automation 6,32 8,34 2,28 9
new contact networking 6,10 8,34 1,62 12
Intelligente Terminplanung 5,85 8,34 0,86 4
Digitalisieren von Visitenkarten 5,83 8,34 0,81 10
Twitterinfo 5,72 8,34 0,49 5
In the next survey question, the workshop partic-
ipants were asked, what their opinion about the ap-
proach of using EIM to assess innovations is. The
question was how they assess the method of EIM for
the assessment of innovations. In total, 67 partici-
pants answered that question with an average of 3.54
and a median of 4.00. The variance is 0.86 and the
standard error is 0.93. This indicates that the em-
ployees judge the approach of using EIM for inno-
vation assessment as a good one concerning research
question 2a. The 5 point Likert scale ranged from 5
“very good” till 1 “not good”. This fosters the results
from the question before (2b). Both results do show a
positive correlation of 0.566, which indicated that the
EnBW is able to assess innovations better with EIM
from an employees view. Furthermore, the correlation
is significant at the 5 % level. In general, participants
consider EIM as a good method for innovation assess-
ment. Concerning research question 2b, the overall
results indicate that employees are sure that EnBW is
able to evaluate innovations with EIM.
4 CONCLUSIONS
This paper shows that Enterprise Information Markets
motivate employees to take part in innovation pro-
cesses. Furthermore the field experiment at EnBW
achieved continuous participation during the market
period. Market participants approved the method of
EIM and used it more often than one may have ex-
pected. Moreover, the results show that the assess-
ment of the EIM and the expert panel overlap in the
top 3 innovations, which indicates that in this field ex-
periment the results differ only slightly regarding the
ranking of the innovations. The situation could have
been different, if the market results differed signifi-
cantly from the results of the expert panel and hit case
(2) or (3) in table 2. Then, the decision makers have
to take further activities like hiring an external con-
sultant or involve other people capable of giving an
independent ranking. Another management decision
could be to invite so-called Lead Users to an expert
round and discuss their trading motives and further
elaborate on the underlying information. Lead user
analysis is a way to identify users in markets hav-
ing superior information (Spann et al., 2009). The
analysis can be based on market activity as well as
market success of single a user. A lead user analysis
was also conducted, which is not discussed in this pa-
per in detail due to page limitations. After the EIM
closed, the market results were verified in an expert
panel which finally decided to implement two inno-
vations in 2009. The implementation of “Web 2.0
Plakate” was finished within the second half of the
year 2009. “xing@enbw.com” won one out of three
so-called “Innovationsgutschein” worth 25.000ein an
internal award procedure and is going to be imple-
mented shortly. In total, 10 innovations contenders
applied for the three coupons. Therefore, the results
of the market supported the results of decision makers
strongly.
Figure 8 shows, which success factors are most
relevant for change management (Jørgensen et al.,
2008)
3
. The three top categories are also addressed
with the market. Interestingly, the top aspect is the
sponsorship by the top management. During our ex-
tensive analysis, some executives in the EIM were
identified as lead users. If the top management is also
involved in innovation processes as lead users, this
can be interpreted as a very strong sponsorship and
shows top management commitment.
The second success factor, “Employee involve-
ment”, is also addressed with an EIM. Employees
were invited to join the market, if they were interested
3
http://www-935.ibm.com/services/uk/gbs/pdf/making-
change-work.pdf, 2010/03/10
INNOV 2010 - International Multi-Conference on Innovative Developments in ICT
214

Figure 8: Success Factors of Change Management.
Employees took part in the market following the self
selection mechanism and if an employee did not want
to join the market, he was not forced to. Furthermore,
honest and timely communication is another essen-
tial success factor in change management. The mar-
ket can also be considered as communication method,
because employees can communicate even “negative”
information via the market mechanism. Often, em-
ployees do not communicate because they fear conse-
quences from their managers, if they announce nega-
tive information. In EIM, every employee is anony-
mous and may fearlessly communicate even nega-
tive information. Often, the success of change pro-
cesses are directly connected to the company culture
(Corsten et al., 2006). EnBW uses EIM in order to
involve employees actively, which indicates a very
open company culture. Often, employees cannot be
involved in innovation process due to complexity as-
pects in managing thousands of employees via ques-
tionnaires or online surveys. Information Markets are
a very scalable method to involve a large number of
employees efficiently and at low costs once the market
system is implemented (Spann and Skiera, 2004). The
market mechanism aggregates new information con-
tinuously and people participate autonomously, hence
motivating and involving employees to participate in
innovation processes. All in all, for the EnBW the
EIM was a new way to communicate with their em-
ployees in innovation processes and it provides a sus-
tainable method for long involvement after the inno-
vation workshop. Due to the success in 2009, the
EnBW likes to run another EIM in 2010. The very
valuable knowledge of employees is now a key main
pillar in their innovation process and therefore the
next EIM will be successful and confirm the results
presented in this paper.
REFERENCES
Berg, J., Nelson, F., and Rietz, T. (2003). Accuracy and
forecast standard error of prediction markets. Work-
ing paper, Departments of Accounting, Economy and
Finance, University of Iowa.
Chen, L., Goes, P., Harris, W., Marsden, J., and Zhang, J.
(2009). Preference Markets for Innovation Ranking
and Selection. Interfaces.
Christensen, C. and Raynor, M. (2003). The innovator’s
solution: Creating and sustaining successful growth.
Harvard Business School Press.
Corsten, H., G
¨
ossinger, R., and Schneider, H. (2006).
Grundlagen des Innovationsmanagements. Vahlen.
Fama, E. F. (1970). Efficient capital markets: A review of
theory and empirical work. The Journal of Finance,
25:383–417.
Fama, E. F. (1991). Efficient capital markets: Ii. The Jour-
nal of Finance, 46(5):1575–1617.
Green, K., Armstrong, J., and Graefe, A. (2007). Methods
to elicit forecasts from groups: Delphi and prediction
markets compared. Foresight: The International Jour-
nal of Applied Forecasting, 8:17–20.
Jørgensen, H. H., Owen, L., and Neus, A. (2008). Making
change work. online, accessed 22.03.2010.
Luckner, S. (2008). Predictive Power of Markets. Predic-
tion Accuracy, Incentive Schemes, and Trader’ Biases.
PhD thesis, Universit
¨
at Karlsruhe (TH).
Servan-Schreiber, E., Wolfers, J., Pennock, D. M., and
Galebach, B. (2004). Prediction markets: Does money
matter? Electronic Markets, 14(3):243–251.
Slamka, C. (2009). The Price of Running Liquid Prediction
Markets. In 9th International Conference on Busi-
ness Informatics (Business Services: Concepts, Tech-
nologies, Applications), volume 2, pages 223–232, Vi-
enna, Austria.
Soukhoroukova, A. (2007). Produktinnovation mit Infor-
mationsm
¨
arkten. PhD thesis, Universit
¨
at Passau.
Soukhoroukova, A. and Spann, M. (2005). Produktinno-
vation mit Informationsm
¨
arkten. In Doctoral Collo-
quium Wirtschaftsinformatik.
Spann, M., Ernst, H., Skiera, B., and Soll, J. H. (2009).
Identification of lead users for consumer products via
virtual stock markets. Journal of Product Innovation
Management, 26(3):322–335.
Spann, M. and Skiera, B. (2004). Einsatzm
¨
oglichkeiten
virtueller b
¨
orsen in der marktforschung. Zeitschrift
f
¨
ur Betriebswirtschaft (ZfB), 74:25–48.
Stathel, S., van Dinther, C., and Sch
¨
onfeld, A. (2009).
Service Innovation with Information Markets. In
9th International Conference on Business Informatics
(Business Services: Concepts, Technologies, Applica-
tions), volume 1, pages 825–834, Vienna, Austria.
Surowiecki, J. (2005). The wisdom of crowds: Why the
many are smarter than the few. Abacus.
The project was funded by means of the German Federal Ministry of Economy
and Technology under the promotional reference “01MQ07012”. The authors take the
responsibility for the contents.
Figure 8: Success Factors of Change Management.
in making their expectations available in the market.
Employees took part in the market following the self
selection mechanism and if an employee did not want
to join the market, he was not forced to. Furthermore,
honest and timely communication is another essen-
tial success factor in change management. The mar-
ket can also be considered as communication method,
because employees can communicate even “negative”
information via the market mechanism. Often, em-
ployees do not communicate because they fear conse-
quences from their managers, if they announce nega-
tive information. In EIM, every employee is anony-
mous and may fearlessly communicate even nega-
tive information. Often, the success of change pro-
cesses are directly connected to the company culture
(Corsten et al., 2006). EnBW uses EIM in order to
involve employees actively, which indicates a very
open company culture. Often, employees cannot be
involved in innovation process due to complexity as-
pects in managing thousands of employees via ques-
tionnaires or online surveys. Information Markets are
a very scalable method to involve a large number of
employees efficiently and at low costs once the market
system is implemented (Spann and Skiera, 2004). The
market mechanism aggregates new information con-
tinuously and people participate autonomously, hence
motivating and involving employees to participate in
innovation processes. All in all, for the EnBW the
EIM was a new way to communicate with their em-
ployees in innovation processes and it provides a sus-
tainable method for long involvement after the inno-
vation workshop. Due to the success in 2009, the
EnBW likes to run another EIM in 2010. The very
valuable knowledge of employees is now a key main
pillar in their innovation process and therefore the
next EIM will be successful and confirm the results
presented in this paper.
ACKNOWLEDGEMENTS
The project was funded by means of the German Fed-
eral Ministry of Economy and Technology under the
promotional reference “01MQ07012”. The authors
take the responsibility for the contents.
REFERENCES
Berg, J., Nelson, F., and Rietz, T. (2003). Accuracy and
Forecast standard error of prediction markets. Work-
ing paper, Departments of Accounting, Economy and
Finance, University of Iowa.
Chen, L., Goes, P., Harris, W., Marsden, J., and Zhang,
J.(2009). Preference Markets for Innovation Ranking
and Selection. Interfaces.
Christensen, C. and Raynor, M. (2003). The innovator’s
solution: Creating and sustaining successful growth.
Harvard Business School Press.
Corsten, H., G
¨
ossinger, R., and Schneider, H. (2006).
Grundlagen des Innovationsmanagements. Vahlen.
Fama, E. F. (1970). Efficient capital markets: A review of
theory and empirical work. The Journal of Finance,
25:383-417.
Fama, E. F. (1991). Efficient capital markets: Ii. The Journal
of Finance, 46(5):1575-1617.
Green, K., Armstrong, J., and Graefe, A. (2007). Methods
to elicit forecasts from groups: Delphi and prediction
markets compared. Foresight: The International Jour-
nal of Applied Forecasting, 8:17-20.
Jørgensen, H. H., Owen, L., and Neus, A. (2008). Making
change work. online, accessed 22.03.2010.
Luckner, S. (2008). Predictive Power of Markets. Predic-
tion Accuracy, Incentive Schemes, and Trader’ Biases.
PhD thesis, Universit
¨
at Karlsruhe (TH).
Servan-Schreiber, E., Wolfers, J., Pennock, D. M., and
Galebach, B. (2004). Prediction markets: Does money
matter? Electronic Markets, 14(3):243-251.
Slamka, C. (2009). The Price of Running Liquid Prediction
Markets. In 9th International Conference on Business
Informatics (Business Services: Concepts, Technolo-
gies, Applications), volume 2, pages 223-232, Vienna,
Austria.
Soukhoroukova, A. (2007). Produktinnovation mit Infor-
mationsm
¨
arkten. PhD thesis, Universit
¨
at Passau.
Soukhoroukova, A. and Spann, M. (2005). Produktinno-
vation mit Informationsm
¨
arkten. In Doctoral Collo-
quium Wirtschaftsinformatik.
Spann, M., Ernst, H., Skiera, B., and Soll, J. H. (2009).
Identification of lead users for consumer products via
virtual stock markets. Journal of Product Innovation
Management, 26(3):322-335.
Spann, M. and Skiera, B. (2004). Einsatzm
¨
oglichkeiten
virtueller b
¨
orsen in der marktforschung. Zeitschrift f
¨
ur
Betriebswirtschaft (ZfB), 74:25-48.
INNOVATION ASSESSMENT VIA ENTERPRISE INFORMATION MARKETS
215

Stathel, S., van Dinther, C., and Sch
¨
onfeld, A. (2009).
Service Innovation with Information Markets. In 9th
International Conference on Business Informatics
(Business Services: Concepts, Technologies, Appli-
cations), volume 1, pages 825-834, Vienna, Austria.
Surowiecki, J. (2005). The wisdom of crowds: Why the
many are smarter than the few. Abacus.
INNOV 2010 - International Multi-Conference on Innovative Developments in ICT
216
