
OLAP FOR FINANCIAL ANALYSIS AND PLANNING
A Proof of Concept
Eitel J. M. Lauría
Marist College, Poughkeepsie, 12601, New York, U.S.A.
Carlos A. Greco
Universidad del Salvador, Buenos Aires, Argentina
Keywords: OLAP, Financial analysis, Planning, Management control, KPIs.
Abstract: We describe the design of an in-memory OLAP model for financial planning, analysis and reporting at a
medium sized manufacturing company in South America. The architecture and data model design are
explained within the context of the company’s requirements and constraints.
1 INTRODUCTION
Financial analysis is a critical task that all managers
should be able to carry out. Regardless of the nature
of the business or the size of the organization,
managers are required to diagnose the financial well
being of the organization by analyzing profit and
loss, key performance indexes, liquidity and returns,
anticipating consequences of operational decisions
and taking remedial action.
Accounting is the scorecard of business
(Higgins, 2001): financial statements are a window
into a company's financial performance,
summarizing the company’s activities into an
objective set of numerical information that can be
used by creditors, investors, stakeholders, regulators
and, more importantly, for internal decision making.
Unfortunately, the manner in which financial
statements are typically structured and presented
does not help to convey the information required for
sound financial analysis and planning. Business
management based on performance indicators does
not arise directly from accounting records, which are
mainly concerned with preserving evidence of
business transactions rather than the analysis and
interpretation of the underlying data.
Online analytical processing (OLAP) has had a
significant growth in the last decade with numerous
products and applications developed in different
business areas. The spreadsheet-like nature of OLAP
is well aligned with the mental models that business
users have of data.
In this paper we set out to describe a financial
planning and analysis model based on OLAP
technology. The work is focused on a medium sized
company headquartered in Argentina, with
operations throughout South America (hereafter
referred to as the Corporation). The paper covers the
initiation, analysis and design of the OLAP project.
The application will help the Corporation
improve the planning process and the overall
monitoring of the financial performance of the
organization across its geographically distributed
business units. The paper can be used as a teaching
case in information systems aimed at introducing
OLAP technologies and its application as a
management tool in a real-world scenario. The next
section describes the Corporation’s background: its
organizational setting and a description of the
financial reporting processes used by the
Corporation in the past. The paper follows with an
overview of OLAP architectures, and describes the
architecture adopted by the Corporation. Next the
paper provides an overview of OLAP modeling and
describes the design of the OLAP model for the
financial analysis and planning application. OLAP
concepts as well as definitions of accounting terms
and financial statements concepts have been
included in each section for pedagogical reasons.
The paper ends with a summary and raises some
points that could be used for class-based discussion.
347
Lauría E. and Greco C. (2010).
OLAP FOR FINANCIAL ANALYSIS AND PLANNING - A Proof of Concept.
In Proceedings of the 5th International Conference on Software and Data Technologies, pages 347-355
DOI: 10.5220/0003042603470355
Copyright
c
SciTePress

2 BACKGROUND
The Corporation is a mid-sized manufacturer and
supplier of products for the food industry, mostly
centered on seed crops with high content of Omega-
3. Omega-3 is the common name given to a family
of unsaturated fatty acids that has been shown to
reduce risks of heart disease and have potential
positive effects on other diseases (e.g. high
cholesterol). Omega-3 is not produced by the human
body and must be incorporated in the diet. The
Corporation processes flax and chia seeds, to
produce cold press oils and partially defatted flours.
Cold press oils with high contents of Omega-3 can
be consumed as part of a regular diet or used as
additives in sunflower or olive oils. Partially
defatted flours are included as additives in bakery
and other products (bread, cookies, cereal and
energy bars). Both flax and chia seeds have high
contents of Omega-3. The Corporation has been
especially successful at targeting whole food stores,
supermarkets and the bakery industry. The combined
annual production capacity of oil and flour extracted
from chia and flax seeds has made the Corporation a
major player of Omega-3 additives for the food
industry in South America. The Corporation has
recently added other seed crops to its list of
products, including quinoa (sold as flour and whole
grain) and safflower (processed to produce cooking
oil, margarine and cosmetics). The Corporation has
production and distribution capabilities in several
countries in South America. It has its headquarters in
Buenos Aires, Argentina, and affiliates in Uruguay,
Brazil, Chile, Peru and Colombia. The Corporation’s
production plants are located in Argentina, Peru and
Brazil. Chia and flax products are manufactured in
Argentina, whereas quinoa products are processed in
Peru. The Brazil affiliate is setting up a processing
plant for safflower.
The Corporation has a matrix organizational
structure, with management in each country and
traditional functional areas (production, sales and
marketing, finance). The finance division in each
country reports to a country manager and to the
Chief Financial Officer (CFO) with headquarters in
Buenos Aires. The information technology (IT)
function is small: an IT division headquartered in
Buenos Aires led by an IT director that reports to the
CFO’s office. Each country holds a reduced IT
support group that reports to the IT Director (in
some cases no more than one or two people
depending on the size of the branch).
The continued growth and expansion of the
Corporation from a small family business into a
multinational organization has created the need for a
regional strategic planning process and information
infrastructure. Each country is treated as a separate
business unit, and has its own financial regulations,
tax code, currency, interest rates and labor
considerations. Consolidated corporate financial data
is reported in dollars but is handled in each country
using local currency.
The financial planning process at the Corporation
includes two versions (scenarios) of the data (Actual
and Budget). All financial statement accounts are
recorded with a monthly granularity for each of the
scenarios. Sales and expenses data should have the
possibility of being sliced from multiple
perspectives (dimensions of analysis), including
countries, scenarios, products, and customers.
Products are grouped in product lines according to
the type of seed (chia, flax, quinoa, and safflower).
Customers across countries are grouped according to
the type of target industry (whole foods,
supermarkets, bakeries, and cosmetics).
The planning process and consolidation of
financial reports historically used by the Corporation
is labor intensive. Most of the budget analysis is
performed and kept in Excel spreadsheets whereas
the financial information is handled through
accounting applications running onsite at each
country, or outsourced to a local accounting firm,
according to the size of the branch. Accounting data
is readily available, but the lack of a common
analytical reporting framework paired with the
differences among countries’ accounting regulations
and the distributed nature of the reporting process in
terms of hardware / software platform and staff
makes it difficult to have consistent reporting of
analytical data with adequate levels of granularity
across the Corporation.
The Corporation would like to create a financial
planning and management reporting system that a)
helps compare actual results versus planned
scenarios and enables consolidation of financial data
across countries b) measures the financial health of
the organization through a number of key
performance indicators (KPIs) included in a
financial dashboard. Three types of KPIs are of
special interest to the Corporation: (1) Profitability
KPIs; (2) Solvency KPIs; (3) Cash Flow ratios.
The CFO’s office has decided to initiate a project
to develop a planning and financial analysis tool to
meet the Corporation’s immediate and future
reporting needs.
ICSOFT 2010 - 5th International Conference on Software and Data Technologies
348

3 OLAP TECHNOLOGY FOR
FINANCIAL ANALYSIS
AND PLANNING
The term OLAP, derived from Online Analytical
Processing defines a technology that is based on
multidimensional analysis of business data and
allows the user to have a faster, better and more
flexible access to such data. Originally introduced
by Codd et al (1993), OLAP technologies are
capable of capturing the structure of the real world
in the form of logical arrangements of numerical
data over multiple business dimensions, generally
referred to as data cubes. A ‘slice’ of an OLAP data
cube portrays business data in a spreadsheet-like
representation (a 2D row-by-column arrangement of
data), where each face of the data cube shows
business metrics (sales, revenue, costs, earnings, or
some other measure) for two or more dimensions
simultaneously (Koutsoukis et al, 1999). This data
driven decision making process, is made up of
numerous, speculative “what if” and “why” data
intensive simulations with the goal of studying the
behavior of complex business problems under
different conditions, called scenarios (Golfarelli,
2006). The virtue of OLAP is to allow business
users to operate within the confines of the well
known spreadsheet paradigm while at the same time
eliminating some of the major drawbacks of
spreadsheet applications: separation between data
and models is enforced, as data is kept in the OLAP
repository and is retrieved using spreadsheet type,
pivot-table operators: (a) pivot and slice
: users can
arrange a selected subset of dimension
configurations in a 2D cross-tab view of the data; (b)
drill-down and roll-up
: allows users to create data
aggregations at different levels of a dimension
hierarchy, or conversely, drill down to the most
detailed levels of the data. OLAP technology has a
very good fit with financial reporting and planning.
Financial statements are an important window on
the reality of an organization [1], providing a short-
term and long-term, structured view of its financial
condition. The three principal reports used in
standard accounting practice (Income statement,
Balance Sheet and Cash Flow Statement) play
distinctive roles but are tightly intertwined:
The balance sheet is a snapshot taken at a given
point in time of the company’s net worth: how
much it owns (assets) and how much it owes
(liabilities). Assets and liabilities that turn into
cash within one year are described as short-term
(or current), and all others are described as long
term. Examples of current assets are cash itself
and inventories (with the assumption that they
must be sold within one year). Current liabilities
include accounts payable and income taxes).
Long term assets include the property and
equipment essential for the company’s continued
operation, typically subject to depreciation.
Other long term assets include, intangible assets
(e.g. intellectual property), and long term
investments.
The profit and loss statement (P&L, or income
statement) does not look at net worth but instead
measures the ability of a company to generate
profit in a given time frame (how much money
can the company make in a given period). In
doing so, the income statement records the flow
of resources over time (Higgins, 2001), with
earnings reporting the difference between the
company revenue stream and the costs and
operating expenses that result from producing
such revenue.
The cash flow statement “follows” the cash (its
sources and uses over a period of time), along
three main activities: (i) cash flow from
operations, (ii) cash flow from investing
activities, (iii) cash flow from financing
activities.
The interconnection among these reports based
on well defined formulation, their time dependence
and the demand for various types of financial data
consolidation and analysis (temporal, geographic, or
over product lines, customer groups and multiple
planned scenarios) makes OLAP technology an ideal
delivery platform for carrying out complex
multidimensional analysis based on financial data.
This has been well understood by the project
management team at the Corporation who has set
out to identify OLAP platforms that meet the
requirements of the organization in terms of
flexibility, speed, and adherence to budgetary
constraints.
3.1 OLAP Architectures
and in-Memory OLAP
at the Corporation
OLAP structures are described in terms of logical
rather than physical arrangements, to stress the fact
that the underlying physical structure may vary,
depending on the type of OLAP implementation.
OLAP models can be built on top of relational
databases, specialized multidimensional databases,
or even memory-based data structures (more on this
later on). But at a logical level, the OLAP concept
OLAP FOR FINANCIAL ANALYSIS AND PLANNING - A Proof of Concept
349
remains identical or very similar across different
OLAP products, technologies and physical data
storage implementations.
Several OLAP architectures have been
developed over the years, the most prominent being
multidimensional OLAP (MOLAP) and relational
OLAP (ROLAP). The differences between these
technologies concern data storage and processing
capability (Hasan & Hyland, 2001). MOLAP
architectures implement the multidimensional view
by storing cube data in sparse (usually proprietary)
multidimensional array data structures (MDDS).
Data is periodically uploaded from an organization’s
relational databases into an MDDS. The array model
provides natural indexing, and as data is usually pre-
aggregated in the MDDS, this improves flexibility
and performance. MOLAP architectures are compact
and efficient but don’t scale well when handling
large dimensions or cubes with large numbers of
dimensions. ROLAP architectures used relational
database base systems to store cube data, usually
organized as star or snowflake schemas in the
relational data warehouse. Using the source data
directly allows users to drill down to lower data
levels, typically at the expense of higher processing
power requirements and slower performance. Some
products have implemented hybrid models (also
known and HOLAP, or hybrid OLAP). In such
architectures, MOLAP cubes are deployed to handle
aggregate data, with drill-down operations that
enable users to pull detailed data from the relational
data store.
Figure 1: OLAP Architecture at the Corporation.
In-memory OLAP is a special case of OLAP
(typically MOLAP) architecture that has become
increasingly popular in the last years, and constitutes
a shift in paradigm in terms of performance and
scalability. The reason is simple: users can query
OLAP models residing in RAM memory, which is at
least several orders of magnitude faster than
accessing data from disk storage. In in-memory
OLAP, data is loaded into memory for real-time
querying, including calculations and aggregations
that can be swiftly generated on the fly. This
technology has been around for a number of years,
but only recently has the promise of RAM-based,
high-speed analytical processing become a reality
thanks to the introduction of 64-bit architectures
with large memory address spaces. With 64-bit
addressable memory space, RAM-based OLAP
servers can easily handle 100 gigabyte cubes,
something unthinkable not long ago.
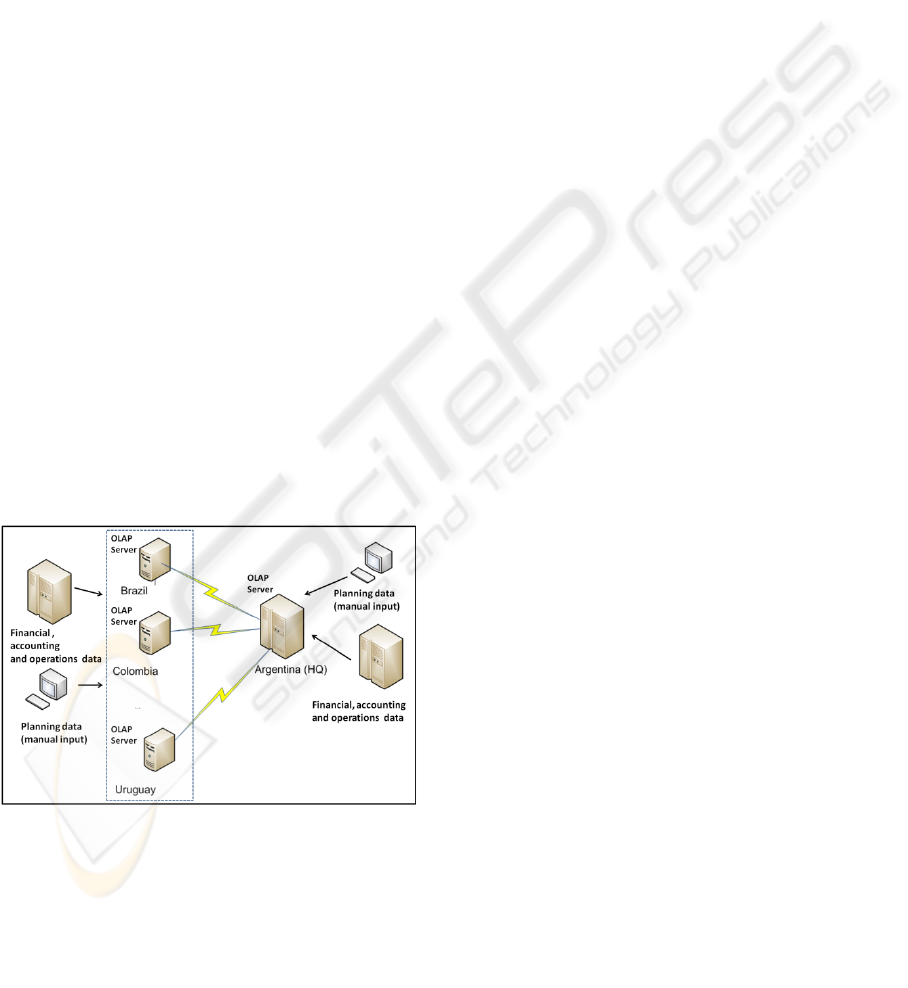
Here the case is set out following a decision
made by the Corporation to use an in-memory
OLAP platform (IBM Cognos TM1) to develop the
financial analysis and planning application. Figure 1
displays the proposed OLAP architecture based on
TM1. An OLAP server is setup at each country,
providing multiuser access to planning and financial
analysis data. Budgets are prepared and entered at
each site, whereas financial data is extracted from
the local accounting systems (a set of files with
accounting data is received on a monthly basis from
the outsourcing service in those countries where the
accounting systems are not run in-house). OLAP
servers are interconnected in a star topology
centered at Buenos Aires’ headquarters that serves
as the aggregation hub where data originating in
each country is consolidated.
4 OLAP MODELING FOR
FINANCIAL ANALYSIS
AND PLANNING
The notion of a multidimensional data cube (also
known as hypercube, or simply “cube”) is central in
understanding OLAP modeling. OLAP hypercubes
play a similar role to tables in the relational database
model: they constitute the building blocks for data
storage, manipulation and retrieval. In a nutshell, a
hypercube is a logical multidimensional array where
each data value occupies a cell in the array, indexed
by a unique set of dimension members (Hasan &
Hyland, 2001). The example in Figure 2.a shows a
Sales hypercube used to track the number of product
units and dollars sold across different countries. A
cell containing a data value in such hypercube is
uniquely identified using four parameters: measure
member (e.g. ‘dollars sold’), country member (e.g.
‘Argentina), time member (e.g. ‘January 23, 2010’),
and product member (‘XYZ’).
ICSOFT 2010 - 5th International Conference on Software and Data Technologies
350
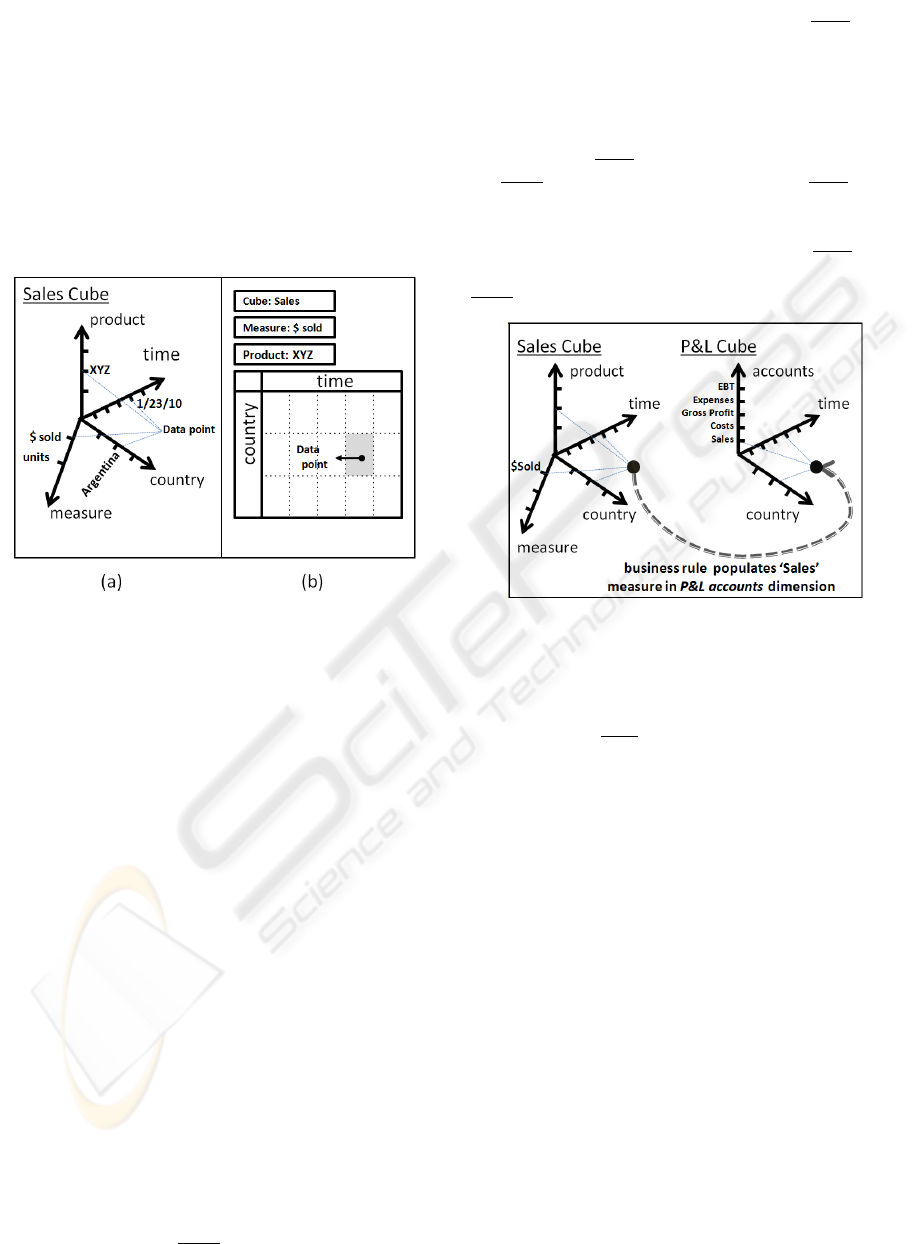
Visual representation of multidimensional
business data requires mapping the n-dimensional
space into two dimensions. This is accomplished by
creating cross-tab representations of the hypercube
data by combining multiple logical dimensions
within the same display dimension over rows,
columns and at the header level of the cross-tab grid.
Figure 2.b shows a 2D, cross-tab representation of a
section of the hypercube data, where the sales in
dollars of product XYZ are displayed for each place
of a sale (in rows), and time of sale (in columns).
Figure 2: Hypercubes: (a) multidimensional representa-
tion; (b) 2D crosstab display.
An OLAP model is made up of a collection of
cubes linked together through their common
dimensions. These common dimensions, when
identically structured, can be shared across cubes
and are usually referred to as conformed dimensions.
Kimball & Ross (2002) introduced the notion of
conformed dimensions to describe dimension tables
in a relational data mart that adhere to a common
structure and therefore allow queries to be executed
across data marts. Dimensions are not simple
enumerations of members; instead, they are
structured as multilevel hierarchies to allow for
aggregations of data.
Also, and depending on the underlying features
of the OLAP tool, cubes can be linked through
business rules and calculated dimension members to
enhance query performance and improve data
integration across cubes. This is especially true for
in-memory OLAP architectures, were calculated
dimension members can be computed on the fly
without lengthy waiting times. For a detailed
critique of some of the dominant, product-specific
approaches to the use of calculation rules in OLAP
models see (Thomsen, 2002). For example, as
shown in Figure 3, a Sales
cube can share the time,
product and country dimensions with a P&L
cube
(containing income statement data). Each data point
(cell) in the region delimited by the [‘$ sold’]
member in the measure dimension identifies sales in
dollars for each member of the time, product and
country dimensions. Through a business rule
attached to the P&L
cube, each of this data points in
the Sales cube can be “pushed” inside the P&L cube.
There is no data duplication: the [‘Sales’] member in
the accounts dimension is a calculated member
whose value for a given data point in the P&L
cube
is the result of an automated query operation on the
Sales
cube.
Figure 3: Calculated members and business rules.
We use the following notation to formulate the
business rule as described before:
[‘Sales’] = DB(Sales,’$ sold’, country, time, ‘Total
Products’)
(1)
DB(.) symbolizes the data extraction query rule.
The expression between brackets [.] refers to the
region in the cube (i.e. the collection of data points
in the cube) affected by the rule; and the reference to
a dimension indicates that the formula spans a whole
dimension. Note that two of the Sales cube
dimensions (measures and products) expressed in
the rule have fixed members denoting that the data
extraction rule proceeds on fixed sections of the
cube (‘$ sold’ and ‘Total Products’). The product
dimension has to be rolled up at its highest level as it
is not present in the P&L cube.
4.1 OLAP Model Specification
The following specification describes the data model
and business rule formulation for the OLAP
application to be implemented at the Corporation.
The specification is presented from the point of view
of users’ requirements. Design considerations tied to
the selected OLAP engine (IBM Cognos TM1) have
OLAP FOR FINANCIAL ANALYSIS AND PLANNING - A Proof of Concept
351
been added as needed. Functional requirements
should be addressed as much as possible through
native features of the OLAP engine in order to avoid
unnecessary programming.
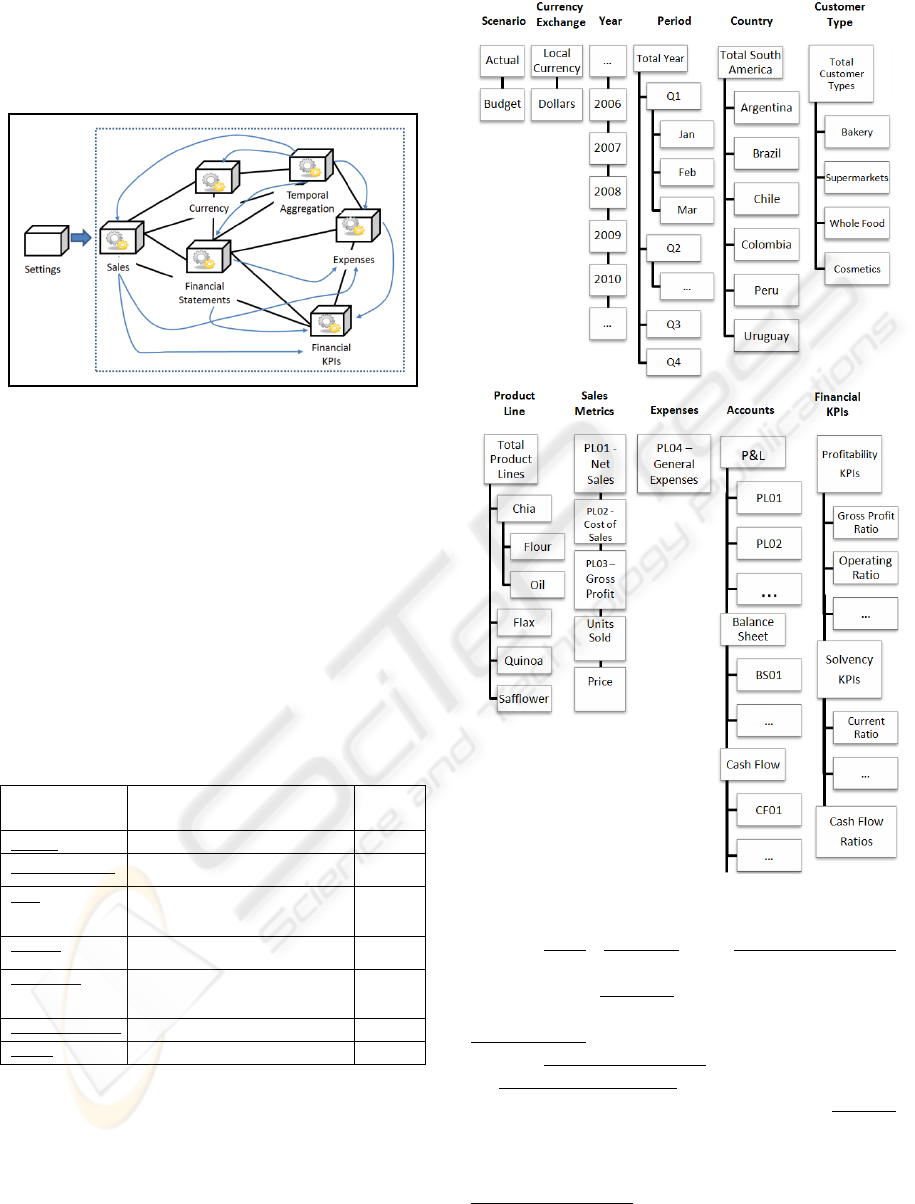
Figure 4: OLAP model for financial analysis and planning.
The OLAP model is composed of seven cubes
sharing common, conformed dimensions and linked
to each other through a set of business rules. Figure
4 depicts the data model, where straight lines linking
cubes signal shared dimensions, curved lines linking
cubes indicate the presence of data extraction query
rules, and the gear icons mark the presence of
intrinsic business rules calculations (calculated
members formulated through dimension members of
the same cube). For example, in the Sales cube:
[‘PL03-Gross Margin’] = [‘PL01-Net Sales’] -
[‘PL02-Cost of Sales’]
(2)
Table 1: OLAP model cubes and their dimensions.
CUBES DIMENSIONS BUSINESS
RULES
Currency year, period, country, currency_exchange
Y
FinancialStatements
country, scenario, currency_exchange,
accounts, year, period
Y
Sales country, scenario, currency_exchange,
customertype, productline, salesmetrics,
year, period
Y
Expenses country, scenario, currency_exchange,
productline, expenses, year, period
Y
FinancialKPIs country, scenario, currency_exchange,
productline, customertype,
financial_kpis, year, period
Y
TemporalAggregation period, consolidation_period
Y
Settings parameter, parameter_value
Table 1 displays the list of cubes that compose
the OLAP model together with their business rules.
Figure 5 shows the layout of dimension hierarchies
used by the OLAP model.
Figure 5: Layout of OLAP Model Dimensions.
The Sales, Expenses and FinancialStatements
cubes store the core financial and accouting
information. Currency
provides local currency
conversion for each of the countries into dollars.
FinancialKPIs
collects performance metrics derived
from the FinancialStatements cube.
TemporalAggegration provides support for
aggregating data over several (n) periods. Settings
contains general parameters used in business rules
by all the other cubes.
The accounts dimension in the
FinancialStatements
cube includes all of the
accounts corresponding to the three standard
financial statements: Balance Sheet, P&L Statement
ICSOFT 2010 - 5th International Conference on Software and Data Technologies
352

and Cash Flow Statement, listed as dimension
members. Some of them are input members, others
are calculated members, with values resulting from
the application of business rules. They are depicted
in Table 2, together with their interrelationship
and/or formulation. Data entered in the local
currency in each country is automatically converted
to dollars for comparison and consolidation purposes
using the Currency
cube that feeds the
corresponding exchange rate for each country and
time period.
Data for each financial statement is entered on a
monthly basis in two versions (‘Actual’ and
‘Budget’): ‘Actual’ data flows from the accounting
system, ‘Budget’ data is the result of the planning
process; Sales metrics (‘PL01’, ‘PL02’) are
extracted from the Sales
cube, where data is entered
by productline and customertype and aggregated in
the query process that feeds the Sales (PL01)
member.
General Expenses (‘PL04’) is a member of the
FinancialStatements
cube, and the Expenses cube.
The [‘PL04’]
metric in the Expenses cube is calculated
through an extraction rule that distributes expenses
according to productline sales, feeding data from the
Sales
cube and FinancialStatements cube. Its
formulation for the Expenses cube is shown below:
[PL04’, productline] = (DB(Sales, country,
scenario, currency, 'Total Customer Types',
productline, 'PL01', year, period) /
DB(Sales
, country, scenario, currency,
'Total Customer,Types', 'Total Products',
'PL01', year, period) *
DB(FinancialStatements
, country, scenario,
currency ,’PL04’, year, period)
(3)
As shown in Table 2, standard accounting rules
are implemented (or validated) through the use of
business rules and calculated members. For
example:
A company's assets are financed by either equity
or debt (liabilities)
[‘BS06’] = [‘BS09’] +[‘BS10’] (basic double-entry accounting
formula)
The sum of the cash flows in all three activities
(operating, investing, financing) equals the
change in the cash balances over the accounting
period
['CF07'] =[‘CF01’] +[‘CF02’]+ [‘CF03’] +[‘CF06’]
Following general accounting principles, when
financial statements are aggregated over a period of
n months over a calendar year starting at month i
and ending at month f, the following conditions must
be satisfied: a) all P&L (‘PLxx’) variables are
aggregated by adding the values corresponding to
each month; b) all balance statement variables take
the values corresponding to month f; c) ‘CF01’ takes
the value corresponding to month i; d) ‘CF07’ takes
the value corresponding to month f. The
TemporalAggegation
cube has been added to handle
the aggregation process over n months (n is an input
parameter to the aggregation process).
Financial Performance indicators are calculated
members resulting from business rules that extract
data from the input cubes (Financial Statements
,
Sales
, and Expenses) and are stored in the
FinancialKPIs cube and the Sales cube.
Profitability KPIs: these are measures of
operating efficiency. Metrics are grouped by
country, customertype, and productline, for any
given period.
Gross profit ratio = [‘PL03’] / [‘PL01’] *100
Operating Ratio = [‘PL02’] / [‘PL01’] *100
Expense ratio = [‘PL04’] / [‘PL01’] *100 (rolled up on
customertype )
Annualized ROE = [‘PL08’] *12 / ([‘BS10’, previous
month] + [‘BS10’, current month] /2)] (measures the
Corporation’s efficiency at generating profits from every
unit of shareholders' equity; rolled up on customertype
and productline)
Unit marginal profit (UMP) = DB(Sales, ‘Price’,…) – (DB
(Sales
, ‘Cost of Sales’, …) / DB(Sales, ‘Units Sold’, …)
Marginal Profit per customer type (MPC) = [‘UMP’] *
DB(Sales, ‘Units Sold’, customertype,…)
Unit marginal profit per product (UMPP) =
[‘MPC’,’Total Customer Types’, productline] / DB(Sales
,
‘Units Sold’, ’Total Customer Types’, productline,..)
(marginal profit metrics help determine the contribution
per product, and rank customer types based on average
prices and unit marginal profits. They can be used to
define price strategies)
Solvency KPIs: these metrics show how well the
Corporation can satisfy its short- and long-term
obligations; grouped by country for any given
period.
Current Ratio = [‘BS04’]/[‘BS07’] (measures short term
solvency)
Liquid ratio = [‘BS01’]/[‘BS07’] (measures immediate
solvency)
Cash Variation = [‘BS01’, previous month] - [‘BS01’,
current month] (measures variation of cash in one
period)
Debt to Equity ratio = [‘BS09’]/[‘BS10’] (measures long
term solvency)
Proprietary of equity ratio = [‘BS10’]/[‘BS06’] (measures
long term solvency)
OLAP FOR FINANCIAL ANALYSIS AND PLANNING - A Proof of Concept
353
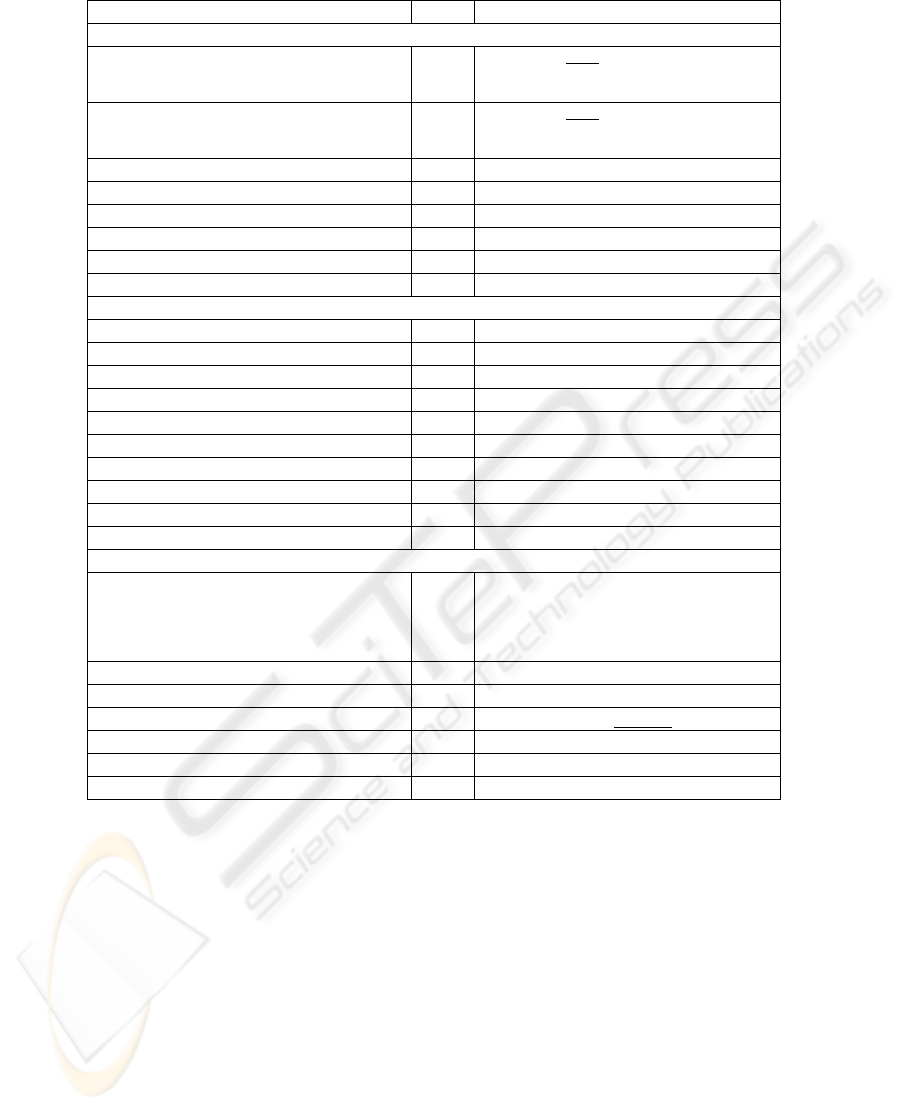
Table 2: Financial Statements‘ accounts dimension.
Dimension member Type Business Rule
Profit & Loss (P&L) Statement
PL01-Sales Calc
['PL01']
= DB(Sales, country, scenario, currency,
'Total Customer Types', 'Total Products', 'PL01',
year, period)
PL02-Cost of sales Calc
['PL02'] = DB(Sales
, country, scenario, currency,
'Total Customer Types', 'Total Products', 'PL02',
year, period)
PL03-Gross profit Calc ['PL03'] = [‘PL01’] – [‘PL02’]
PL04-General Expenses Input Distributed by product line
PL05-Other income (expense) Input
PL06-Earnings before taxes (EBT) Calc ['PL06'] = [‘PL03]–[‘PL04’] +[‘PL05’]
PL07- Provision for income taxes Input
PL08 – Net income Calc ['PL08'] = [‘PL06]–[‘PL07’]
Balance Sheet
BS01-Cash Input
BS02-Short term investments Input
BS03-Accounts receivable Input
BS04-Current assets Calc ['BS04'] = [‘BS01]+[‘BS02’] +[‘BS03’]
BS05-Long term assets Input
BS06-Total assets Calc ['BS06'] = [‘BS04’] +[‘BS05’]
BS07-Current liabilities Input
BS08-Long term liabilities Input
BS09- Total liabilities Calc ['BS09'] = [‘BS07’] +[‘BS08’]
BS10-Shareholders Equity Input Checks that BS06 = BS09 +BS10
Cash Flow Statement
CF01-Cash and cash equivalents, beginning of year Calc [‘CF01’] = [‘BS01’, previous month] +[‘BS02’,
previous month]
Fed through rule from within the same cube
Checks that CF01 =CF07 from previous month
CF02-Cash flows from (used in) operating activities Input
CF03-Cash flows from (used in) investing activities Input
CF04-Payments of capital and interest Input Feeds [‘CF04’] in the Expenses cube
CF05-Other financing activities Input
CF06-Cash flows from (used in) financing activities Calc ['CF06'] = [‘CF04’] +[‘CF05’]
CF07-Cash and cash equivalents, end of year Calc ['CF07'] =[‘CF01’] +[‘CF02’]+ [‘CF03’] +[‘CF06’]
Cash Flow ratios: these metrics show the
adequacy of cash at the Corporation to meet its
obligations; grouped by country for any given
period.
Capital Expenditure Coverage = [ ‘CF02’] /[‘CF04’]*100 -
100 (measures the ability of the company's operating
cash flow to meet its capital requirements)
Operating Cash Flow Ratio = [ ‘CF02’] /[‘BS07’]*100
(measures how well the company’s operations are able
to cover current liabilities )
Having both actual and planned data as part of
the OLAP financial model allows the Corporation to
define KPIs aligned with its strategic goals and
defined along multiple dimensions and varying
granularity. Planned and actual KPIs can then be
compared over time in order to measure and correct
deviations.
5 SUMMARY
This paper provides a proof of concept for OLAP-
based financial analysis and planning. It is also the
first step of a more long-term project aimed at
developing a full blown application based on an in-
memory OLAP platform, and a detailed teaching
case. We have described some of the salient features
of the design of the OLAP model using a real-world
scenario. OLAP technology helps create powerful
data-driven software applications to help decision
makers analyze financial data and make timely and
better informed decisions.
ICSOFT 2010 - 5th International Conference on Software and Data Technologies
354

6 POINTS FOR DISCUSSION
What are the advantages and disadvantages of an
in-memory OLAP approach?
The OLAP model was designed using a set of
dimensions described in Figure 5. What
alternative designs would you consider? Discuss
the way in which time dimensions have been
treated.
Using the business rules processed by the OLAP
engine allows for self-contained applications that
reduce the need for extra application
programming. Are there any disadvantages to
this approach?
REFERENCES
Codd E. F., Codd S. B., and Salley C. T., Providing On-
Line Analytical Processing to User–Analysts: An IT
Mandate. 1993, E.F. Codd and Associates.
Golfarelli, M., S. Rizzi, and A. Proli, Designing what-if
analysis: towards a methodology. In Proceedings of
the 9th ACM international workshop on Data
warehousing and OLAP. 2006, ACM: Arlington,
Virginia, USA.
Hasan, H. and P. Hyland, Using OLAP and
Multidimensional Data for Decision Making. IT
Professional, 2001. 3(5): p. 44-50.
Higgins, R. C., Analysis for financial management. 6th ed.
The Irwin/McGraw-Hill series in finance, insurance,
and real estate. 2001, Boston: Irwin/McGraw-Hill.
Kimball, R. and M. Ross, The data warehouse toolkit: the
complete guide to dimensional modeling. 2nd ed.
2002, New York: Wiley. xxiv, 436 p.
Koutsoukis, N.-S., G. Mitra, and C. Lucas, Adapting on-
line analytical processing for decision modelling: the
interaction of information and decision technologies.
Decision Support Systems, 1999. 26(1): p. 1-30.
Thomsen, E., OLAP Solutions: building multidimensional
information systems. 2nd ed. 2002, New York: Wiley
Computer Pub. xxiv, 661 p.r.
OLAP FOR FINANCIAL ANALYSIS AND PLANNING - A Proof of Concept
355
