
A CASE STUDY
Classification of Stock Exchange News by Support Vector Machines
P. Kroha, K. Kr
¨
ober and R. Janetzko
Department of Computer Science, University of Technology, Strasse der Nationen 62, 09111 Chemnitz, Germany
Keywords:
Text mining, Text classification, Support vector machine, Market news classification, Market news classifica-
tion in parallel.
Abstract:
In this paper, we present a case study concerning the classification of text messages with the use of Support
Vector Machines. We collected about 700.000 news and stated the hypothesis saying that when markets are
going down then negative messages have a majority and when markets are going up then positive messages
have a majority. This hypothesis is based on the assumption of news-driven behavior of investors. To check
the hypothesis given above we needed to classify the market news. We describe the application of Support
Vector Machines for this purpose including our experiments that showed interesting results. We found that the
news classification has some interesting correlation with long-term market trends.
1 INTRODUCTION
Currently, more and more commercially valuable
business news become available on the World Wide
Web in electronic form. However, the volume of busi-
ness news is very large. The first problem is to find
how much the news really move stock markets. The
next problem is that people do not have time enough
to read all the news. To solve those two problems
the automatic processing of news is necessary. One
of possibilities how to process news automatically is
classification.
In our project, we classified the market news into
two classes; positive news and negative news. But
the news classification was not the only goal. Fur-
ther, we investigated how the long-term trends corre-
spond to the news and whether the knowledge gained
from news can be used in an attempt to predict long-
term trends of financial markets. Papers already pub-
lished only investigate short-time influence of small
sets of messages suitable for day-trading. Our novel
approach is using Support Vector Machines (SVM)
for the classification of large sets of messages for
long-term market prediction. We used linear SVMs
as well as nonlinear SVMs, both with sequential and
parallel algorithms. We describe our experiments, ex-
perience, and results.
The rest of the paper is organized as follows. In
Section 2, we discuss the related work. In Section
3, we briefly explain the concept of Support Vector
Machines. In Section 4, the implementations we used
are described. Section 5 describes our experiments
in classification. In Section 6, we show the relation
between the number of positive resp. negative news
and market trends. We conclude in the last section.
2 RELATED WORK
The Support Vector Machine is a method often used
for text classification as has been shown e.g. in
(Joachims, 1998b), (Joachims, 1998a), (Joachims,
2001).
In our previous works (Kroha et al., 2006), (Kroha
et al., 2007) and (Kroha and Reichel, 2007), we suc-
cesfully used other methods for text classification but
there was no possibility to run the classification algo-
rithms in parallel. In (Kroha et al., 2006), we surpris-
ingly achieved the best results using the Naive Bayes
classifier. But we found that there are important clas-
sification problems that cannot be decided when using
the term frequency as the only object feature. We de-
veloped the next method (Kroha et al., 2007) based
on grammars that describe the characteristic features
of document classes in another way. In (Kroha and
Reichel, 2007), we compared the results of both meth-
ods.
Using Support Vector Machines (SVM), our goal
was to investigate the parallel approach to the text
331
Kroha P., Kröber K. and Janetzko R. (2010).
A CASE STUDY - Classification of Stock Exchange News by Support Vector Machines.
In Proceedings of the 5th International Conference on Software and Data Technologies, pages 331-336
DOI: 10.5220/0003043403310336
Copyright
c
SciTePress

classification problem and to compare the perfor-
mance and results of various classification methods.
Our experiments in (Janetzko, 2008) and (Kroeber,
2010) have shown that our previously used methods
resulted more or less in the same classification. Ad-
ditionally, we obtained information about the rate of
correctly classified documents.
3 INTRODUCTION INTO THE
CONCEPT OF THE SUPPORT
VECTOR MACHINE
Support Vector Machines (SVM) are supervised
methods of machine learning used for classification,
especially for two-class pattern recognition. The con-
cept is based on the linear separation of two sets of
data by a hyperplane in a n-dimensional feature space.
It needs a set of training objects as an input. Objects
to be classified have to be described as vectors. The
original optimal hyperplane algorithm proposed was
a linear classifier. The case of interest is when the
separation can be made only by a nonlinear function.
The nonlinear classification problem in a n-
dimensional feature space can be solved (based on
(Braverman et al., 1964)) in such a way that a set of
input vectors will be nonlinearly transformed into a
feature space that has higher dimension than n where
the classification problem becomes linear.
In (Boser et al., 1992) and (Vapnik, 1995), a way
has been suggested how to create nonlinear classifiers
by applying the kernel trick to maximum-margin hy-
perplanes. The resulting algorithm is formally sim-
ilar, except that the dot product of the mapping to
the higher dimensional space is replaced by a non-
linear kernel function. Using Support Vector Ma-
chines for text classification was deeply investigated
in (Joachims, 2001).
4 IMPLEMENTATIONS USED
The parameters of the separating maximum-margin
hyperplane of the SVM are derived by solving the
appropriate optimization. There exist several spe-
cialized algorithms. For our experiments described
below, we used implementations SVMlight (Vapnik,
1995), GPDT (Serafini et al., 2005) (working se-
quentially) and PGPDT (Zanni and Zanghirati, 2003)
(working in parallel):
• SVMlight implements the SVM presented by
Vapnik in (Vapnik, 1995). Its optimization algo-
rithm was described in (Joachims, 2001). It has
the ability to estimate the error rate, precision, and
recall. SVMlight has already been used for text
classification. We used the version 6.02 in our ex-
periments. In the first phase, the learning phase,
the model will be built from the training data. For
this process various parameters can be stated, e.g.
kernel function. The model is then used in the
next phase, in the classification phase.
• GPDT (Serafini et al., 2005) is able to train Sup-
port Vector Machines using large quantities of
data, some hundred thousand vectors. In compar-
ison to SVMlight, the GPDT supports only train-
ing and buidling of a classification model. Other
computations, e.g. regression, precision, recall,
are not included.
• PGPDT (Zanni and Zanghirati, 2003), (Zanni
et al., 2006) is a version of GPDT designed for
the use on MPI-based parallel systems with dis-
tributed memory. One of our goals was to find
how much time we can gain when using a parallel
approach.
The nonlinear tests both used GPDT/PGPDT be-
cause we found them to perform best on our prob-
lems.
5 Our Experiments
5.1 Data Preparation
We used the same stock exchange news in Ger-
man language as in our previous work (Kroha et al.,
2006). However, the time interval was extended from
1.11.1999 until 13.7.2007.
It was necessary to convert our data into sparse
vector format used by the implementations described
above. We separated the news, we built the feature
vectors and the classes, and produced the training and
test data. We used a stopwords list of about 650 items.
Lastly, we specified the 10.000 most frequently used
words in our news and ignored all the other words.
For producing feature vectors we used the Mal-
let library of Java classes. This process resulted in
about 720.000 feature vectors of length 10.000, con-
taining the normalized frequencies of words in the
news. There exist two distinct market trends - up and
down. Therefore we chose two classes representing
these trends and named them appropriately UP and
DOWN. We used the class UNKNOWN for not yet
classified news. This distinguishes news classified in
the trainig from news to be classified in the test.
To produce training data we used 75% of news of
each week (totally 391.426 vectors). The other 25%
ICSOFT 2010 - 5th International Conference on Software and Data Technologies
332
of news (totally 326.123 vectors) have been used for
testing. The data preparation took altogether about 3
hours of processing time.
5.2 Building a Classification Mode and
its Performancel
After the data had been prepared we started to build
the classification model of news using three different
implementations of SVMs.
It was necessary to experiment with different pa-
rameters. Our starting point is displayed in Tables 1,
2, 3. We adjusted those parameters until we obtained
the parameters given in Tables 4, 5, 6.
Table 1: Parameter tuning - 1.
SVMlight GPDT
kernel linear linear
q 10 4.000
n 10 1.332
c 31,2436 10
tolerance 0,001 0,001
iterations 183.428 277
solver 142.246
kernel eval. 14.707.934 1.228.220.040
CPU time 1.297,06 2.878,78
prepar. 755,80
comput. 2047,73
update 27,47
actual time 3h 16min 49min
vectors 235.083 246.455
Table 2: Parameter tuning - 2.
PGPDT
kernel linear
q 4.000
n 1.332
c 10
tolerance 0,001
iterations 278
solver iterations 132.489
kernel evaluations 2.617.571.750
CPU-run time (secs) 2.278,02
therefrom preparation 856,38
therefrom computation 1.189,63
therefrom updating 147,95
actual run time 41min
vectors 246.455
The first column shows the run time using the
standard parameters of SVMlight. We experimented
with GPDT/PGPDT parameters necessary for larger
subproblems. We tried using 4000 algorithm intern
Table 3: Parameter tuning - 3.
GPDT PGPDT
kernel nonlinear nonlinear
q 400 400
n 132 132
c 10 10
tolerance 0,001 0,001
iterations 5.093 5101
solver 172.407 890982
kernel eval. 719.387.854.363 23.896.255.511
CPU time 172.406,560 6845,6
prepar. 65,79 44,89
comp. 462.190 105,32
update 171.473.030 6304,92
run time 47h 54min 1h 55min
vectors 239.213 239.199
Table 4: Parameters finally obtained - 1.
SVMlight GPDT
kernel linear linear
q 10 2.000
n 10 666
c 10 10
tolerance 0,001 0,001
iterations 78.100 585
solver 176.986
kernel eval. 8.948.056 649.692.729
CPU time 1.418,29 1.351,97
prepar. 260,93
comput. 931,59
update 58,88
actual time 2h 49min 24min
vectors 246.137 246.440
variables for the subproblems, i.e. twice as much
as normal. The number of iterations was cut in half
but the number of kernel-evaluations doubled. To-
tally, GPDT needed 49 minutes, and PGPDT needed
41 minutes. In this case, the shorter computing time
dominated over growing overhead. The PGPDT im-
plementation was the fastest.
The final parameters and run times achieved can
be seen in Table 2. The parameter q describes the
number of algorithm intern variables in a subproblem,
n is the number of variables replaced after each itera-
tion and c is the value with which the false classified
vectors will be penalized. The parameter c was com-
puted automatically by
1
x
2
from training data.
The listed values in Tables 4, 5, 6 represent the
best parameter combinations we found. For subprob-
lems with 2.000 variables 585 iterations are sufficient.
SVMlight took 78.100 iterations for only 10 vari-
ables. Each of these two experiments needed between
A CASE STUDY - Classification of Stock Exchange News by Support Vector Machines
333
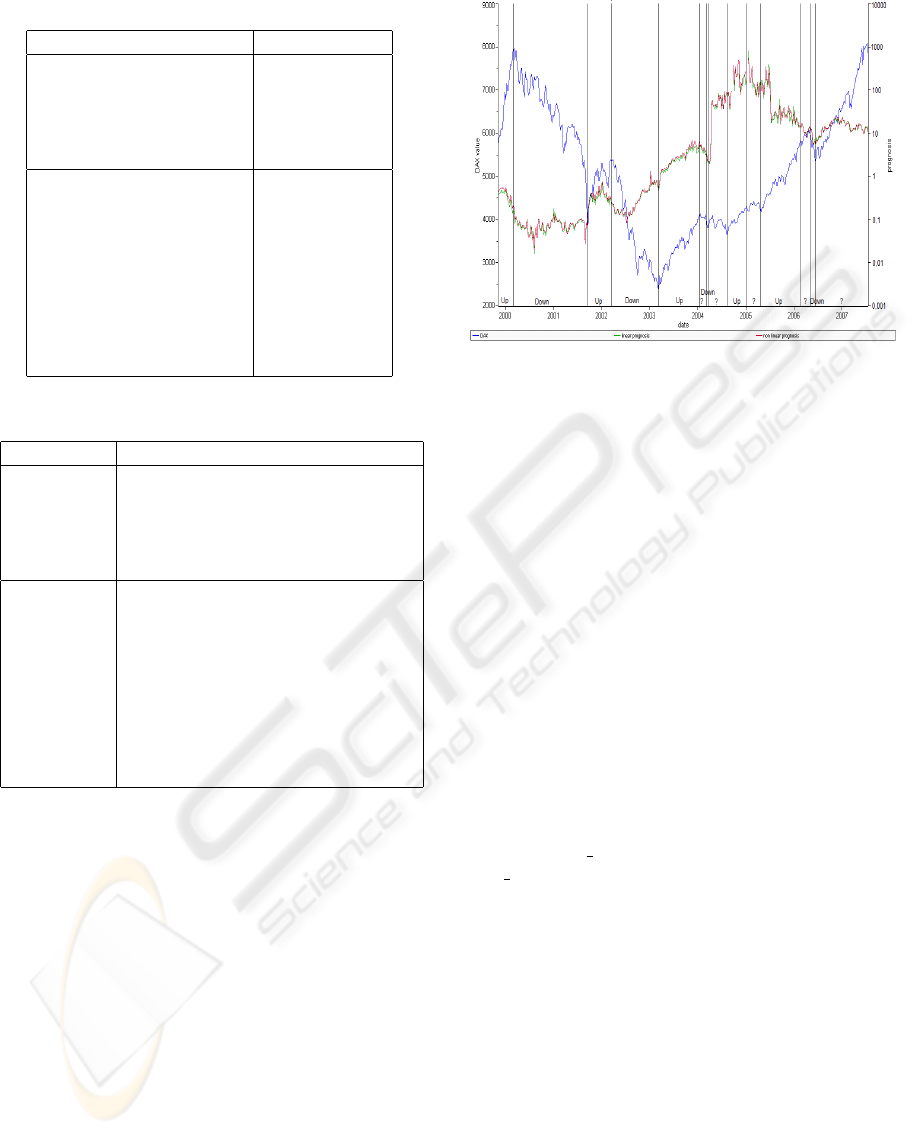
Table 5: Parameters finally obtained - 2.
PGPDT
kernel linear
q 2.000
n 666
c 10
tolerance 0,001
iterations 601
solver iterations 188.373
kernel evaluations 1.412.483.880
CPU-run time (secs) 363,28
therefrom preparation 43,33
therefrom computation 217,75
therefrom updating 57,12
actual run time 6min
vectors 246442
Table 6: Parameters finally obtained - 3.
GPDT PGPDT
kernel nonlinear nonlinear
q 400 400
n 132 132
c 10 10
tolerance 0,001 0,001
iterations 5.093 5.101
solver 172.407 890982
kernel eval. 719.387.854.363 23.896.255.511
CPU time 172.406,560 6845,6
prepar. 65,790 44,89
comput. 462.190 105,32
update 171.473.030 6.304,92
actual time 47h 54min 1h 55min
vectors 239.213 239.199
22 and 25 minutes of CPU time. The rest of the time
was used for the input of training data and the output
of model data. The nonlinear sequential classification
using GPDT took 47 hours and 54 minutes and there-
fore much more time than the linear classifications.
Changing q, n and c had significant impact on the lin-
ear runs. Nonlinear runtime, especially the sequential
nonlinear run didn’t improve at all by tinkering with
the parameters.
As we have found, the parallel implementation
PGPDT was used in published applications that are
relatively small compared to our data. For example
in (Zanni et al., 2006), it was tested using 10000 sam-
ples subset of the MNIST handwritten digits database,
constituted by 5000 samples of the digit ”8” and 5000
samples of the other digits. Compared with that our
data containing 717.549 documents is very large.
The PGPDT implementation made a huge impact
on runtime, especially combined with a nonlinear ker-
Figure 1: Comparison between linear and nonlinear classi-
fication.
nel. PGPDT ran on a 8 CPU-core Apple MacPro us-
ing OpenMPI and 8 processes. The runtime of the
linear kernel run was cut down from 24 minutes to 6
minutes. The extremely long 47 hour run time of the
nonlinear run was cut down to a comparatively small
2 hours. The number of kernel evaluations sunk from
719 billion to 23 billion. The update time sank by
171.466.726 seconds to 6.305 seconds. Parallel pro-
cessing boosted the runtime to acceptable levels.
6 THE CLASSIFICATION
OBTAINED
After the model was built, the next step was to clas-
sify the as of yet unclassified news, i.e. the news
that hadn’t been used for training. This was done
using the svn classify program, part of Joachim’s
svm light package. The classification of the linear
model’s 326.123 vectors took about 3 minutes. The
nonlinear model classification took about 5 hours.
The linear classifier classified 80% of the news cor-
rectly. The nonlinear classifier brought almost iden-
tical results and classified 81% correctly. Classi-
fied news have their time stamp, i.e. they belong to
a given week, and therefore the quotient Positive −
news/Negative − news can be presented as a time se-
ries and placed into the same graph as the market
trend of German stock exchange index DAX. The
forecast done in this way took about 2 minutes. The
result can be seen in Fig. 1.
As described above, we investigated the hypothe-
sis about a dependency between a quotient of positive
and negative news and market trend. The possibility
stated above is that the positive news have majority
ICSOFT 2010 - 5th International Conference on Software and Data Technologies
334

during upward trends. The question is whether a ma-
jority of positive news will be reached before the mar-
ket trend starts to go up. In such a case there would
be perhaps a small forecast possibility.
The Fig. 1 shows both linear and nonlinear prog-
nosis as well as the DAX values. The linear and non-
linear classifications are almost identical. Theoreti-
cally, a nonlinear SVM should classify better (Zanni
and Zanghirati, 2003). However, this was not the
case since our dataset was biased towards the DOWN
class. Therefore, the classifier classifies most of the
DOWN news correctly, since they are more promi-
nent.
During the time when the trend stays stable, i.e.
DOWN-phase 2000, about 90% - 95% of news are
correctly classified. When the trend becomes unsta-
ble, the precision of classification is going down to
40%, i.e. in UP-phase 2001, DOWN-phase 2004,
DOWN-phase 2006.
We can see that the news trend changed from
DOWN to UP with July 2002 but the market trend
changed from DOWN to UP with a delay in the 11.
week of 2003. In other break points, this phenomenon
cannot be seen so clearly but we can see the change of
the news trend from UP to DOWN at the end of 2006,
i.e. some months before the subprime crisis started to
break the long-term market trend.
This can be explained by investor psychology.
During the enthusiastic UP market trend, investors do
not want to accept the coming negative news and be-
cause of that the market trend changes with a delay.
Similarly, during a DOWN trend, investors interpret
the positive news with too much pessimism and be-
cause of that the market trend changes again, albeit
with a delay.
Unfortunately, we haven’t got enough data to pos-
tulate some new laws based on our investigations. In
such a way, we can investigate only changes of big
trends and they are rare. We haven’t got news in elec-
tronical form before 1999.
7 CONCLUSIONS
In this paper, we focused on the classification of large
sets of textual news by Support Vector Machine. In
technical terms, the SVM worked relatively well with
succesful classification rates of about 80%. It’s also
noteable that with 6 min during linear-parallel classi-
fication, the classification time was relatively low. As
described above, the nonlinear approach should have
yielded a better result (Zanni and Zanghirati, 2003).
Since the runtime of 6 minutes using linear PGPDT
is a lot smaller than 2 hours on nonlinear GPDT and
they differ only in about 0,8% classification quality,
the linear-parallel approach proved to be the best in
our experiments.
It is very interesting to note that PGPDT and
8 process-OpenMPI cut the runtime of the nonlin-
ear runs down from the extremely long runtime of
48hours to 0,04% of that - 2 hours. Also, paral-
lel solving greatly improved linear runtime as well.
Therefore we advise to make full use of the parallel
implementation, the differences in speed we discov-
ered were immense.
We found that SVM is a viable tool to classify
large sets of stock market messages. However, the
market processes are known to be chaotic (Peters,
1996). This means that any prediction and any fore-
cast mechanism is on principle questionable. We
could argue from our experimentation that SVMs are
a viable means of forecasting large movements in the
stock market. Also, we explained above the possi-
ble psychologic reasons of the delayed reaction of in-
vestors on changed news. But since our dataset is very
limited (our set of news in electronic form starts at the
end of 1999) and long-time stock market data is hard
to come by, no conclusive statement about the fore-
cast quality can be reached in a mathematically cor-
rect way. But for all that, we find the news classifi-
cation results and their correlation with the long-term
market trends interesting.
In the further work, we will try to support our
hypothesis by using more sophisticated classification
methods. Also, we will look for correlation with other
market indices.
REFERENCES
Boser, B., Guyon, I., and Vapnik, V. (1992). A training algo-
rithm for optimal margin classifiers. In In: Haussler,
D. (Ed.): Proceedings of 5th Annual ACM Workshop
on COLT, pages 144-152. Pittsburgh, PA, ACM Press.
Braverman, E., Aizerman, M., and Rozonoer, L. (1964).
Theoretical foundations of the potential function
methodin pattern recognition learning. In Automation
and Remote Control 25, pp. 821 - 837.
Janetzko, R. (2008). Using Support Vector Machines for
Classification of News. TU Chemnitz, (In German).
Joachims, T. (1998a). Making large-scale svm learning
practical. In LS8-Report, 24. Universitaet Dortmund.
Joachims, T. (1998b). Text categorization with sup-
port vector machines: Learning with many rele-
vant features. In http://www.cs.cornell.edu/ Peo-
ple/tj/publications/joachims98a.
Joachims, T. (2001). Learning to classify text using Support
Vector Machines. Kluwer Academic Publishers.
A CASE STUDY - Classification of Stock Exchange News by Support Vector Machines
335

Kroeber, K. (2010). Classification of Stock Market Mes-
sages Using Nonlinear Support Vector Machines. TU
Chemnitz.
Kroha, P., Baeza-Yates, R., and Krellner, B. (2006).
Text mining of business news for forecasting. In
In: Proceedings of 17th International Conference
DEXA’2006, Workshop on Theory and Applications of
Knowledge Management TAKMA’2006, pp. 171-175.
IEEE Computer Society.
Kroha, P. and Reichel, T. (2007). Using grammars for text
classification. In In: Cardoso, J., Cordeiro, J., Filipe,
J.(Eds.): Proceedings of the 9th International Confer-
ence on Enterprise Information Systems ICEIS’2007,
Volume Artificial Intelligence and Decision Support
Systems, pp. 259-264. INSTICC with ACM SIGMIS
and AAAI.
Kroha, P., Reichel, T., and Krellner, B. (2007). Text mining
for indication of changes in long-term market trends.
In In: Tochtermann, K., Maurer, H. (Eds.): Proceed-
ings of I-KNOW’07 7th International Conference on
Knowledge Management as part of TRIPLE-I 2007,
Journal of Universal Computer Science, pp. 424-431.
Peters, E. (1996). Chaos and Order in the Capital Markets.
John Wiley.
Serafini, T., Zanghirati, G., and Zanni, L. (2005). Gradient
projection methods for large quadratic programs and
applications in training support vector machines. In
Optim. Meth. Soft., 20, pp. 353-378.
Vapnik, V. (1995). The Nature of Statistical Learnig Theory.
Springer.
Zanni, L., Serafini, T., and Zanghirati, G. (2006). Parallel
software for training large scale support vector ma-
chines on multiprocessor systems. In Journal of Ma-
chine Learning Research, Volume 7.
Zanni, L. and Zanghirati, G. (2003). A parallel solver for
large quadratic programs in training support vector
machines. In Parallel Computing, 29, pp. 535 - 551.
ICSOFT 2010 - 5th International Conference on Software and Data Technologies
336
