MODEL-DRIVEN
AD HOC DATA INTEGRATION IN THE
CONTEXT OF A POPULATION-BASED CANCER REGISTRY
Yvette Teiken, Martin Rohde
OFFIS Institute for Information Technology, Escherweg 2, 26121 Oldenburg, Germany
Hans-J
¨
urgen Appelrath
Department of Computing, University of Oldenburg, Ammerl
¨
ander Herrstr. 144-118, Oldenburg, Germany
Keywords:
Data Management, Model Driven Software Development, MDSD, Data Analysis, Epidemiology, Data Inte-
gration
Abstract:
The major task of a population-based Cancer Registry (CR) is the identification of risk groups and factors.
This analysis makes use of data about the social background of the population. The integration of that data
is not intended for the routine processes at the CR. Therefore, this process must be performed by data ware-
house experts that results in high cost. This paper proposes an approach, which allows epidemiologists and
physicians at the CR to realize this ad hoc data integration on their own. We use model driven software design
(MDSD) with a domain specific language (DSL), which allows the epidemiologists and physicians to describe
the data to be integrated in a known language. This description or rather model is used to create an extension
of the existing data pool and a web service and web application for data integration. The end user can do the
integration on his/her own which results in a very cost-efficient way of ad hoc data integration.
1 INTRODUCTION
AND MOTIVATION
The principal tasks of a population-based Cancer
Registry (CR) are storing population related occur-
rences of cancer, differentiated monitoring and anal-
ysis of spatiotemporal trends, identification of risk
groups and factors and quality assurance of health
care (Batzler et al., 2008). In simple terms the CR
must perform an effective and efficient transforma-
tion of ”Input” (cancer reports of high quality and in
a timely manner) to an ”Output” (meaningful analysis
and reports as well as appropriate monitoring). This
also includes a couple of sub processes within the reg-
istry.
1.1 Population-based Cancer Registries
A CR needs a continuous documentation, commu-
nication and analysis process supported by software
tools due to the amount and complexity of the data.
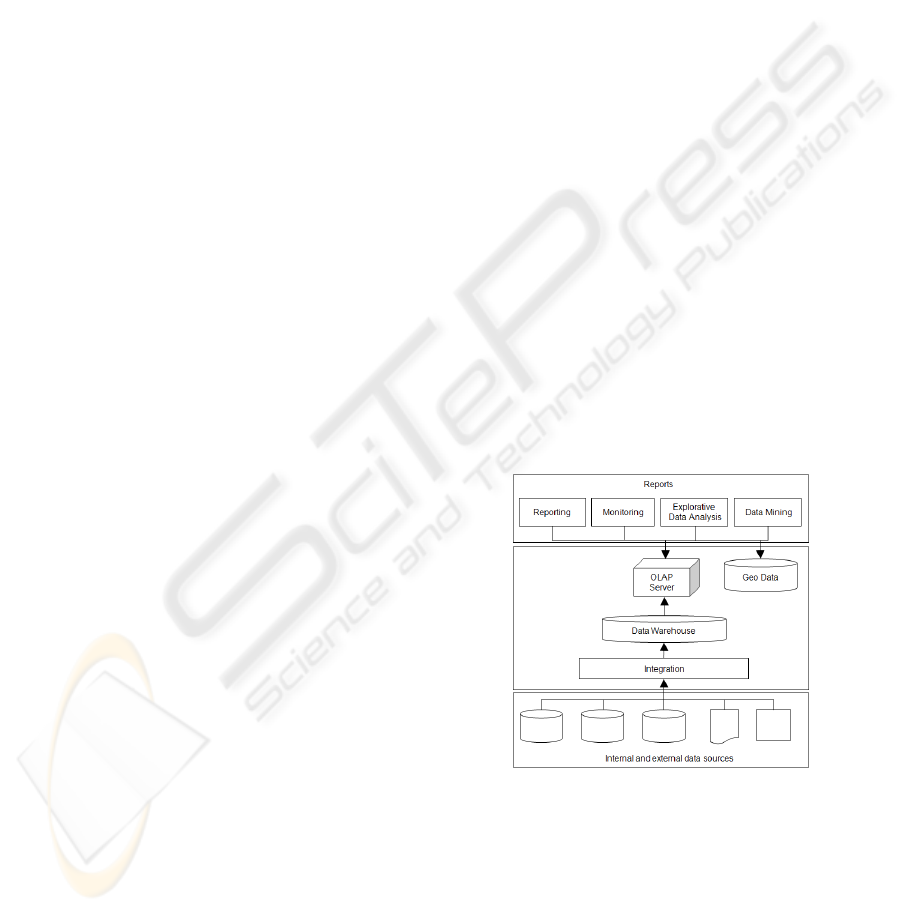
In figure 1 the general system architecture of such
a database-driven information system is shown. The
integration of different data sources in a central data
Figure
1: Software architecture at a CR.
warehouse is shown as well as the different analysis
options. These options range from reporting via con-
tinuous monitoring to spatial data mining with Gauß-
Kr
¨
uger coordinates. The statistical data analysis in
cancer epidemiology distinguishes itself by its explo-
rative nature and complexity of statistical operations.
Therefore, it makes great demands on a data ware-
house system.
337
Teiken Y., Rohde M. and Appelrath H. (2010).
MODEL-DRIVEN AD HOC DATA INTEGRATION IN THE CONTEXT OF A POPULATION-BASED CANCER REGISTRY.
In Proceedings of the 5th International Conference on Software and Data Technologies, pages 337-343
DOI: 10.5220/0003044703370343
Copyright
c
SciTePress

Finding trends in health and the correlation of dis-
eases and potential influencing factors are examples
of such analysis. A multidimensional data model
which especially allows the integration of specific sta-
tistical operations is an important precondition for the
realization of a data warehouse system for the CR.
1.2 The Multidimensional Data Model
for CR
Comprehensive meta information is needed for a mul-
tidimensional data model that allows for the spe-
cific requirements of epidemiologic research. Due
to this need the data model cannot be modeled us-
ing Star or Snowflake schemas described in (Kimball
et al., 1998). Therefore, the schema of the data ware-
house used by CR is based on the special multidi-
mensional data model MADEIRA (Modeling Analy-
ses of Data in Epidemiological InteRActive studies)
(Wietek, 1999) which considers these requirements
and maps them to relational data structures.
Figure 2 shows that the dimensions, a hyper-
cube, and a multidimensional model, are defined with
qualitative attributes as views on general dimensions.
Thereby, the comparison and conjunction of hyper-
cubes is simplified. The content of a hypercube is
specified by quantitative attributes. Quantitative at-
tributes describe a range for measures and an aggre-
gation function. The range can be given as lower and
upper values. The aggregation function is needed dur-
ing roll-up operations (Kimball et al., 1998) on data
pools.
A hypercube is defined between a basic data pool,
data basis and data cubes. The data basis defines a
multidimensional view on the whole data of the data
warehouse by their meta data. Data cubes on the other
hand are used by statistical analysis. The qualitative
attributes of data cubes describe statistical measures
and contain algorithms for the derivation of measures
from other qualitative attributes. The layers above
hide the concrete data model from the end user.
Based on the data model the data analysis platform
MUSTANG (Multidimensional Statistical Data Anal-
ysis Engine)(Koch et al., 2003) and the epidemiologi-
cal analysis platform CARESS (CARLOS Epidemio-
logical and Statistical Data Exploration System) were
developed.
1.3 Ad Hoc Data Integration at a CR
In addition to the routine processes of data integration
sometimes more data need to be integrated in the data
warehouse system for specific statistical analysis.
There are indications that social diversity or
poverty increases the risk factors of contracting can-
cer. To follow this hint, data of drinking, eating habits
and other factors like working conditions must be in-
tegrated in the analysis. For this kind of integration
which is outside of routine processes, new multidi-
mensional data structures and their relational repre-
sentation must be created. Furthermore, the data itself
has to be integrated into the dataset. This integration
data can be in bulk or single data rate. Bulk data is
mostly extracted from given data sources. These data
sources are mostly simple text files. This data has to
meet some quality assurances.
Until now only trained data warehouse adminis-
trators in the IT departments were able to perform
the data management with the process steps explained
above.
Due to personal and institutional separation be-
tween epidemiologists and data warehouse admin-
istrators the integration of new data is a time-
consuming coordination process. Furthermore the
SQL scripts needed manual customizations which is
also a time-consuming process. Hence, a timely in-
tegration of new data is not possible. For this reason
we searched for an approach that allows epidemiolo-
gists and physicians to integrate these kinds of data on
their own. In this approach we searched for a natural
understandable way to define data pools and to add
single and bulk data.
2 CONCEPTUAL DESIGN OF
MODEL-DRIVEN AD HOC
DATA INTEGRATION BASED
ON A DSL
To meet the requirements an MDSD approach based
on a graphical DSL has been designed and imple-
mented (Kelly and Tolvanen, 2008).For this domain
specific models has been specified and through trans-
formations artifacts has been generated. The use
of a DSL-based approach has many advantages over
an MDA-based approach which makes use of UML-
based DSLs. Some of these advantages are introduced
in chapter 4. Widespread opinion is that UML is
easier to learn than other modeling languages (Dom-
browski and Lechtenb
¨
orger, 2005). In our opinion
this may be true for software developers and archi-
tects but not for epidemiologist and physicians.
In figure 3 our MDSD-based approach is sketched.
If we want to integrate data into the data pool the
structure of the data must be clear. There must be
a description of the ad hoc data to integrate. This cir-
ICSOFT 2010 - 5th International Conference on Software and Data Technologies
338
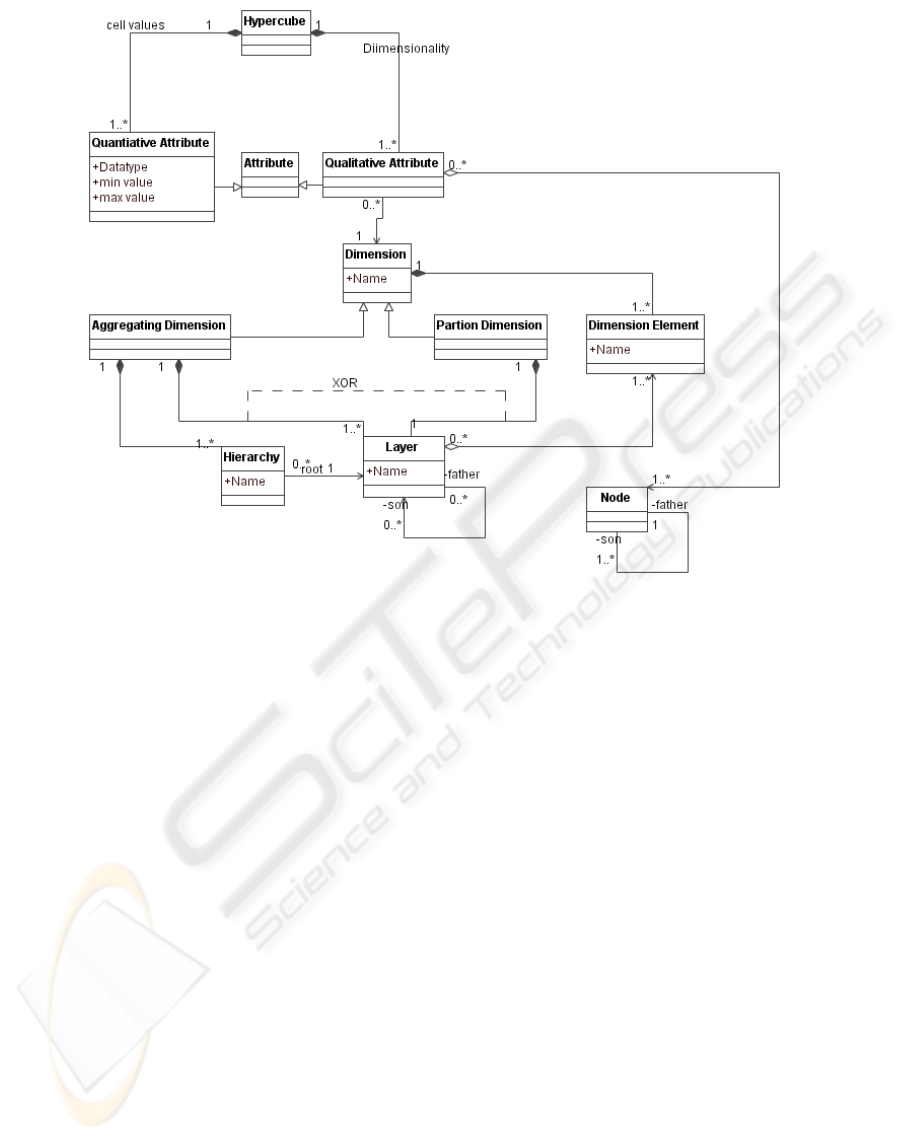
Figure 2: Meta model of the hypercubes and dimensions in MADEIRA.
cumstance is named information demand in figure 3.
Information demand describes measures and their di-
mensionality. This information demand can be seen
as a conceptual multidimensional model and is de-
scribed by a DSL. In the terminology of MDSD this
is called a Platform-Independent Models (PIM).
Based on this information demand two interme-
diate models are generated. The first one is called
database-schema-model and the second one is called
integration-schema-model. These intermediate mod-
els are generated by model-to-model transforma-
tions. The database-schema-model describes how the
multidimensionally described information demand is
mapped to a relational schema. Storage of multidi-
mensional data in a relational structure is a common
approach. In the terminology of MDSD this is called
a Platform-Specific Models (PSM) these kind of mod-
els can be created from a PIM.
The integration-schema-model describes the data
to be integrated as a single dataset. Based on these
two intermediate models, artifacts are generated by
model-to-code transformations. These artifacts are
scripts, software components and deployment infor-
mation that can be used by the epidemiologists and
physicians at CR.
2.1 Graphical appearance of the DSL
For a DSL an abstract and a concrete syntax must be
defined (V
¨
olter and Stahl, 2006). The concrete syntax
contains the symbols of the DSL used by the end user
to create the models. So the concrete syntax must be
in the domain of the end user. Only in this case we
can make advantages of a Domain-specific modeling-
based approach. When choosing a concrete syntax for
a DSL we have to decide whether to develop a new
language from scratch or to use an existing language.
An existing language has sometimes to be adapted for
the particular case. In most cases an existing language
is better engineered than a self-developed language at
first. Another big advantage of using an already ex-
isting language is that users of the language are al-
ready familiar with its concepts. They know the con-
cepts and notations and therefore need less training
time. The semantic of our DSL is not explicit mod-
eled but rather implicitly defined through transforma-
tions, generated artifacts, and the corresponding do-
main.
Epidemiologists and physicians in CR are famil-
iar with multidimensional concepts. Therefore we
use a well-known multidimensional modeling lan-
guage for our concrete syntax. Well-known multidi-
MODEL-DRIVEN AD HOC DATA INTEGRATION IN THE CONTEXT OF A POPULATION-BASED CANCER
REGISTRY
339
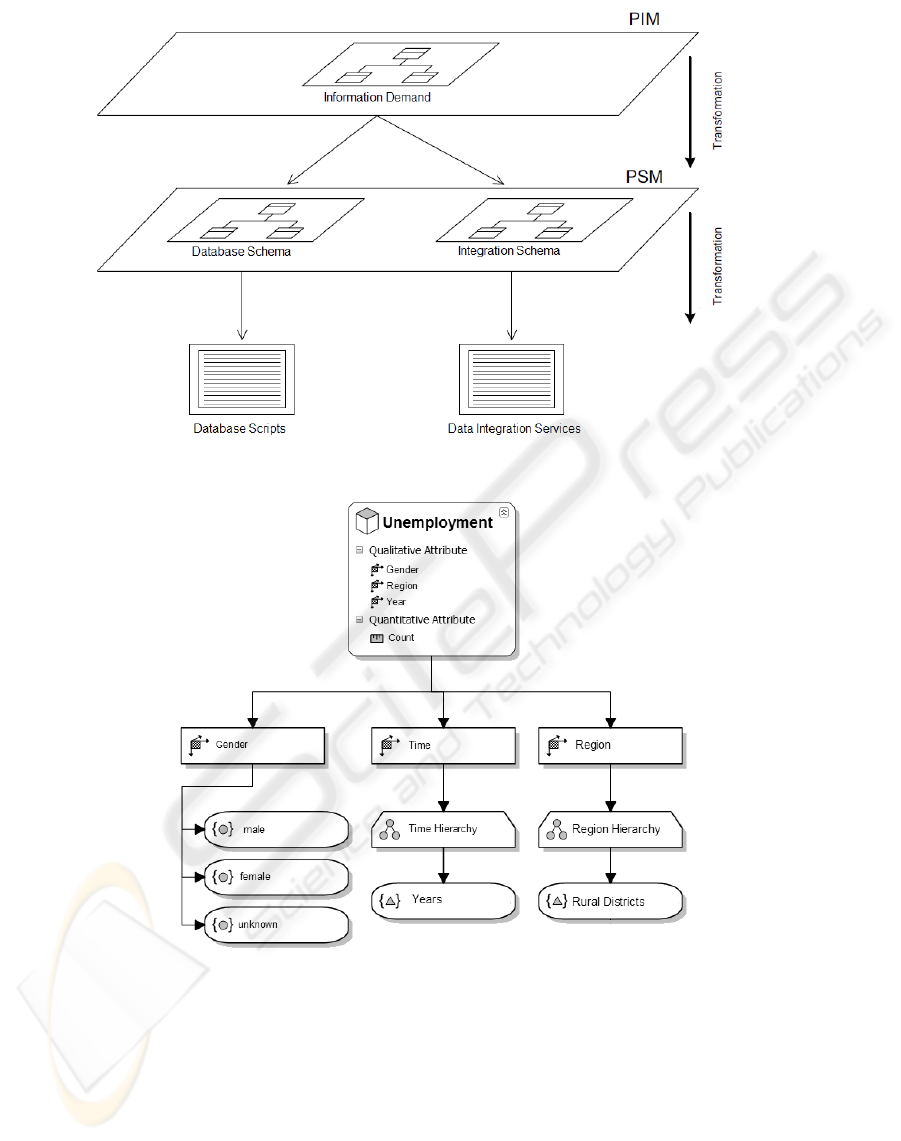
Figure 3: MDSD-based concept.
Figure 4: Example of a concrete syntax of the DSL (unemployment figures).
mensional modeling languages are Multidimension-
ale Entity-Relationship-Modell (MERM) by (Sapia
et al., 1999), Dimensional Fact Modelling (DFM)
by (Golfarelli et al., 1998) and Application Design
for Analytical Processing Technologies (ADAPT) by
(Bulos, 1996). From these three languages we wanted
to choose one as a fundament of our own DSL. Char-
acteristics for choosing the right language were ade-
quacy, maturity and usability. In all three languages it
is possible to model cubes and dimensions. ADAPT
is more flexible regarding modeling parts of dimen-
sions. ADAPT is the most common multidimensional
modeling language as said in (Hahne, 2005). Regard-
ing usability ADAPT offers more significant symbols
and notations than the other languages. One advan-
tage of MERM is that it is based on ER-Notation. In
computer science and related areas there are a lot of
people who are familiar with ER which makes it easy
for them to learn MERM. Thus, it is easy to address a
large numbers of users with MERM. However, based
ICSOFT 2010 - 5th International Conference on Software and Data Technologies
340
on usability and spreading we chose ADAPT as con-
crete syntax of our DSL as we could expect that a
large number of potential users are familiar with the
concepts of ADAPT as multidimensional language.
ADAPT does not cover all of our use cases, e.g. it
does not distinguish between qualitative and quantita-
tive attributes. For the use of MADEIRA it is neces-
sary to differ between these kinds of attributes. In our
realization we enhanced ADAPT with these concepts.
Quantitative attributes are used to represent measures.
Qualitative attributes define the dimensionality of a
data cube. This is used to model the granularity of the
data to integrate. In figure 4 an example of the con-
crete syntax is given. As implementation platform we
used Microsoft DSL Tools (Cook et al., 2007). Defin-
ing and modeling DSLs with Microsoft DSL Tools is
done graphically. A definition includes elements and
their relations between each other. In addition, ele-
ments can have a graphical representation.
2.2 Meta Models and Transformations
In the last section we described the concrete syntax of
our DSL. In this section we describe our meta model,
intermediate models, and our transformations.
ADAPT in its original form doesn’t have a meta
model. The definition of ADAPT is limited to a ver-
bal description of its elements. The reason for this
might be that the original attempt of ADAPT does not
have a technical representation. The most technical
representation of ADAPT that can be found so far are
Microsoft Visio shapes. If we want to use ADAPT
in a MDSD-based approach this is not sufficient. We
have to define an additional meta model. Our goal is
to map our models to the relational representation of
MADEIRA so we can use MADEIRA as shown in
figure 2 as our meta model.
2.3 Description of Intermediate Models
Based on an instance of a cube model two model-
to-model transformations are performed. One is
the database-schema-model and the other one is the
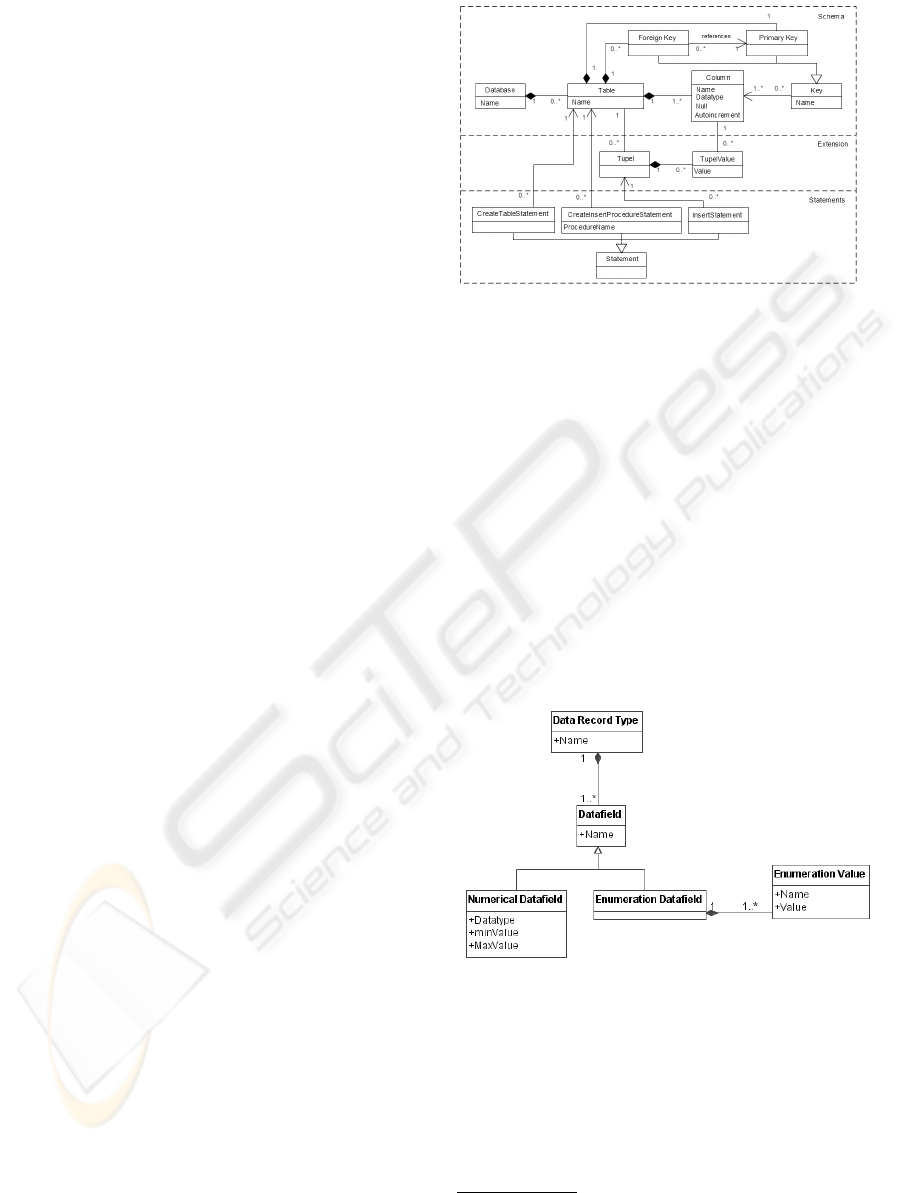
integration-schema-model. In figure 5 the database-
schema-model and in figure 6 the integration-schema-
model are shown as MOF models. The database-
schema-model describes the fundamentals of rela-
tional concepts. This intermediate model describes
the fact that multidimensional data in the CR data
warehouse is stored in a relational database. In the
MOF model it is not defined what kind of relational
storage is used. It is only clear that data is stored rela-
tional. What kind of relational representation is used
Figure 5: Relational meta model.
is defined through transformation
1
. The transforma-
tion describes how multidimensional data is mapped
to tables, tupels, keys and commands like Create Ta-
ble or Insert. Based on a general relational model,
instances can be transformed to concrete SQL com-
mands and scripts. This circumstance is indepen-
dent from relational storage of multidimensional data.
This means an instance of the xdatabase-schema-
model can have a relational representation as Star
Schema or Snowflake, for example. In our case we
realized a transformation to T-SQL. This is used to
populate MS SQL Server. Depending on the target
DBMS other transformations can be realized. For
evaluation we also implemented a transformation to
PL/SQL to support Oracle and PostgreSQL databases.
Figure 6: Data record meta model.
Next to the database-schema-model there is also
an integration-schema-model generated based on a
cube model. The integration-schema-model describes
data records that will be integrated in the data pool
of CR. For this kind of integration we use the DTO-
Pattern by (Fowler, 2002). In our case the DTO-object
is called data record. A data record describes one
single cell in a data cube. In our example a data
1
In this article transformations are only described
schematically, because they are to extensive for this kind
of publication.
MODEL-DRIVEN AD HOC DATA INTEGRATION IN THE CONTEXT OF A POPULATION-BASED CANCER
REGISTRY
341

record consists of an unemployment figure and addi-
tional information for gender, region and year. This is
called dimensional meta data. A Numerical Datafield
as seen in figure 6 is used to store numerical data,
e.g. a single unemployment figure. A Numerical
Datafield can be modeled with a minimum and max-
imum value. In our case negative values are not valid
because unemployment cannot be negative. We can
also exclude values higher than eight million because
of the population of our federal state. Minimum and
maximum are used to increase data quality. Also for
quality issues we simplified the input of dimensional
data. In our case no new dimensional data is created,
so it is possible to only reference this kind of infor-
mation. For this reason this information is modeled
as enumeration. With this concept we can improve
data quality even more. Currently this is sufficient
for data quality. For more broaden use of this ap-
proach some more complex data quality aspects have
to be taken in consideration. Based on instances of
database-schema-model and the integration-schema-
model artifacts can be generated.
3 GENERATED ARTIFACTS
In this section we describe how we generate artifacts
based on concrete instances of the meta model. The
artifacts we use in this article are parts of the informa-
tion logistic infrastructure, a web application, and an
XML web service for data acquisition. A prototypi-
cal implementation has been realized. Based on the
intermediate models model-to-model transformations
are triggered. Here, existing source code is extended
with generated schematic code. After this, the new
generated source code is compiled and the generated
application can be executed.
To deploy new databases within the data analy-
sis platform, models are transformed into executable
SQL scripts. These kind of scripts are identical with
those that have been written by the data warehouse ad-
ministrators before we introduced the MDSD-based
approach. When these scripts are executed with addi-
tional deployment information databases can be inte-
grated automatically in the data warehouse infrastruc-
ture.
We want to support single value data as well as
bulk data, so we generated different kinds of integra-
tion applications. First a web service is generated.
This web service accepts data based on the DTO defi-
nition. This service can be used to integrate bulk data
as well as it accepts single value data. This function-
ality is used in the generated web application. The
generated web application adds code for forms and
validation code to integrate single value data.
This web application is automatically deployed at
the CR. The application consists of generic, individ-
ual and schematic code, as defined in the principles
of MDSD (V
¨
olter and Stahl, 2006). The generic part
of the application is the same in every instance of
the web application. In our case workflow function-
ality and the fundamentals of authentication. Some
parts of the application are non-generic and cannot be
generated, this is called individual code. In our case
we only have interfaces for authentication as individ-
ual code in case previously unknown authentication
mechanisms have to be introduced. Schematic code is
that part of the application which is repeated in differ-
ent ways. In the web application this is forms and data
record descriptions for integration. This part of the
application is describes by the integration-schema-
model.
4 RELATED WORK
Relating to ADAPT and other multidimensional mod-
eling languages Gluchowski recently presented a pro-
totype that can create relational structures based on
ADAPT models in (Gluchowski et al., 2009). This
prototype is based on a self-defined meta model com-
parable to our approach. However, only SQL state-
ments for a single relational schema, the Star schema,
are generated and no services for data integration are
developed but there is an export to the Common Ware-
house Model (CWM) (OMG, 2001). This export al-
lows a better exchangeability of models by using an
accepted standard. For instance, in (Hartmann, 2008)
the CWM is used to overcome the heterogeneity of
data warehouses.
Although there is no standard for conceptual mod-
eling of data warehouses there are approaches to use
MDA and MDSD within the data warehouse process.
MD
2
A as described in (Mazon et al., 2005) is an ex-
ample of using MDA in the context of data ware-
houses. However, these approaches are only based on
UML as modeling language. Dombrowski describes
in (Dombrowski and Lechtenb
¨
orger, 2005) other ap-
proaches to using UML as data warehouse modeling
language. Likewise, the Multidimensional Modeling
Language (MML) in (Herden, 2000) is one example
of such a language.
In our opinion those approaches do not succeed
in proper abstraction. Proper abstraction and conse-
quently an alleviation in the data warehouse processes
can only be reached by specifying the models within
their domain and subsequently transform them to soft-
ware.
ICSOFT 2010 - 5th International Conference on Software and Data Technologies
342

5 EVALUATION
AND CONCLUSIONS
First tests were performed with epidemiologists and
physicians at the CR, who are experienced with mul-
tidimensional concepts. Given the graphical DSL and
new tools the people were able to model and create
new data integration scenarios as well as to import
single and bulk data. The acceptance and comprehen-
sibility of the graphical DSL is a result of the close co-
operation between our institute and CR with its users.
Using the DSL, unemployment figures could be
integrated into the data warehouse to analyze correla-
tions between unemployment and cancer incidence.
Unemployment figures made available by a statis-
tics office, were imported as single data records of
47 rural districts. After discovering a correlation at
this level the cube model of the unemployment fig-
ures was more detailed by the unemployment figures
of boroughs. Eventually, the unemployment figures
combined with gender data of about 1000 boroughs
were integrated for further analysis as bulk data start-
ing in 2003 by using the web service interface.
There are more evaluation scenarios that require
ad hoc data integration but in addition also need new
dimensions to be defined. One important task of
the CR is to answer requests by rural health author-
ities and citizens’ groups. That analysis handles with
small-scale clusters of cancer. That analysis also re-
quired ad hoc integration of special data. For example
population figures on basis of boroughs provided by
the statistics office are integrated yearly. However,
the requests by boroughs require more detailed fig-
ures, e.g. based on street sections. On the one hand
those data requires research of the residents registra-
tion office and on the other hand the spatial dimension
needs to be extended by, for example, street sections.
In addition to modeling new data cubes the creation
or extension of existing dimensions by suitable DSLs
is another important challenge and field of research.
REFERENCES
Batzler, W. U., Giersiepen, K., Hentschel, S., Husmann,
G., Kaatsch, P., Katalinic, A., Kieschke, J., Kray-
winkel, K., Meyer, M., Stabenow, R., and Stegmaier,
C. (2008). Cancer in Germany 2003-2004 Incidence
and Trends. Robert Koch-Institut, Berlin.
Bulos, D. (1996). Olap database design: A new dimension.
Database Programming&Design, Vol. 9(6).
Cook, S., Jones, G., and Kent, S. (2007). Domain Specific
Development with Visual Studio DSL Tools (Microsoft
.net Development). Addison-Wesley Longman, Ams-
terdam.
Dombrowski, E. and Lechtenb
¨
orger, J. (2005). Evalua-
tion objektorientierter Ans
¨
atze zur Data-Warehouse-
Modellierung. Datenbank-Spektrum, 5(15):18–25.
Fowler, M. (2002). Patterns of Enterprise Application Ar-
chitecture. Addison-Wesley Longman.
Gluchowski, P., Kunze, C., and Schneider, C. (2009). A
modeling tool for multidimensional data using the
adapt notation. In 42nd Hawaii International Con-
ference on System Sciences (HICSS-42).
Golfarelli, M., Maio, D., and Rizzi, S. (1998). The dimen-
sional fact model: A conceptual model for data ware-
houses. International Journal of Cooperative Infor-
mation Systems, 7:215–247.
Hahne, M. (2005). Das common warehouse metamodel
als referenzmodell f
¨
ur metadaten im data warehouse
und dessen erweiterung im sap business information
warehouse. In Vossen, G., Leymann, F., Lockemann,
P. C., and Stucky, W., editors, BTW, volume 65 of LNI,
pages 578–595. GI.
Hartmann, S. (2008). berwindung semantischer Hetero-
genitt bei multiplen Data-Warehouse-Systemen. PhD
thesis, University of Bamberg.
Herden, O. (2000). A design methodology for data ware-
houses. In Proc. of the 7th IEEE Intl. Baltic Workshop
(Baltic DB&IS 2000), pages 292–293. IEEE.
Kelly, S. and Tolvanen, J.-P. (2008). Domain-Specific Mod-
eling: Enabling Full Code Generation. John Wiley &
Sons.
Kimball, R., Reeves, L., Ross, M., and Thornthwaite, W.
(1998). The Data Warehouse Lifecycle Toolkit: Expert
Methods for Designing, Developing, and Deploying
Data Warehouses. John Wiley & Sons.
Koch, S., Meister, J., and Rohde, M. (2003). Mustang – a
framework for statistical analyses of multidimensional
data in public health. In Gnauck, A. and Heinrich, R.,
editors, 17th International Conference Informatics for
Environment Protection, pages 635–642.
Mazon, J.-N., Trujillo, J., Serrano, M., and Piattini, M.
(2005). Applying mda to the development of data
warehouses. In DOLAP ’05: Proceedings of the 8th
ACM international workshop on Data warehousing
and OLAP, pages 57–66, New York, NY, USA. ACM.
OMG (2001). Common warehouse metamodel (cwm) spec-
ification. Internet.
Sapia, C., Blaschka, M., H
¨
ofling, G., and Dinter, B. (1999).
Extending the e/r model for the multidimensional
paradigm. In ER ’98: Proceedings of the Workshops
on Data Warehousing and Data Mining, pages 105–
116, London, UK. Springer-Verlag.
V
¨
olter, M. and Stahl, T. (2006). Model-Driven Software
Development. Wiley & Sons.
Wietek, F. (1999). Modelling Multidimensional Data in
a Dataflow-Based Visual Data Analysis Environment,
volume 1626 of Lecture Notes in Computer Science.
Springer.
MODEL-DRIVEN AD HOC DATA INTEGRATION IN THE CONTEXT OF A POPULATION-BASED CANCER
REGISTRY
343
