
Optimizing Service Selection for Probabilistic QoS
Attributes
Ulrich Lampe, Dieter Schuller, Julian Eckert and Ralf Steinmetz
Multimedia Communications Lab (KOM)
Technische Universit
¨
at Darmstadt
Rundeturmstr. 10, 64283 Darmstadt, Germany
Abstract.
The service selection problem (SSP) – i.e., choosing from sets of func-
tionally equivalent services in order to fulfill certain business process steps based
on non-functional requirements – has frequently been addressed in literature con-
sidering deterministic values for the Quality of Service (QoS) attributes. However,
the usage of deterministic values does not reflect the uncertainty about the actual
value of an attribute during execution, thus ignoring the risk of QoS violations.
In the paper at hand, a simulative step, based on stochastic QoS attributes, is per-
formed as complement for optimally solving the SSP using linear programming
methods. With this two-step approach, uncertainties in the selected set of services
can be explicitly revealed and addressed through repeated selection steps, thus
allowing to prevent the violation of QoS restrictions much more effectively.
1 Introduction
In Service-oriented Architectures (SOA), business processes can be realized by compos-
ing loosely coupled services. Depending on their granularity, these services provide a
more or less complex functionality [1]. Thereby, the services are not necessarily located
only within the boundaries of the own enterprise. In the Internet of Services, multiple
service providers offer their services at various service marketplaces [2]. If services with
substitutable functionalities are available at different cost and quality levels, service
requesters have the opportunity to decide which services from which service providers
to select, based on their preferences regarding Quality of Service (QoS). This service
selection problem (SSP) respectively its solution recently attracted a lot of attention in
the literature [3–6].
In this problem, an abstract representation of a workflow is assumed to be given
(e.g., in Business Process Modeling Notation – BPMN), as well as a list of functionally
equivalent services which are able to accomplish the tasks of the respective workflow
steps. The aim is to assign each workflow step exactly one service from the respective
set of functionally equivalent candidate services, so that the overall (workflow) QoS
is optimized and the requesters’ end-to-end QoS requirements are satisfied. In order
to compute an (optimal) solution, almost exclusively deterministic values for the QoS
attributes are considered at planning time in the literature. However, these values do not
reflect the uncertainty that is associated with an attribute during execution. E.g., response
times – i.e. the elapsed time period between the service invocation to the response arrival
Lampe U., Schuller D., Eckert J. and Steinmetz R. (2010).
Optimizing Service Selection for Probabilistic QoS Attributes.
In Proceedings of the 4th International Workshop on Architectures, Concepts and Technologies for Service Oriented Computing, pages 92-101
DOI: 10.5220/0003051000920101
Copyright
c
SciTePress

– may fluctuate due to varying network or computational load, thus resulting in a violation
of the requester’s QoS requirements in the actual workflow execution.
Therefore, we propose to perform an additional simulation step that takes stochastic
distributions for the QoS attributes into account after having computed the optimal
solution to the SSP (considering only deterministic values). This simulation step allows
to detect potential violations of QoS restrictions in the actual execution, based on the
respective probability of such events. Depending on the requester’s preferences, the
outcome of the simulation may trigger repeated optimization steps using additional
restrictions. As a proof-of-concept, we implemented and evaluated a simulation for the
QoS attribute response time.
The remainder of this work is structured as follows: In Section 2, we will present our
approach for optimally solving the SSP using linear programming, based on deterministic
QoS values. In Section 3, the potential drawbacks of deterministic optimization will
be outlined. Based on the findings, a simulation process that relies on stochastic QoS
attributes will be presented and evaluated using a prototypical tool. The paper closes
with a conclusion and an outlook of our future work in Section 4.
2 Optimal Service Selection for Complex Workflows
In this section, we present our approach for the computation of an optimal solution to
the SSP. For this, we formulate a linear optimization problem, which can be solved
optimally – if a solution exists – using (mixed) integer linear programming (MILP)
techniques from the field of operations research [7]. The optimization problem consists
of a target function and a set of constraints. We perform a worst-case analysis – instead
of an average-case analysis – by applying our aggregation functions proposed in [8]
in order to make sure that all restrictions are satisfied at planning time. Performing an
average-case analysis would have led to a solution, where the restrictions are satisfied
only in average.
For the optimization, we consider the QoS attributes response time
e
(elapsed time
from the service invocation until the response arrival), costs
c
(costs for the invocation
of a service), reliability
r
(the probability that the service successfully provides the
requested results), and throughput
d
(number of parallel service invocations), although
the mentioned simulation step will only be performed for response time
e
. With these
QoS attributes – in fact with a subset of these attributes – the aggregation types summa-
tion, multiplication and the min/max operator are covered. The integration of further
aggregation types is straightforward.
In the paper at hand, we concentrate on the workflow patterns sequence, parallel
split (AND-split), synchronization (AND-join), exclusive choice (XOR-split), simple
merge (XOR-join), and arbitrary cycles (Loop), which only form a subset of all workflow
patterns (cf. [9]). The patterns can be combined to create complex workflows. An
example for such a complex workflow is given in Figure 1.
We consider an abstract workflow (e.g., in BPMN), consisting of
n
tasks respectively
process steps
P S
i
. For each
P S
i
with
i ∈ I = {1, ..., n}
, a set
J
i
of
m
i
services
j
i
∈ J
i
= {1, ..., m
i
}
, able to realize
P S
i
, exists. Each process step
P S
i
thereby is
realized by exactly one service
j
i
. This is indicated by the demand for (binary) decision
43

p
2
p
1
ρ
Fig. 1: Example abstract workflow.
variables
x
ij
∈ {0, 1}
(cf. condition (14)). The logical order of the process steps is
depicted from the abstract workflow as follows: in case
P S
k
is a direct successor of
P S
i
, we add
P S
i
→ P S
k
to a set
DS = {P S
i
→ P S
k
|P S
k
direct successor of P S
i
}
.
DS
s
is the set of start tasks, i.e., the tasks that need to be executed first in the workflow.
In addition, we define
DS
e
as the set of end tasks, i.e., tasks with no direct successor.
To give an example, we refer to Figure 1. Here,
P S
3
is a direct successor of
P S
2
. We
therefore add P S
2
→ P S
3
to DS.
With respect to XOR-splits and XOR-joins, we define a set
L = {1, ..., o}
of
o
path
numbers for the paths within the XOR-split and -join – and name these paths XOR-paths.
Thereby,
l ∈ L
represents the respective XOR-path number. The process steps
P S
i
l
within an XOR-path are assigned to a set
W
l
,
P S
i
l
∈ W
l
= {P S
i
|P S
i
in XOR-path l}
,
and their respective process step numbers
i
l
are assigned to the set
IW
l
,
i
l
∈ IW
l
=
{i|P S
i
∈ W
l
}
. Further,
S = {P S
1
, ..., P S
n
}\(W
1
∨ ... ∨ W
o
)
represents a set of the
remaining process steps
P S
i
when removing process steps
P S
i
l
from a set of all process
steps.
IS = I\(IW
1
∨ ... ∨ IW
o
)
denotes the set of the corresponding process step
numbers.
Within an XOR-path, we assume a sequential arrangement of the process steps and
label the first and last process steps with
P S
1
i
1
and
P S
e
i
1
. The respective start times
for these process steps are labeled analogously with
t
1
i
l
and
t
e
i
l
. The probability that
XOR-path l is executed, is indicated by p
l
. We demand
P
o
l=1
p
l
= 1.
Regarding the workflow pattern Loop,
I
loop
represents the set of process step num-
bers
i
with a Loop. Further,
ρ
i
denotes the respective probability that this Loop is
followed (cf.
P S
4
in Figure 1). Thereby,
ρ
is independent of whether the Loop was
followed or not before. If a Loop is followed multiple times, the respective process
steps are executed multiple times, too. As this affects the regarded, aggregated QoS
values, we define
e
∗
ij
in (1),
c
∗
ij
in (2), and
r
∗
ij
in (3) in dependence of a boundary value
consideration of ρ (cf. [8]). The throughput d
ij
is not effected by a Loop.
e
∗
ij
:=
(
1
1−ρ
i
e
ij
, if i ∈ I
loop
e
ij
, else
(1)
c
∗
ij
:=
(
1
1−ρ
i
c
ij
, if i ∈ I
loop
c
ij
, else
(2)
r
∗
ij
:=
(
(1−ρ
i
)r
ij
1−ρ
i
r
ij
, if i ∈ I
loop
r
ij
, else
(3)
44

Based on our aggregation functions in [8], we propose Model 1 to perform the
proposed worst-case analysis. Here, QoS restrictions are labeled with b (bounds).
Model 1: Optimization Problem.
Objective Function
minimize F (x) =
X
i∈I
X
j∈J
i
c
∗
ij
x
ij
(4)
s.t.
t
i
= 0 ∀i ∈ I|P S
i
∈ DS
s
(5)
t
i
+
X
j∈J
i
e
∗
ij
x
ij
≤ t
k
∀i ∈ I|P S
i
→ P S
k
∈ DS (6)
t
i
+
X
j∈J
i
e
∗
ij
x
ij
≤ b
e
∀i ∈ I|P S
i
∈ DS
e
(7)
max
l∈L
{(t
1
i
l
+
X
i∈IW
l
X
j∈J
i
e
∗
ij
x
ij
)} ≤ t
k
∀i ∈ I|P S
e
i
l
→ P S
k
∈ DS (8)
max
l∈L
{(t
1
i
l
+
X
i∈IW
l
X
j∈J
i
e
∗
ij
x
ij
)} ≤ b
e
∀i ∈ I|P S
e
i
l
∈ W
l
(9)
X
i∈IS
X
j∈J
i
c
∗
ij
x
ij
+ max
l∈L
{
X
i∈IW
l
X
j∈J
i
c
∗
ij
x
ij
} ≤ b
c
(10)
(
Y
i∈IS
X
j∈J
i
r
∗
ij
x
ij
) · (min
l∈L
{(
Y
i∈IW
l
X
j∈J
i
r
∗
ij
x
ij
)}) ≥ b
r
(11)
min{min
i∈IS
{
X
j∈J
i
d
ij
x
ij
}, min
l∈L
{ min
i∈IW
l
{
X
j∈J
i
d
ij
x
ij
}}} ≥ b
d
(12)
X
j∈J
i
x
ij
= 1 ∀i ∈ I (13)
x
ij
∈ {0, 1} ∀i ∈ I, ∀j ∈ J
i
(14)
Regarding Model 1, it has to be noted that the workflow patterns AND-split and
AND-join are already covered in (8) to (12) (cf. [8]).
To compute an optimal solution using MILP techniques, a linear optimization
problem is required. As the min/max operator as well as the multiplication are non-linear
aggregation types regarding the decision variables
x
ij
, we apply the approximation (15)
to (11) – which is very accurate for values
z
ij
close to 1 (like reliability) [10] – and
exchange constraints (8)–(12) for (16)–(20). To explain this (second adaptation step), it
has to be noted that if the minimum (maximum) of a set of values has to be higher (lower)
or equal to a certain bound, each element of this set needs to satisfy this constraint.
n
Y
i=1
m
i
X
j=1
z
ij
x
ij
≈ 1 −
n
X
i=1
(1 −
m
i
X
j=1
z
ij
x
ij
) (15)
t
1
i
l
+
X
i∈IW
l
X
j∈J
i
e
∗
ij
x
ij
≤ t
k
∀l ∈ L, ∀i ∈ I|P S
e
i
l
→ P S
k
∈ DS (16)
t
1
i
l
+
X
i∈IW
l
X
j∈J
i
e
∗
ij
x
ij
≤ b
e
∀l ∈ L, ∀i ∈ I|P S
e
i
l
∈ W
l
(17)
45

X
i∈(IS∨IW
l
)
X
j∈J
i
c
∗
ij
x
ij
≤ b
c
∀l ∈ L (18)
1 −
X
i∈(IS∨IW
l
)
(1 −
X
j∈J
i
r
∗
ij
x
ij
) ≥ b
r
∀l ∈ L (19)
min
i∈I
{
X
j∈J
i
d
ij
x
ij
} ≥ b
d
(20)
Having conducted these substitutions, an optimal solution can be obtained by apply-
ing MILP techniques.
3 Stochastic Simulation of Complex Workflows
In the previous section, we have outlined how an optimal set of services can be selected
for the process steps in a complex workflow, based on given QoS constraints. Because
the underlying optimization problem is solved using MILP, the usage of deterministic
QoS attributes is required. These fixed values commonly represent a lower or upper
bound that is guaranteed by a service provider with respect to a certain QoS attribute in
terms of a Service Level Agreement (SLA).
However, the usage of deterministic values does not reflect the uncertainty (or risk,
which we use as a synonym) that may be associated with QoS attributes. Response time,
e.g., is ultimately a stochastic variable that depends on various random determinants,
such as network and computational load. Consider two sets of services for the same
business process, where the second set has a slightly higher average response time for
each service. However, the variance in response time is much lower for the second set,
e.g., due to the usage of load-balancing techniques. While the first set is optimal with
respect to the objective of minimal (average) response time, it exhibits a much more
fluctuating behavior with respect to this attribute. This may lead to an increased risk of
exceeding certain reponse times threshold, which is undesired. Thus, we believe that
the notion of optimality in service selection needs to regard two aspects: the average
outcome of an QoS attribute as well as its fluctuation.
Accordingly, we propose to extend the representation and computation of QoS
attributes in a manner that appropriately incorporates uncertainty. Our approach adapts a
methodology suggested by Dawson and Dawson in the domain of project planning [11].
They introduce the notion of generalized activity networks [12]. Such networks consist
of nodes and edges. Nodes represent activities (or tasks); edges represent precedence
relationships and thus paths between the activities, where each task may have one or
more incoming and outgoing incident edges. For additional details and an example, we
refer to Dawson and Dawson [12]. Notably, the duration for each activity is given as
stochastic distribution, rather than a deterministic value, in generalized activity networks.
This is a well-known principle that has been applied in traditional planning techniques,
such as PERT, which was devised in the early 1960s [13]. Furthermore, if more than
one edge results from an activity, all edges are annotated with an execution probability.
These execution probabilities may also be correlated between edges.
Following the findings by Schonberger [14], who states that traditional planning
techniques such as PERT commonly underestimate the overall duration of an activity
46

network, Dawson and Dawson utilize simulation as a means of analyzing generalized
activity networks [11]. I.e., the activity network is virtually executed a selected number
of times; in this process, the duration of each activity and choice of path execution
is drawn as a random variable. The individual durations of all executed activities are
then aggregated into an overall duration in each iteration. From the distribution of
aforementioned overall durations, conclusions can be drawn about the characteristic of
the activity network in actual execution. Most importantly, the probability that a set of
activities exceeds a certain threshold due to the fluctuations in duration can be inferred.
The notion of generalized activity networks can easily be transferred to workflows
as a special application domain. In this scenario, services then correspond to activities,
while splits (joins) constitute dummy activities with multiple outgoing (incoming) edges.
Depending on the type of split (AND, XOR, or Loop), the execution probabilities of the
edges and respective correlations will differ. E.g., in the case of AND-splits, each edge
will be assigned a probability of 1, due to the fact that each edge is certainly executed.
Because services have multiple non-functional attributes, we not only adapt, but also
extend Dawson and Dawson’s approach. Namely, we allow for an arbitrary number of
random variables, representing QoS attributes, being associated with each activity (i.e.
service) apart from duration (which, in the context of workflows respectively services,
translates into response time). In our proposed methodology, each QoS attribute for each
service is modeled as an independent random variable adhering to some probability
distribution. This loosely relates to the idea of soft contracts in Web service orchestration,
as proposed by Rosario et al. [15].
The probability distribution may essentially be determined in two ways. The first
option is to infer it, based on historic execution data of a service. This requires the
installation of proper monitoring mechanisms. After a relevant sample has been collected,
a QoS attribute such as response time may, e.g., be represented through a normal
distribution. The second option is that a service provider explicitly specifies a probability
distribution for each QoS attribute.
In order to infer execution probabilities for each path, three options exist. The first is
mining from historical data again. However, this requires that a workflow (or at least a
workflow segment) that is identical to one being simulated has previously been executed
and monitored. The second option is to have an user manually assign the probabilities,
based on his or her knowledge about the underlying business process. The third and final
option is to utilize conservative default values, assuming that either each path (in case of
AND-splits) or the worst path with respect to each individual QoS attribute (XOR-splits)
will be executed.
Figure 2 depicts an example workflow for which a set of services (S1 through S5) has
been selected. It addition, the random variables and respective probability distributions
for each service, as well as execution probabilities for each edge, are illustrated. For
reasons of simplicity, solely the random variables for the QoS attribute response time
are included. For service S1, e.g., the response time is given by
X
e;1
, which is normally
distributed (
N
) with a mean value of 6.3 seconds and a standard deviation of 1.5 seconds.
For the XOR-split, the probability of executing the top and bottom path is 0.3 and 0.7
respectively. Accordingly, for the Loop construct, the probability of looping and thus
repeatedly executing S4 is 0.25.
47

p
2
= 0.7
● ●
p
1
= 0.3
●
X
e;2
= N(3.2,0.9)
3.5 - -
X
e;3
= N(2.0,0.5)
1.7 - -
ρ = 0.25
- 1x 0x
9.7 8.4 7.4
X
e;5
= N(8.1,2.5)X
e;1
= N(6.3,1.5)
5.8 6.7 6.4
X
e;4
= N(2.5,1.1)
-
2.8
2.3
3.0
Fig. 2: Example workflow including simulation outcomes.
Figure 2 further depicts three exemplary simulation runs for the sample workflow.
For every service, the randomly drawn response times are depicted in the boxes next to
the random variables. For the XOR-split, the pursued path is indicated by a bullet; for
the Loop construct, the number of additional executions (repetitions) of S4 is depicted.
As can be seen, each run results in a different outcome for each service with respect
to response time and in varying paths being executed. E.g., in the first iteration in the
example, services S1, S2, S3, and S5 have response times of 5.8, 3.5, 1.7, and 9.7 seconds
respectively. The lower path is not executed, and thus, S4 and the consecutive Loop
construct are omitted. Accordingly, the overall response time for the first iteration is
20.7 seconds (and 20.2 and 16.8 seconds for the second and third iteration respectively).
Once the process is repeated multiple times, a representative distribution for each QoS
attribute can be obtained.
Service selection and workflow simulation serve as a mutual complement: In the first
step, a set of services is selected by solving a linear optimization problem. This provides
an optimal result with respect to the objective of minimizing total cost and allows to
make statements about the workflow characteristics in theory. In the second step, the
resulting workflow is simulated, ideally based on historic execution data, which allows
to anticipate the workflow characteristics in practical execution. If the uncertainty in the
workflow is found to be unacceptable with respect to given constraints, the selected set
of services is discarded. This may, e.g., be the case if a specified response time constraint
is not met with a certain probability. Consecutively, the process of computing an optimal
solution is repeated with further restrictions. A manifest strategy is to explicitly exclude
one or more services with the highest standard deviation in a critical QoS attribute from
the set of candidate services.
To assess the principal benefits and effectiveness of our approach, we have imple-
mented a prototypical workflow simulation tool in Java. The tool allows to specify
complex workflows, consisting of services and their structure, using an XML-based for-
mat
1
. For each service, an arbitrary number of QoS attributes, along with the respective
probability distributions, may be specified and freely parameterized.
A simulation with one million iterations has been conducted for the example work-
flow in Figure 2 using the aforementioned tool. Additionally, the workflow has been
1
A sample listing is available from
http://www.kom.tu-darmstadt.de/ lampeu/icsoft-2010/workflow.xml
48
0
2000
4000
6000
8000
10000
12000
14000
16000
18000
20000
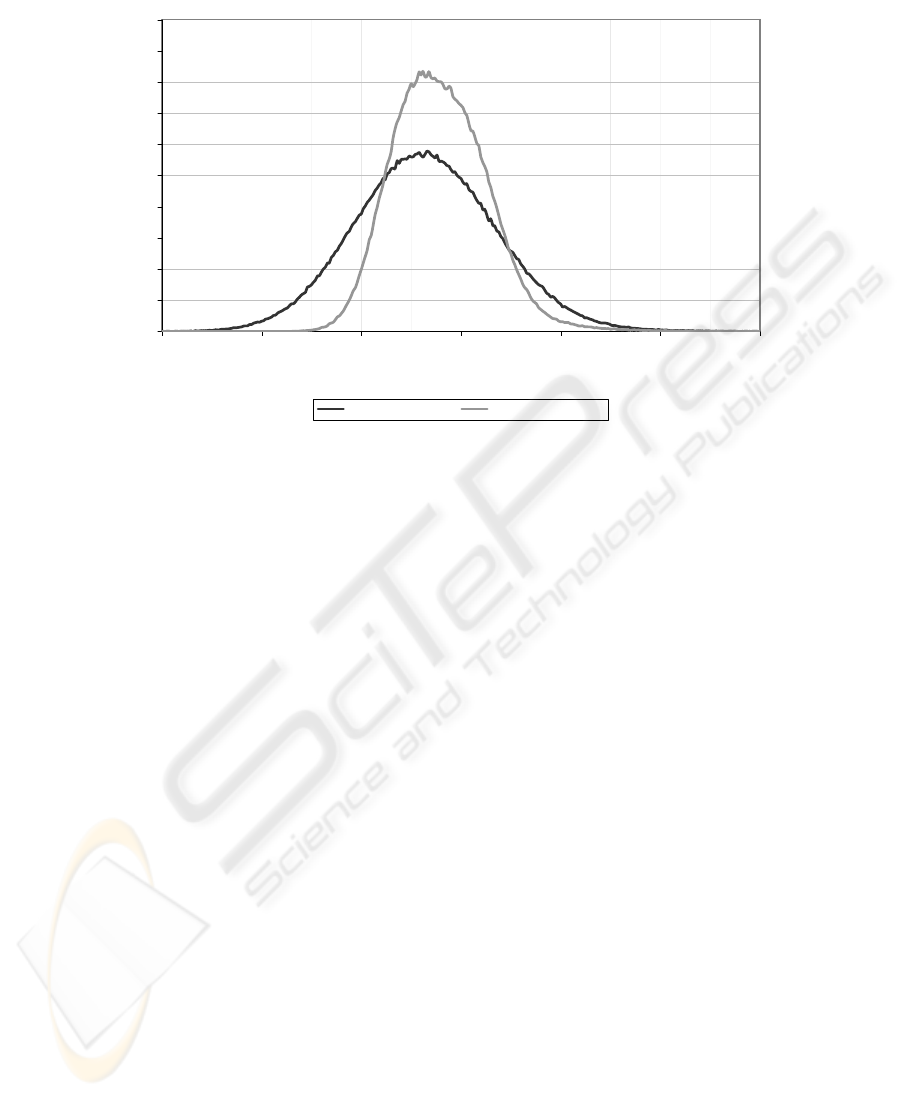
5 s 10 s 15 s 20 s 25 s 30 s 35 s
Overall workflow response time
Absolute frequency
Original workflow Modified workflow
Fig. 3: Distribution of the overall response time for two workflows.
modified for a second simulation. In detail, the mean of the response time probability
distribution for each service was incremented by 0.2 seconds, and the standard deviation
was set to half of its original value. I.e., each initially selected service has been replaced
by a variant that is less optimal on average, but also shows less fluctuation in terms of
response time. In practice, this process would be iteratively conducted for one service at
a time.
The resulting distributions of the workflows’ overall response times are depicted
in Figure 3, where the absolute frequency refers to clusters (or classes) of outcomes
that were identical up to the first decimal place. While the modified workflow responds
slower on average, it can be seen that it is significantly more favorable once a strict
response time constraint of approximately 20 seconds or more has been specified. This
figure is fairly close to the average response time of 18.2 and 18.9 seconds for the
original and modified workflow respectively. In these cases, the original workflow is
much more likely to break the constraint than the modified workflow. E.g., a response
time restriction of 22.5 seconds is violated with a probability of 11.15% by the original
workflow – for the modified workflow, the probability is only 6.25%, i.e. roughly half.
Differently stated, an increase in average response time (and cost) is traded against a
decrease in uncertainty – namely of breaking an overall response time constraint – by
replacing the original services through their alternative counterparts.
4 Conclusions
In the work at hand, we have presented two complimentary approaches to the problem
of QoS-aware service selection for complex workflows. As foundation, we have outlined
how an optimal set of services can be identified under given QoS constraints using
49

linear programming. However, this process is based on deterministic values, which
insufficiently reflect the uncertainty associated with a QoS attribute in actual execution.
E.g., response times may heavily fluctuate due to network and computational load, thus
leading to QoS violations in the actual execution of a workflow.
As a solution, we have adapted an existing methodology for the simulation of
generalized activity networks to the specific field of workflows in SOA. This simulation
process allows to assess the expected characteristics of a workflow, most importantly
the likelihood that a QoS constraint will be violated, in more detail. Depending on
a requester’s preferences, the outcome of the simulation process can be utilized to
repeatedly conduct the service selection procedure, thus minimizing the probability of
QoS violations more effectively. The practical applicability and benefit of our approach
has been proven using a prototypical implementation of a workflow simulation tool.
In our future work, we aim at combining the currently separated steps of service
selection and workflow simulation into an integrated tool. We will further investigate
the issue of mining probability distributions from historic service execution data as a
prerequisite of more realistic simulation. In this context, QoS attributes besides response
time will also be explicitly addressed.
Acknowledgements
This work has partly been sponsored by the E-Finance Lab e. V., Frankfurt am Main,
Germany (http://www.efinancelab.de).
References
1.
Krafzig, D., Banke, K., Slama, D.: Enterprise SOA: Service-Oriented Architecture Best
Practices. Prentice Hall PTR, Upper Saddle River, NJ, USA (2004)
2.
Papazoglou, M.P.: Web Services: Principles and Technology. Pearsor Education Limited,
Harlow, England (2008)
3.
Anselmi, J., Ardagna, D., Cremonesi, P.: A QoS-based Selection Approach of Autonomic
Grid Services. In: International Conference on Service-oriented Computing. (2007) 1–8
4.
Menasc
´
e, D.A., Casalicchio, E., Dubey, V.: A Heuristic Approach to optimal Service Selection
in Service-oriented Architectures. In: Workshop on Software and Performance. (2008) 13–24
5.
Mabrouk, N.B., Georgantas, N., Issarny, V.: A Semantic end-to-end QoS Model for Dynamic
Service-oriented Environments. In: Proceedings of the 2009 ICSE Workshop on Principles of
Engineering Service-oriented Systems. (2009) 34–41
6.
Huang, A.F.M., Lan, C.W., Yang, S.J.H.: An Optimal QoS-based Web Service Selection
Scheme. Information Sciences 179 (2009) 3309–3322
7.
Domschke, W., Drexl, A.: Einf
¨
uhrung in Operations Research. Springer Verlag, Heidelberg
(2007)
8.
Schuller, D., Eckert, J., Miede, A., Schulte, S., Steinmetz, R.: QoS-Aware Service Composition
for Complex Workflows. In: International Conference on Internet and Web Applications and
Services. (forthcoming 2010)
9.
van der Aalst, W.M., van Hee, K.M.: Workflow Management: Models, Methods, and Systems.
MIT Press (2002)
10.
Heckmann, O.: A System-oriented Approach to Efficiency and Quality of Service for Internet
Service Providers. PhD thesis, TU Darmstadt, Fachbereich Informatik (2004)
50

11.
Dawson, R.J., Dawson, C.W.: Practical Proposals for Managing Uncertainty and Risk in
Project Planning. International Journal of Project Management 16 (1998) 299–310
12.
Dawson, C.W., Dawson, R.J.: Generalised Activity-on-the-Node Networks for Managing
Uncertainty in Projects. International Journal of Project Management 13 (1995) 353–362
13.
Miller, R.W.: How to Plan and Control with PERT. Harvard Business Review 40 (1962)
93–104
14.
Schonberger, R.: Why Projects are ”always” late: a Rationale based on Manual Simulation of
a PERT/CPM Network. Interfaces (1981) 66–70
15.
Rosario, S., Benveniste, A., Haar, S., Jard, C.: Probabilistic QoS and Soft Contracts for
Transaction-Based Web Services Orchestrations. Transactions on Services Computing 1
(2008) 187–200
51
