
CLASSIFICATION AND CLUSTERING OF BRAIN INJURIES
FROM MOTION DATA OF PATIENTS IN A VIRTUAL REALITY
ENVIRONMENT
Uri Feintuch
School of Occupational Therapy, Hadassah- Hebrew University Medical Center, Jerusalem, Israel
Caesarea Rothschild Institute for Interdisciplinary Applications of Computer Science, University of Haifa, Haifa, Israel
Larry Manevitz, Natan Silnitsky
Computer Science Department, Unversity of Haifa, Haifa, Israel
Caesarea Rothschild Institute for Interdisciplinary Applications of Computer Science, University of Haifa, Haifa, Israel
Keywords: Neglect, CVA, TBI, Classification, Clustering, Neural Networks, VR.
Abstract: Virtual Reality (VR) has been found to be an effective rehabilitation tool for brain injury patients. We show
that motion data from these VR sessions can be effectively used to both cluster and classify patients
according to types of injury. Neural Network and other tools were used to differentially classify patients
with traumatic brain injury, cerebral vascular accident (stroke) with and without spatial neglect and healthy
individuals solely from the motion data. Clustering techniques also successfully duplicated the classification
division. These results have potential implications for scientific research, automated diagnosis and
integrated individually adaptive therapies in the virtual reality technology.
1 INTRODUCTION
1.1 Background
Recent advances in computer science and
engineering have allowed scientists and clinicians to
introduce virtual reality (VR) technology to various
medical fields in general, and to rehabilitation in
particular. Virtual reality applications let patients
function in simulated environments where they are
safe on one side, but practice real-world functions on
the other side (see review at Weiss et al., 2006) . For
example, a stroke patient may practice virtual street
crossing in the clinic before trying to cross a street in
the physical world (Kats et al., 2005). Beyond the
ecological validity offered by virtual environments,
they are also carefully controlled so they can be
standardized, and the behavior of the patients is
monitored and recorded. The collected data can be
analyzed and used for clinical diagnosis or progress
evaluation as well as general scientific research.
However, as virtual reality platforms produce very
large amounts of data, many researchers end up
reducing the analysis to simple outcome measures
such as reaction time, accuracy level etc.
We propose that such patient data are prime
candidates for analysis using machine learning tools.
This study aims to explore how various approaches
may be used for analysis of patient data under
constraints posed by the clinical conditions. For our
proof of concept we focused at brain injuries, and in
particular at the population of CerebroVascular
Accident (Stroke) patients.
A stroke is a lesion of the brain resulting from a
disturbance in the blood supply to the brain, due to
obstruction or rupture of a blood vessel. Stroke
causes a neurological deficit which may lead to
various types of disabilities such as cognitive,
emotional and motor impairments. In some cases
stroke leads to spatial neglect. Patients with neglect
are impaired in directing attention to selective part
of space, usually the half of space that is opposite
the injured hemisphere, and are unaware of their
deficit (Robertson and Halligan, 1999). Neglect is
commonly assessed using paper-and-pencil tests.
However, these tests have several substantial
drawbacks that often lead to a misdiagnosis of less
246
Feintuch U., Manevitz L. and Silnitsky N..
CLASSIFICATION AND CLUSTERING OF BRAIN INJURIES FROM MOTION DATA OF PATIENTS IN A VIRTUAL REALITY ENVIRONMENT.
DOI: 10.5220/0003057302460252
In Proceedings of the International Conference on Fuzzy Computation and 2nd International Conference on Neural Computation (ICNC-2010), pages
246-252
ISBN: 978-989-8425-32-4
Copyright
c
2010 SCITEPRESS (Science and Technology Publications, Lda.)
severe cases. For example, a stroke patient who had
passed the traditional tests and even got back his
driver license, yet experienced multiple car accidents
which occurred due to lack of attention and
awareness to the neglected visual hemifield
(Deouell, Sacher and Soroker, 2005). Other studies
have also shown the weakness of conventional tests
in neglect, and the potential of using virtual reality
technology for accurate assessment of this
neurological condition (Dvorkin et al., 2008).
Several types of VR methods are used for the
investigation and treatment of stroke. The main one
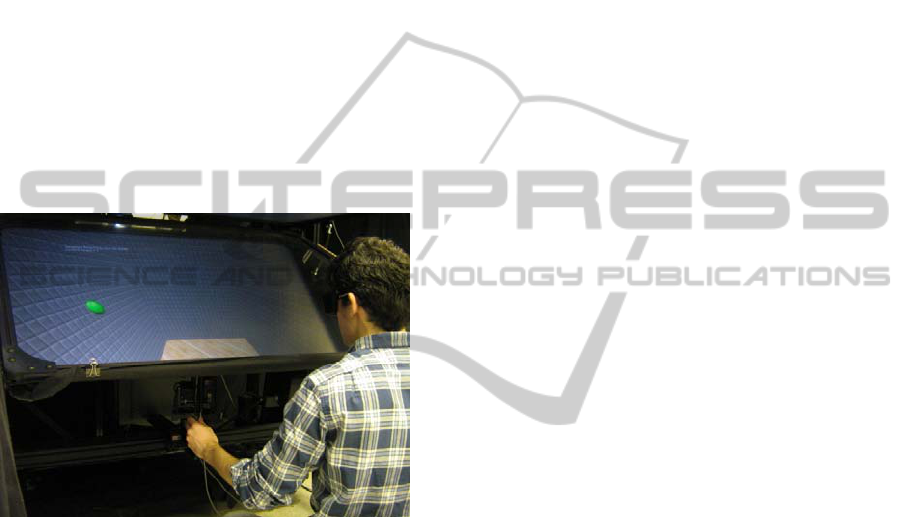
we used for this study implements a 3D
environment, where the patient has to reach and
"touch" a virtual ball appearing at various spatial
locations (see Figure 1). Each reaching trial
produces a data vector which includes the x,y,z
coordinates and orientations (6 degrees of freedom)
of the moving hand at 60 Hz sampling rate.
Figure 1: The VRROOM 3D platform.
Beyond the 3D experiment we also used machine
learning tools in order to analyze data gathered by a
2D VR system, where subjects perform virtual
shopping. In this additional experiment we
implemented learning tools in a more challenging
virtual environment. In this VR application the data
is only two-dimensional and also is very noisy.
Finally, in this experiment we included traumatic
brain injury (TBI) participants, which constitute
another common patient population.
In analyzing the data produced by these VR
platforms, we had to overcome several hurdles. First
and foremost, the sample size in these studies is
quite small for technical and clinical reasons. More
ever, as the participants get tired with time, the
length of each experimental session is rather limited.
Thus we had to find ways to process noisy and
scarce data. These issues will be addressed later on.
As even simple human motor performance is quite
challenging for meaningful analysis, we approached
this challenge using two levels of classifications as
each one may yield a solution for a different
problem.
Two-class classification: This approach may be
quite valuable when it comes to differential
diagnosis (DD). Several types of brain lesions may
produce very similar performance, not always easily
clear even to a professional eye. Thus it would be of
clinical benefit to detect which of the suspected
conditions the patient suffers from. After training on
some clear cut cases, a neural network may
generalize and classify the more questionable cases.
Zero-class classification (clustering): Clustering
techniques lend themselves for analysis of
heterogeneous populations, like stroke patients.
Since no two stroke patients are identical, clustering
them into subclasses leads to better classification
than the coarse ones used today, i.e., mild, severe,
and so forth.
1.2 Contribution of Study
We believe that finding the appropriate way to
harness machine learning to analysis of human
behavior has a significant potential to better
understanding of brain injuries. These injuries
manifest themselves in such a wide spectrum, so
patients may suffer from inaccurate evaluation of
their condition. Also, better analysis of movement
patterns may greatly assist neuroscientists in their
pursuit of better understanding of brain mechanisms
such as perception, attention, motor planning and
control.
In the following sections we shall demonstrate the
feasibility of these approaches suggesting the
relevance of machine learning tools.
2 METHODS
2.1 3D Experiment
Population: 29 volunteers participated in this study.
Ten of them were diagnosed as suffering from stroke
without clinical signs for neglect, nine suffered
stroke and showed signs for neglect. The other ten
were healthy adults in similar ages. The patients
were diagnosed as having different levels of severity
of their medical condition, ranging from mild to
severe.
Procedure: Participants were positioned in front of
the VRROOM (Virtual Reality and Robotics Optical
CLASSIFICATION AND CLUSTERING OF BRAIN INJURIES FROM MOTION DATA OF PATIENTS IN A
VIRTUAL REALITY ENVIRONMENT
247
Operations Machine) system, shown in Figure 1
(Patton et al., 2006). On each trial a virtual target
appeared randomly in space in one of 49 possible
positions. Participants were instructed to reach
toward the target as soon as they detected a target
appearing within the scene, using their unimpaired
arm. Each subject was presented with 343 target
stimuli altogether.
Analysis: The data vectors were first preprocessed
in order to eliminate pre-mature movement
initiations or omissions (i.e., when the subject did
not respond within three seconds). Also, any hand
movement prior to the stimulus appearance was
ignored as it is not part of the experiment.
The input vectors were of several types:
Long Vectors - including the data from the
onset of the target stimulus in the virtual
environment till the end of the hand
movement.
Movement Vectors – consisting of data from
the response of the subject, i.e., only from the
moment the subject started a physical
response.
Initial/final Vectors – These vectors included
the initial/final 130 data points of the
movement. As oppose to the former types,
these vectors were of fixed lengths.
Cross-validation: Two subjects of each group were
removed during the training session. They were used
for testing of the generalization. This was repeated
18 times and percent of successful classifications
was calculated.
2.2 2D Experiment
Population: 99 volunteers participated in this study.
54 were healthy adults, 11 adults who suffered from
CVA (without neglect), 9 children suffering from
TBI and 25 healthy children.
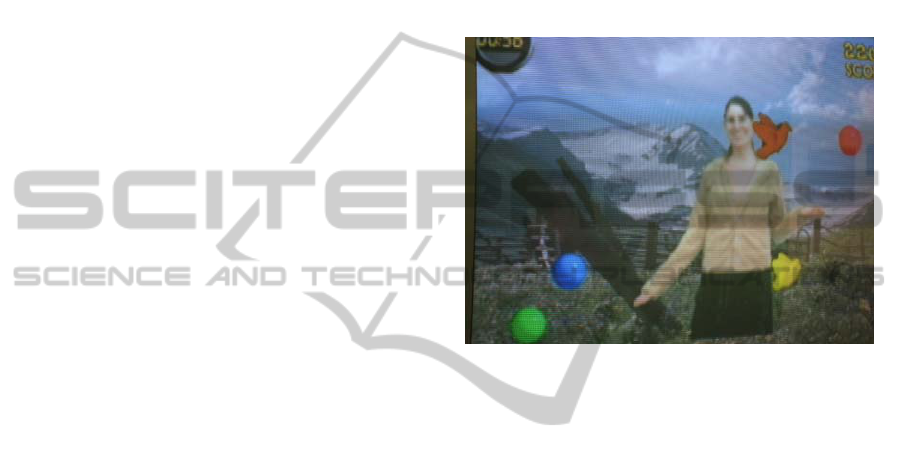
Procedure: A virtual supermarket was presented to
the participants using the GestureXtreme platform
(www.GestureTek.com). This system is based
on video motion capture technology where user is
captured by video camera and sees his image in
immersive 2D VR environment on the screen
(Figure 2). Motion tracking algorithm produces two-
dimensional coordinates of the user's movements.
The participants were instructed to touch certain
virtual products according to a shopping list (Rand
et al., 2004).
Analysis: The data vectors were first preprocessed
in order to find least noisy segments where the
movements of the hand are consistent over a period
of several seconds. At a rate of 15 frames per
seconds, a typical segment consisted of several
coherent chunks of 7-10 second durations. Thus
each participant produced eventually about 750 data
points (x,y,t) of his hand.
The noisy and fragmented nature of the data
prevented us from creating input vector of whole
movements or even long segments. Thus the input
vectors were short and of fixed length of five data
points. The cross-validation was similar to that used
in the 3D experiment.
Figure 2: A sample view of a subject within a
GestureXtreme virtual environment.
2.3 Architecture and Training
2.3.1 Two-Class
2D Experiment: For this experiment we used a feed
forward network architecture with one hidden layer,
which received as input a 15 element vector – 5
consecutive hand movements vectors (x,y,t). The
hidden layer had 5 elements. All together an
architecture of 15-5-1. For the more difficult case
(TBI v. CVA) a network of the structure 15-20-10-1
(2 hidden layers) was applied.
3D Experiment: Here we used the same feed
forward network architecture with a different input
layer, 1400 elements for a long vector (1400-5-1),
1000 elements for a movement vector (1000-5-1),
130 elements for initial/final vectors (130-5-1).
In both experiments the training method was
Levenberg-Marquardt initially. Later we discovered
that the resilient back-propagation algorithm obtains
the same stable results only with a much faster
processing time.
As the difficulty increased the number of epochs
increased as well, from 50 to 300 epochs.
ICFC 2010 - International Conference on Fuzzy Computation
248

2.3.2 Zero-Class
For both of these experiments we used a Kohonen
Self Organizational Map (SOM) network. The
topology we have chosen was that of a line with 7
clusters. Training was 50 epochs.
3 RESULTS
3.1 Terminology
When describing the results in text and tables there
are four main populations whose subjects may be
referred to by a combination of letter and number:
Healthy participants are denoted as H. In the
2D experiment HA represent healthy adults
and HC represents healthy children.
Stroke (a.k.a. CVA) who were not diagnosed as
suffering from neglect are denoted as S.
Stroke patients who are also suffer from neglect
are denoted as N.
People with traumatic brain injury (TBI) are
denoted as T.
3.2 Two-Class
3.2.1 3D Experiment
As seen in Table 1 the success rates in classification
of long vectors were above chance level. The neural
network was successful in generalizing in 82-97% of
the time. It is not surprising to see that the best rate
was achieved for the Healthy/Neglect classification,
for neglect is a condition which tends to be explicitly
manifested. From a clinical point of view the
distinction between neglect and CVA is (82%) is
certainly more meaningful, since traditional
assessments often lead to a misdiagnosis of less
severe cases of neglect.
As explained earlier, long vectors include all
data from the onset of the target stimulus till the end
of the hand movement. This includes the target
detection as well as both movement planning and
execution. Thus the distinction between different
populations may be the result of a cognitive
perceptual component, (i.e., reflecting the target
detection latency of response phases), or a motor
component. Such evidence has of course a scientific
merit but it does not require a neural network to
measure response time.
While there is ample evidence for a perceptual
deficit associated with neglect, motor control studies
have produced a large amount of contradictory data.
Hence we also attempted to perform a 2-class
classification using movement vectors. In this case
the input included only data from moment initiation
till the end of the movement.
Furthermore, as neglect, almost by definition,
manifests itself in one half of the visual field, we
chose to use only the relevant hemi-field in the input
data.
The classification results resemble very much
the ones produced with the long vectors, ranging
from 81% to 100%. This implies that the distinction
between the populations manifests itself in more
complicated ways than reaction time.
In order to further investigate the differences
between these populations, we used another length
of input. This was done by preparing a vector
consisting of either the initial or the final movement
segment (length of 130 data points). This approach
may assist in focusing the research to the critical
point of the hand trajectory, where the difference
may lie.
Table 1: Success rates of 2-class classification in 3D data.
Vector size Populations
BP NN
Average
Success
Long Healthy/CVA 86%
Long Healthy/Neglect 97%
Long Neglect/CVA 82%
Movement Healthy/CVA 83%
Movement Healthy/Neglect 100%
Movement Neglect/CVA 81%
Initial segment Healthy/CVA 69%
Initial segment Healthy/Neglect 81%
Initial segment Neglect/CVA 89%
Final segment Healthy/CVA 83%
Final segment Healthy/Neglect 89%
Final segment Neglect/CVA 69%
The classification results are not all that decisive
in general, ranging from 69% to 89%. However,
when comparing the success level of the
classifications, it seems that it was easier for the NN
to classify healthy from CVA or from neglect in the
final segment, compared to the initial segment (83%
vs. 69% and 89% vs. 81% respectively). On the
other hand, the more challenging classification, the
one between CVA and neglect patients seems to be
more distinct in the initial segment (89%) rather than
the final segment (69%).
It should be noted that the key findings of this
analysis were also reproduced using SVM.
CLASSIFICATION AND CLUSTERING OF BRAIN INJURIES FROM MOTION DATA OF PATIENTS IN A
VIRTUAL REALITY ENVIRONMENT
249

3.2.2 2D Experiment
Compared to the previous VR system, this platform
produced very noisy data, thus the preprocessing
reduced the inputs to short vectors each one
covering about 750 data points.
The results, appearing in Table 2, indicate that
the NN had high success (90%-100%) rates in
comparing the three populations who participated in
this experiment, namely healthy, CVA and traumatic
brain injury. It is interesting to mention that in the
CVA group there was a patient who was consistently
misclassified as healthy even when his data was the
training phase. Reviewing closely his medical files
revealed that this particular patient indeed suffered
from CVA but he had only cognitive impairments
but no physical disability. This anecdote, beyond
demonstrating the clinical potential of the system,
suggests that the NN classified according to
movement features of the subjects' behavior rather
than by cognitive or attributes.
Table 2: Success rates of 2-class classification in 2D data.
Vector size Populations
BP NN
Average Success
5 data points Healthy/CVA 90%
5 data points Healthy/TBI 100%
5 data points TBI/CVA 97%
5 data points
Healthy Adults/ Healthy
Children
50%
Since the TBI patients were all much younger
than the CVA patients, we suspected that perhaps it
is the age difference that accounts for the
classification between these populations, rather than
the clinical condition. Hence we tried to classify the
healthy children from the healthy adults. As seen in
Table 2, the classification failed (50%), so it appears
that age did not play a role in the CVA/TBI
classification.
3.3 Zero-class
3.3.1 3D Experiment
Stroke causes a wide array of damages leading to
many types of medical conditions. Some of these
sub-categories have received a distinctive title, such
as neglect. Yet the definitions are rather broad, and
the cut-off points are not so accurate. In this phase of
the study we picked various subsets of the patients
and divided them into groups using clustering tools.
Following this, the patients' medical records were
examined in order to test the clinical validity of
these clusters, and whether they point to meaningful
directions. We chose various population types, and
employed the Kohonen algorithm to cluster them to
2, 3 or 7 clusters. The main results appear in Table
3.
First we were interested in finding out how
homogenous our healthy control group is by itself.
Most of the healthy subjects were clustered into two
neighboring clusters. One subject however, referred
to as H10, was clustered all by his own, for unclear
reasons.
The CVA population by itself appeared to be
Table 3: Clusters produced for 3D data.
Vector size,
Populations,
(Num. of clusters
allowed)
Kohonen
Clusters
Movement,
Healthy, (7)
3: H01,H02,H04,H06,H08
4: H03,H05,H07,H09
6: H10
Movement,
CVA, (3)
S01-S10
Movement,
Neglect, (2)
1: N03,N04,N06,N07,N9
2: N01,N02,N05,N08
Movement,
Healthy/CVA, (2)
1: H01-H09,S04,S08
2: S01,S10,S02,S03,S05,S06,S07,S09
Movement,
Healthy/Neglect, (3)
1: N03,N04,N06,N07,N09
2: N01,N02,N05,N08
3: H01-H09
Movement,
Neglect/CVA, (2)
1: N01,N02,N03,N04,N06,N07,N09
2: S01-S10,N05,N08
Movement,
All, (3)
1: N03,N04,N06,N07,N09
2: H05,H09,N01,N02,N05,N08,S01-
S10
3: H01,H02,H03,H04,H06,H07,H08
Initial segment,
Healthy/CVA, (2)
1: H01,H02,H05,H07,H08,
H09,S01,S06,S08,S09
2: H03,H04,H06,S02,
S03,S04,S05,S07,S10
Initial segment,
Healthy/Neglect, (2)
1: H01-H09,N01,N02,N04,N05,N08
2: N03,N06,N07,N09
Initial segment,
Neglect/CVA, (2)
1: N03,N06,N07,N09
2: S01-S10,N01,N02,N04,N05,N08
Initial segment,
All, (2)
1: H01-H09,N01,N02,
N04,N05,N08,S01-S10
2:,N03,N06,N07,N09
Final segment,
Healthy/CVA, (2)
1: H01-H04,H06-H09,S01,S02,S04-
S10
2: H05,S03
Final segment,
Healthy/Neglect, (2)
1: H01-
H09,N01,N02,N04,N05,N06,N08
2: N03,N07,N09
Final segment,
Neglect/CVA, (2)
1: N03,N07,N09
2: S01-
S10,N01,N02,N04,N05,N06,N08
Final segment,
All ,(2)
1: H01-H09,N02,N05,N08,S01-S10
2: N01,N03,N04,N06,N07,N09
ICFC 2010 - International Conference on Fuzzy Computation
250

quite homogenous, and was assigned into a single
cluster. The neglect patients, however, were
assigned into two clusters. Reviewing their medical
records revealed that all the patients in cluster #2
were diagnosed with only mild neglect.
When comparing pairs of populations, some
interesting clusters have emerged. When healthy and
CVA subjects were pooled together, all the healthy
subjects were clustered together with two stroke
patients who were closer to them than to the other
stroke patients. This suggests that the border
between healthy and stroke is not always clear cut.
The healthy and neglect populations, produced three
clusters, where the healthy were separate, and the
neglect clustered again into two groups, severe and
mild.
When pooling together the two patient
populations, CVA and neglect, two of the mild
neglect patients, N5 and N8, performed well enough
to be "upgraded" to the CVA cluster. A similar trend
was observed when we clustered all the subjects, as
the severe neglect patients were in one cluster, some
of the healthy were in another, and a middle cluster
included all the CVA, the mild neglect and even two
healthy subjects.
As before, we also focused at the initial and final
Table 4: Clusters produced for 2D data.
Vector Size,
Populations, (Num. of
clusters allowed)
Kohonen Clusters
5 data points,
Healthy/CVA, (7)
4: HA31-HA63,S10
5: HA4-HA10
6: S2,S3,S6,S8,S9
7: S1,S4,S5,S7
5 data points, Healthy
Children/ TBI children,
(7)
1: T9,HC12
2: T8,HC1-HC5,HC7,HC9,
HC10,HC14-HC21
3: T2,T5,T6,T7,HC6,HC8,HC11,HC13
4: T1,T3,T4
7: HC3
5 data points, Healthy
Children/ Healthy
Adults, (7)
4: HA32,HA34,HA38,HA40,HA49,
HA53,HC6,HC8,HC11
5: HA1-AH20,HA23,HA31,
HA33,HA35,HA36,HA37,HA39,
HA41-HA52,HC1,HC2,HC4,HC5,
HC7,HC9,HC14,HC16-HC21
6:HA21,HA22,HC3,HC10,HC13,HC15
7: HC12
5 data points,
TBI/CVA, (7)
1: S4,S8
3: S6
4: S1,S2,S9,T1,T3,T4,T7
5: S3,S7,T2,T5,T6,T8
6: S5,S10,T9
5 data points, All, (7)
3: S1,S2,S4-S9,T1-T4,T6,HC3
4: S3, T5,T7-T9,HC12,HC13
5: HA/HC
6: HA/HC,S10
7: HC8
segments of the motion. The initial segment
essentially reproduced the pattern identified in the
analysis of the entire movement. The clustering of
the final segment produced a similar pattern,
although not so distinct. For example, when
clustering the CVA and healthy populations, one
CVA patient (S3) and one healthy participant (H5)
were joined together in one cluster, while everyone
else were assigned to a separate cluster.
The key findings were reproduced also when
employing k-means.
3.3.2 2D Experiment
Looking at Kohonen clustering for the 2D data (See
Table 4), the only clustering that adhered to the
medical condition was that of Healthy and CVA.
The two populations clustered into four clusters.
Aside from S10, who, as mentioned earlier, suffered
no motor disability, the healthy participants
occupied two separate clusters and so did the CVA
patients. No explicit reason was found in their
medical records, to account for this sub clustering.
The rest of the clustering trials yielded no
meaningful results.
4 DISCUSSION AND FUTURE
DIRECTIONS
4.1 Discussion
In this study we demonstrated how machine learning
tools may assist the clinician or scientist in
analyzing data collected by VR platforms. This can
be done even though these data are based on very
small samples and even when the data is extremely
noisy and partial. We proposed two approaches for
achieving meaningful results.
First, two-class classification may assist in
differential diagnosis. This was demonstrated as in
both experiments, different patient population was
diagnosed above average: CVA vs neglect and CVA
vs, TBI, respectively. In this study, being a proof of
concept, we picked medical conditions where we
could assess the patients also in conventional
methods. We believe that our approach will aid also
in more hard to distinguish conditions.
Furthermore, from the scientific aspect, running
such classifications can be done while using
different segments of the data as input. The results
may direct the researcher to the key components in
motion or behavior which are sensitive to the
classification. For example, the data here suggest
that perhaps the difference in reaching behavior
CLASSIFICATION AND CLUSTERING OF BRAIN INJURIES FROM MOTION DATA OF PATIENTS IN A
VIRTUAL REALITY ENVIRONMENT
251

between neglect patients and non neglect CVA
patients lies at the very beginning of the motion
where the classification between them is quite high
(89%). Such pointers may aid researchers in
hypothesizing models of brain functions and in
designing the experiments to validate them.
The zero-class approach suggested, especially in
the 3D study, how the rigid distinction between
various conditions may be misleading. It was shown
how sometimes neglect patients behave in a similar
way to non-neglect CVA patients or how certain
CVA patients belong in the same cluster. This
approach can point the rehabilitation professionals to
better understanding and organization of
heterogeneous or wide spectrum disorders.
4.2 Future Directions
One immediate goal is to apply one-class algorithms
on these data. One-class filters are those that are
trained and produced using only data from one-class,
yet it produces a classification on new data that says
the data point is in the class or not.
Building one class filters may assist the field of
rehabilitation science in one of its severe
shortcomings, which is the lack of large samples of
clinical populations. One can only imagine the
benefits of building one-class filters from different
VR platforms and applications. We propose that
upon finding relevant data segments we can
accumulate data from different settings. After
sufficient training of a set of one-class filters, one
can bring a novel data vector and test it on these
filters to see whether this patient tested positive for
the "mild neglect" or "severe neglect" or "mild
upper-left hemi-field but otherwise OK" etc. This
may focus the clinicians in treating only the
impaired faculties of the patients.
Preliminary results indicate that in our 3D data a
one-class filter achieved 97% success rate in
labeling "severe neglect". Thus this may be a
promising direction.
Another direction would be to test our approach
in current frontiers of neurological rehabilitation.
One example would be finding a way to easily
diagnose between spatial neglect and hemianopsia,
which is related to different brain mechanisms, but
leads to a behavior similar to that of neglect patients.
Similarly, it would be of significant value if
zero-class clustering may aid in separating the wide
spectrum of attention deficit disorders (ADD) into
meaningful sub-categories.
Finally, in our vision for the long range, we see
the possibility of "closing the loop" and using the
classification and clustering methodology as keys
for making rehabilitation protocols both adaptive
and individualized. This is especially tempting in the
context of rehabilitation in the virtual reality
environment. What is needed is the development of
a virtual model of the individual which we would
want to extract automatically from data based on his
performance in the VR sessions. Then an individual
rehabilitative protocol can be obtained by simulating
the behavior of an avatar in the VR; and simply
testing how the avatar improves under a large
variety of protocols. Once a good one is established,
it can be immediately applied to the patient who is
being treated in the same VR environment.
ACKNOWLEDGEMENTS
Thanks to Assaf Dvorkin, Jim Patton, Eugene
Mednikov, Debbie Rand, Rachel Kizony, Neta Erez,
Meir Shahar, Patrice L. Weiss and the Caesarea
Rothschild Institute. Authors are listed
alphabetically. This work appears as part of the
M.Sc. thesis of Natan Silnitsky.
REFERENCES
Deouell LY, Sacher Y, Soroker N. Assessment of spatial
attention after brain damage with a dynamic reaction
time test. J Intern Neuropsychol Society 2005; 11: 697-
707.
Dvorkin AY, Rymer WZ, Harvey RL, Bogey RA, Patton JL
(2008) Assessment and monitoring of recovery of
spatial neglect within a virtual environment. In: IEEE
Virtual Rehabilitation. p. 88-92, Vancouver, Canada.
Katz, N., Ring H., Naveh, Y., Kizony, R., Feintuch, U. and
Weiss, P.L. (2005). Interactive virtual environment
training for safe street crossing of right hemisphere
stroke patients with Unilateral Spatial Neglect.
Disability and Rehabilitation, 29(2), 177-181.
Patton, J. L., Dawe, G., Scharver, C., Mussa-Ivaldi, F.A.,
and Kenyon, R. (2006) Robotics and virtual reality: A
perfect marriage for motor control research and
rehabilitation. Assistive Technology 18: 181-195.
Rand, D., Katz, N., Shahar, M., Kizony, R., and Weiss, P.
L.: The virtual mall: development of a functional virtual
environment for stroke rehabilitation. Abstracts of the
55th Annual Conference of the Israeli Association of
Physical and Rehabilitation Medicine. Tel Aviv 2004.
Robertson, I. H. and Halligan, P. W. Spatial neglect: a
clinical handbook for diagnosis and treatment. Hove,
UK: Psychology Press, 1999.
Weiss, P.L., Kizony, R., Feintuch, U., & Katz, N. Virtual
reality in neurorehabilitation. In M.E. Selzer, S. Clarke,
L.G. Cohen, P. Duncan, & F. Gage (Eds.). Textbook of
Neural Repair and Rehabilitation - Medical
Rehabilitation. pp 182-197. Cambridge:
Cambridge University Press. Cambridge. 2006.
ICFC 2010 - International Conference on Fuzzy Computation
252
