
AN INNOVATIVE GA OPTIMIZED INVESTMENT STRATEGY
BASED ON A NEW TECHNICAL INDICATOR USING
MULTIPLE MAS
Adriano Simões, Rui Neves and Nuno Horta
Instituto das Telecomunicações, Instituto Superior Técnico, Av. Rovisco Pais 1, 1040-001 Lisboa, Portugal
Keywords: Optimization, Technical Analysis, Evolutionary Algorithms, Financial Analysis, Moving Average, Stocks.
Abstract: This paper proposes a new medium/long term investment strategy for stock markets based on a combination
of Simple Moving Averages Crossover (SMAC) and Moving Average Derivate (MAD). This strategy is
compared with the Buy and Hold, with the Moving Averages Crossover, and with the Moving Average
Derivate strategy. The experiments show that the combination of SMAC and MAD outperforms the results
of each strategy individually. The presented approach has an average return of investment of 9.0%,
compared with the 2.6% return of the Buy and Hold, for the S&P500, FTSE100, DAX30 and NIKKEI225,
between 2004 and 2009.
1 INTRODUCTION
The study of profitable trading rules in the stock
market constitutes a widely known problematic in
financial markets, although the existence of those
rules still generate great controversy for many
economists and academics (Fama, 1998). On the
other hand, investor, traders, and other stakeholders
of financial and investment firms, with large
experience in the stock market, claim that it is
possible to have excessive returns (compared with
the Buy and Hold) using algorithmic trading
(Bodas-Sagi, 2009) (Chan, 2009).
One investment technique commonly used is
Technical Analysis, which forecasts the price of
stocks based only on the price of the stock and the
volume traded in the past. Momentum strategies
based on the continuation in the evolution of a stock
price on their recent history (Jegadeesh & Titman,
1993), have proved to be consistently more
profitable than the indexes where those stocks were
included. The foundation of Technical Analysis is
the Dow Theory, written by Charles Dow, founder
of Wall Street Journal where the main ideas of the
Dow Theory where published (Kaufman, 2005)
(Kirkpatrick, 2009).
Genetic Algorithms are optimization techniques
based on the principles of natural evolution. This
paper presents a genetic algorithm for optimizing
Technical Indicators parameters in order to
maximize returns. Other GAs have been previously
used to optimize technical indicators parameters, in
particular (Fernández-Blanco, 2008) and to develop
investment strategies based on technical indicators
(Bodas-Sagi, 2009) (Gorgulho & Neves & Horta,
2009) (Yan & Clack, 2007).
The next section will discuss the related work on the
Genetic Algorithms and various trading strategies
currently used in Technical Analyses. Section 3
explains the system architecture and the investment
strategies used in this paper, the markets and years
used to test those strategies. Also in this section the
overall description of the GA is shown, and the
fitness, selection, crossover and mutation functions
used. In section 4 the results are presented and a
highlight of the most relevant results is made. In
section 5 the conclusions of this study are shown.
2 RELATED WORK
One of the most used and oldest strategies to
identify trends is the crossing of Moving Averages.
This strategy has been studied by Brock (1992) and
by Kaufman (2005). This studies concluded that
from 1910 to 2000 the Crossing of the Moving
Average perform better than the Buy and Hold
strategy, except for the period from 1980 to 2000
306
Simoes A., Neves R. and Horta N..
AN INNOVATIVE GA OPTIMIZED INVESTMENT STRATEGY BASED ON A NEW TECHNICAL INDICATOR USING MULTIPLE MAS.
DOI: 10.5220/0003058103060310
In Proceedings of the International Conference on Evolutionary Computation (ICEC-2010), pages 306-310
ISBN: 978-989-8425-31-7
Copyright
c
2010 SCITEPRESS (Science and Technology Publications, Lda.)

where the market exhibited a regular uptrend, and no
excess profits where possible as reported by Ellis &
Parbery (2005). More complete studies of other
Technical Indicators has been made, like the one by
Canegrati (2008) who studies the profitability of 76
Technical Indicators with robust results for some
indicators.
Many papers have been recently published on the
use of GAs to optimize technical indicators like
Fernández-Blanco (2008), which use GAs to
optimize the parameter of a single Technical
Indicator, the MACD (Moving Average
Convergence-Divergence) with 3 parameters, and an
extra parameter for the history window size. Another
solution based also on optimizing Technical
Indicators parameters is the one used by Bodas-Sagi
(2009), where the chromosome is composed by the
MACD, RSI and history window size, also a
comparison between single and multi-objective is
made. Besides GAs others optimization techniques
have been applied to this area of study, like neural
networks by Kimoto & Asakawa (1990), where the
neural network uses for the inputs the price, volume,
interest rate and foreign exchange rate.
This study concentrates in the optimization of
technical trading rules which has not been yet tested
with GAs, like the SMAC and MAD strategies, and
also, combines these two strategies in one
chromosome trying to achieve better and solid
returns than with the solo strategies.
3 METHODOLOGY
The proposed system consists on a Genetic
Algorithm coupled with a market return evaluation
module based on the return of the strategies in
different markets in specific time-frames.
3.1 System Architecture
Figure 1: System Overall Architecture.
The complete process can be summarized as:
The user starts by specifying the markets to analyze
and next chooses the Technical Indicators used in
the strategy and the train and test period.
Afterwards, the Genetic Algorithm Kernel runs
several number of times, optimizing the parameters
of the strategy for the markets and training period
chosen. Finally for each run of the GA, its return on
the test period is calculated. Detail info is shown to
the user displaying the optimized strategy and the
return for each market in the test and in the training
period.
3.1.1 Modules Description
This section presents the overall description of each
module and their main responsibilities.
The “Technical Indicators” module is responsible
for the creation and management of the technical
indicators used by all the strategies. The “Train and
Testing Periods” module controls the time
components of the Stock Indexes. The “Stock
Market Indexes” is responsible for loading the stock
market indexes from the source (a .csv file).The
“Market Return Evaluation” module calculates the
return and other metrics for evaluating the
investment strategy (like the Sharpe Ratio). The
Genetic Algorithm Module is the most important
because it is the one who does the core functions of
the system. This module uses data from all the other
modules to calculate the perfect strategy with the
Technical Indicators. Finally the Optimized Strategy
module is responsible for showing the user the result
of the optimization.
3.2 Train and Test Data set
The time period chosen for training was from 1
January 1993 to 31 December 2003, eleven years of
daily data and the testing period was from 1 January
2004 to 31 December 2009. The markets tested
where the S&P500 (USA), FTSE100 (England),
DAX30 (Germany) and NIKKEI225 (Japan). They
represent the main indexes of the main developed
economies.
3.3 Technical Indicators
The first strategy to be tested was the Simple
Moving Average Crossover (SMAC) which is
composed by two Moving Averages (MA) with
different time periods. One of the MA is a long term
MA, and the other is a short term MA. A buying
signal is generated whenever the short term MA
crosses over the long term MA, and a sell signal is
AN INNOVATIVE GA OPTIMIZED INVESTMENT STRATEGY BASED ON A NEW TECHNICAL INDICATOR
USING MULTIPLE MAS
307

generated whenever the short term MA crosses
under the long term MA.
Another indicator that will be used in this paper is
the Moving Average Derivate (MAD). It is an
extended version of the “MA Change” described by
Kaufman (2005). In the original version it is
calculated by subtracting de value of the current MA
with the value of the MA in the previous day.
In mathematics this is simply the secant to the MA
curve in the last two days. In this way this generic
Derivate of the MA can be calculated based on the
definition of Secant of the MA, this way the MAD is
calculated by subtracting de value of the current MA
with the value of the MA at “n” days ago. Where
“n” is one of the variables that will be optimized.
The buying signal is given when the MAD is above
zero and a selling otherwise.
Beside this two indicators a new indicator is created,
called SMAC & MAD that includes the two
indicators mentioned above (SMAC and MAD) that
signals a buy when both the indicators are buying,
does nothing when one of the indicators is out of the
market and issues a short-sell signal when both
indicators advise to short-sell.
3.3.1 Parameters of Technical Indicators
After defining the strategies it is necessary to define
the parameters to use both in the SMAC and in the
MAD strategies. Both strategies have two
parameters, with similar meanings. The first
parameter is similar to both strategies, the time
period of the long term MA. The second parameter
in one strategy is the time period of a short term MA
and in the other strategy is the distance between the
two points used to calculate the secant. In both
parameters they should indicate medium term
periods. The new Indicator (SMAC & MAD) has
four parameters, two for the SMAC and two for the
MAD. These parameters represent the parameter of
the underlying strategies.
3.4 Genetic Algorithm Kernel
3.4.1 Genetic Encoding
The chromosome created must represent the
Technical Indicators used, in this way the SMAC
chromosome is represented by two genes, one for
the shortest MA other for the longest MA in days
(natural numbers), the interval of this values is
between 1 and 250 (this value is above the largely
used MA for long term analysis: 200 days). The
same rule applies to the MAD chromosome, where
one of the parameters is the “gap” and the other the
number of days of the MA. In Table 1 it is shown a
representation of a possible chromosome for the
SMAC & MAD chromosome (which includes both
the SMAC and MAD genes):
Table 1: An example of a Chromosome.
SMAC MAD
Chromosome 25 160 40 100
3.4.2 Features of the GA
The Genetic Algorithm used for the optimization
uses a standard optimization procedure. The
selection of individuals for crossover is chosen
based on a roulette wheel selection (but only the best
half of the population enters the selection process),
and the probability of being chosen is equal to the
ratio: individual fitness function / Sum of fitness of
all individuals. Each individual can be chosen any
number of times for crossover (the only exception is
that an individual cannot be chosen to crossover
with himself).
The crossover is a one-point crossover, each
breading generates the two possible distinct children
and includes them in the population. In the
chromosome of only one indicator (SMAC or MAD)
the children are created by swapping the long and
shortest MA day. In the SMAC & MAD
chromosome the children are created by swapping
the 2 genes that represent each Indicator (the first
children takes the SMAC genes from parent A, and
MAD genes from parent B, and the second children
the other way around).
The fitness function used is the average return of the
individual for the 4 Stocks Indexes chosen, during
the 11 years of the train data (1993 to 2003).
4 RESULTS
The optimization procedure described above was run
fifty times for each approach namely, MAD, SMAC
and SMAC & MAD, additionally 50 random
strategies were evaluated. The random strategy
consists in each day deciding a random trade: long,
short-sell or do nothing, each with one third chance
of occur. In each run the best individual obtained
was evaluated for the test period (2004 to 2009) for
the yearly return of the average of the 4 Indexes.
In Figure 2 it is shown the histogram for the returns
of the 50 runs although the percentage go only to
ICEC 2010 - International Conference on Evolutionary Computation
308
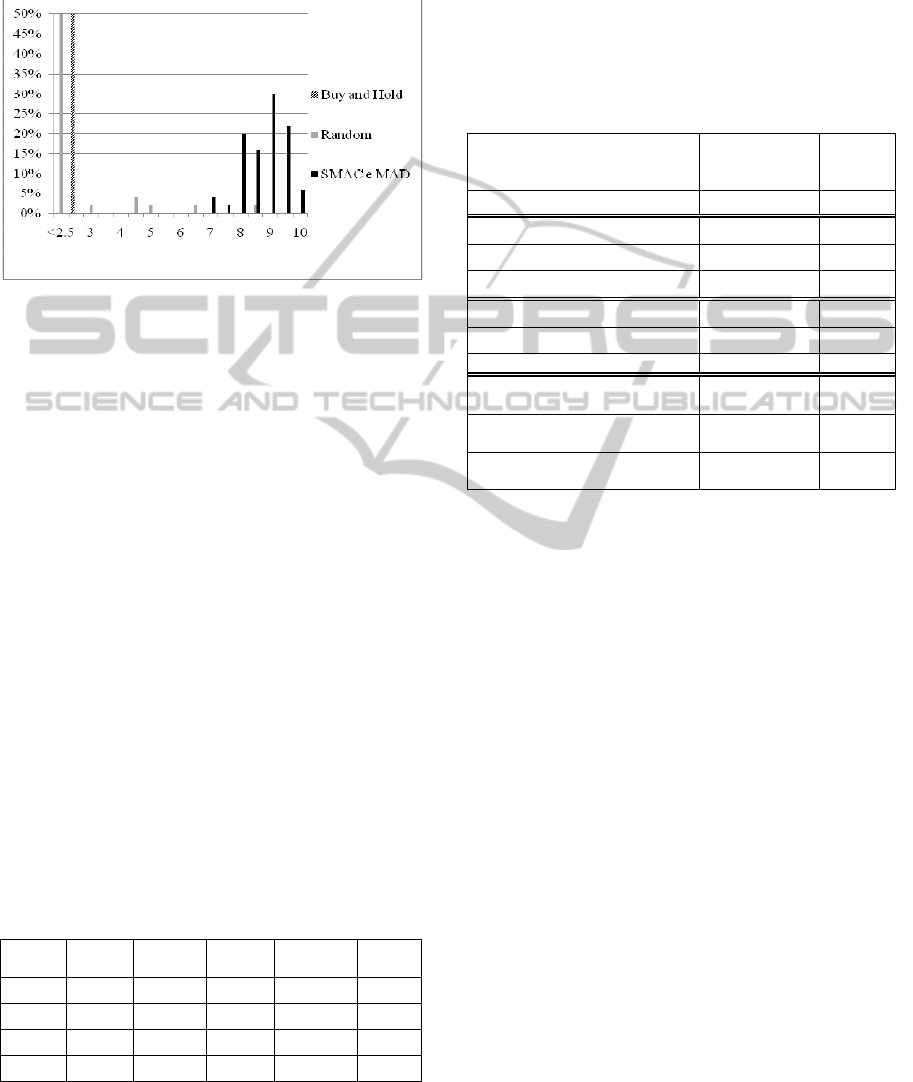
50% for better perception of the other values, the
Buy & Hold is 100% on the 2.5 column, and the
random strategy has 88% in the less than 2.5
column.
Figure 2: Histogram of returns of the Buy & Hold,
Random SMAC& MAD, and SMAC & MAD, from 2004
to 2009.
As we can see in this figure, all the chromosomes
beat the Buy and Hold and the random strategy, this
confirms the validity of the Technical Indicators
proposed.
The SMAC & MAD Compost Chromosome is very
similar with a Gaussian curve, which proves that this
strategy has the most solid results. The detailed
statistics can be seen in Table 2.
In this table it is possible to see that the Buy & Hold
and the Random Strategy have the lowest Worst,
Median, Average and Best Values. And that the
“SMAC & MAD” have Average, Median, and
Worst value beating all the other strategies (and the
Best value is not far away from the first). This
means that using the optimized “SMAC &
MAD”, not only the expected profit is better, but the
possibility of a “bad return” happen during the
test period has a low probability of occur, and even
if it occurs the return will not be too low (the worst
return of the SMAC & MAD in 50 runs in the test
period is 7.3%).
Table 2: Statistics of the returns in the test period for the
different strategies.
Buy &
Hold
SMAC MAD
Random
Strategy
SMAC &
MAD
Best:
2.6% 10.1% 10.5% 8.58% 10.2%
Average:
2.6% 8.5% 8.7% -1.01% 9.0%
Median:
2.6% 8.9% 8.0% -1.11% 9.2%
Worst:
2.6% 6.3% 6.8% -7.33% 7.3%
4.1 Return on Investment
In the next table we can see the yearly average return
in the test period of the three best chromosomes
found in the training period, with the respective
number of trades, contrary to the return (which is
annualized), during all the testing period (6 years).
Table 3: Yearly average return and Total Number of
Trades of the various strategies tested from 2004 to 2009.
Average
Return
Average
Sharpe
Ratio
Buy & Hold
2.55% 0.030
SMAC (227, 210)
8.34% 0.570
SMAC (225, 210)
8.27% 0.531
SMAC (222, 210)
7.73% 0.352
MAD (110, 11)
8.15% 0.365
MAD (112, 10)
8.01% 0.349
MAD (112, 11) 7.52% 0.314
MAD(186, 45) & SMAC(202,
193)
9.37% 0.522
MAD (108, 20) & SMAC(206,
195)
8.38% 0.466
MAD(112, 11) & SMAC(242,
128)
8.27% 0.458
In this table we can see that the “MAD & SMAC”
strategy have the best, the second and fourth best
results. This means that this is the most optimal and
robust strategy, because it’s the one who maintains
the best results from the training period to the testing
period.
4.2 Sharpe Ratio
The Sharpe Ratio is a measure that was created by
Nobel Prize William Sharpe, to measure the reward-
to-variability ratio of a trading strategy (Sharpe,
1994). This measure allow to compare two strategies
with different returns, and see if the additional return
of one strategy is due to applying a more risky
strategy, or to a smarter investment strategy.
In Table 3 we can see that the “MAD & SMAC”
strategy has worse Sharpe Ratio results that the
SMAC strategy (the SMAC has the best and second
best result, while the “MAD & SMAC” has the third
and fourth and fifth best Sharpe Ratio. The values of
the “MAD & SMAC” are more stable with small
differences between the best and the worst. This
means that the returns showed in Table 3 are due to
the “MAD & SMAC strategy” being a bit more
riskier (with more variance in the yearly returns)
than the SMAC strategy. This means that the
deciding factor on the choice of these two strategies
AN INNOVATIVE GA OPTIMIZED INVESTMENT STRATEGY BASED ON A NEW TECHNICAL INDICATOR
USING MULTIPLE MAS
309

is the investor profile risk. The investor can choose
between a strategy with better returns but more
volatility (the “SMAC & MAD”) and the SMAC
with more regular but less attractive results.
Figure 3: Evolution of the return of the Buy and Hold, and
the “MAD (108, 20) & SMAC(206, 195)” strategy, on
S&P500 from 2004 to 2009.
In Figure 3 we can see the evolution of the return of
the strategy with the best results in the training
period, during the test period, compared with the
evolution of the Buy and Hold.
The proposed strategy is best suited for medium and
long term investment since it only takes a decision
after the confirmation of a trend is clear, it has the
great advantage of avoiding long periods of
downtrends. The classical stategy of Buy and Hold
that is only good in markets that do not exibited bear
markets like the 80s and 90s in the S&P500 does not
perform well in markets characterized by long bear
markets.
5 CONCLUSIONS
This document presented the use of Genetic
Algorithms to optimize the parameters of various
Technical Indicators and with them create various
trading strategies. The results obtain showed that
this strategies beat significantly the Buy and Hold
(the “MAD & SMAC” strategy had an average of
9.0% against the 2.6% of the Buy and Hold), once
more proving the validity of Technical Analysis.
Finally the optimized “MAD & SMAC” strategy is
compared with the random strategy, with excellent
results: the optimized has an average of return of
9.0% against the -1.01% of the random strategy. The
use of the “MAD & SMAC” has also shown better
results than the use of any of the indicators
individually.
REFERENCES
Bodas-Sagi, et al. (2009). Multiobjective optimization of
technical market indicators. In Proceedings of the
GECCO '09, Montreal, Canada .
Brock, et al. (1992). Simple Technical Trading Rules and
the Stochastic Properties of Stock Returns. Journal of
Finance, American Finance Association, vol. 47(5) ,
1731-6.
Canegrati, E. (2008). A Non-Random Walk down Canary
Wharf. MPRA Paper, University Library of Munich .
Chan, E. P. (2009). Quantitative Trading. New Jersey:
John Wiley and Sons.
Ellis, Craig A. & Parbery, Simon, A. (2005). Is smarter
better? A comparison of adaptive, and simple moving
average trading strategies. Research in International
Business and Finance, Elsevier, vol. 19(3) , 399-411.
Fama, Eugene F. (1998). Market efficiency, long-
term returns, and behavioral finance. Journal of
Financial Economics, Elsevier, vol. 49(3) , 283-306.
Fernández-Blanco, P., et al. (2008). Technical market
indicators optimization using evolutionary algorithms.
Proceedings of the 2008 GECCO conference
companion on Genetic and evolutionary computation ,
1851-1857.
Gorgulho, A., Neves, R. and Horta N. (2009). Using GAs
to Balance Technical Indicators on StockPicking for
Financial Portfolio Composition. Proceedings of the
GECCO, 2009, Montreal, Canada. , 2041-2046.
Jegadeesh, N., and Titman, S. (1993). Returns to buying
winners and selling losers: Implica-tions for stock
market efficiency. Journal of Finance 48 , 65-91.
Kaufman, P. J. (2005). New Trading Systems And
Methods. San Francisco, CA: John Wiley & Sons Inc.
Kimoto, T. and Asakawa, K. (1990). Stock Market
Prediction System with Modular Neural Networks.
IJCNN International Joint Conference on Neural
Networks, vol. 1 , 1-6.
Kirkpatrick, C. D. and Dahlquist R. D. (2009). Technical
Analysis. FT press.
Sharpe, W. F,. (1994). The Sharpe Ratio. Journal of
Portfolio Management 21 (1) , 49–58.
Yan, W. and Clack, C. (2007). Evolving Robust GP
Solutions for Hedge Fund Stock Selection in
Emerging Markets. Proceedings of the GECCO 2007 ,
London, UK, 2234-224.
‐50%
0%
50%
100%
2004 2005 2006 2007 2008 2009
MA
…
ICEC 2010 - International Conference on Evolutionary Computation
310
