
MODELING SKIN BLOOD FLOW
A Neuro-physiological Approach
Boris R. M. Kingma, Wim H. Saris
Department of Human Biology, NUTRIM School for Nutrition, Toxicology and Metabolism of Maastricht Universitary
Medical Centre+, Universiteitssingel 50, Maastricht, The Netherlands
Arjan J. H. Frijns, Anton A. van Steenhoven
Department of Mechanical Engineering, Eindhoven University of Technology, Eindhoven, The Netherlands
Wouter D. van Marken Lichtenbelt
Department of Human Biology, NUTRIM School for Nutrition, Toxicology and Metabolism of Maastricht Universitary
Medical Centre Maastricht, The Netherlands
Keywords: Thermoregulation, Neural pathway simulation.
Abstract: In humans skin blood flow (SBF) plays a major role in body heat loss. Therefore the accuracy of models of
human thermoregulation depends for a great deal on their ability to predict skin blood flow. Most SBF-
models use body temperatures directly for calculation of skin perfusion. However, humans do not sense
temperature directly, yet the information is coded into neuron fire rates. The aim of this study was to
investigate whether SBF can be adequately modelled through simulation of temperature sensitive neurons
and neuro-physiological pathways of excitation and inhibition. Methods: In this study a mathematical model
for SBF was developed based on physiological knowledge on neural thermo-sensitivity and neural
pathways. The model was fitted on human experimental data. Mean squared residuals (MSR) were
estimated through k-fold cross-validation. Results: The model adequately explains the variance of the
measurements (r
2
=0.91). Furthermore the averaged MSR is close to the natural variation in the
measurements (AMSR=0.087 vs.
2
=0l.080) indicating a small bias. Conclusion: In this study we
developed a model for skin perfusion based on physiological evidence on thermo-reception and neural
pathways. Given the highly explained variance this study shows that a neuro-physiological approach is
applicable for modelling skin blood flow in thermoregulation.
1 INTRODUCTION
In order to maintain the core temperature within
narrow limits, the human body balances both heat
gain and heat loss (Hardy and Dubois, 1937).
Conservation of body heat during mild cold
challenges is primarily achieved by vasoconstriction
(i.e. constriction of blood vessels), which decreases
skin blood flow (Kellogg, 2006). Thereby heat
transport from the core to the skin is diminished and
eventually heat loss to the environment is decreased.
Hence, the accuracy of models of human
thermoregulation depends for a great deal on their
ability to predict skin blood flow. In the past various
models predicting skin perfusion responses have
been developed (Parsons, 2003). What these models
have in common is that they require an explicit set-
point; i.e. a reference temperature which is
compared with the actual body temperatures to
generate error signals. The effector response (in this
case vasoconstriction) is assumed to be proportional
to the error signal (Mekjavic and Eiken, 2006).
Although from an engineering perspective the
meaning of a set-point might be clear, application of
the concept in human physiology is still under
debate as it is not clear how this set-point could be
contained (Romanovsky, 2007). Alternatively, it is
hypothesized that thermoregulatory effectors could
also be modelled by using bell-shaped neural
156
Kingma B., Saris W., Frijns A., van Steenhoven A. and van Marken Lichtenbelt W..
MODELING SKIN BLOOD FLOW - A Neuro-physiological Approach.
DOI: 10.5220/0003059001560162
In Proceedings of the International Conference on Fuzzy Computation and 2nd International Conference on Neural Computation (ICNC-2010), pages
156-162
ISBN: 978-989-8425-32-4
Copyright
c
2010 SCITEPRESS (Science and Technology Publications, Lda.)

activation patterns of thermo-sensitive neurons, and
reciprocal cross inhibition (RCI) (Bligh, 2006). An
advantage of this approach is that the model
structure remains true to current neurophysiologic
knowledge on thermoregulation. For instance, the
thermoregulatory system does not sense temperature
directly, yet the information is coded into neuron fire
rates (Nakamura and Morrison, 2008a). Hence skin
blood flow is modelled from first principles instead
of simple regression.
In this study a mathematical model for skin
blood flow during cold exposure was developed
based on physiological data on neural thermo-
sensitivity and neural pathways. The aim of this
study was to investigate whether skin blood flow can
be adequately modelled through simulation of
thermo-sensitive neurons and neuro-physiological
pathways of excitation and inhibition.
2 METHODS
The model for the central control of skin blood flow
was based on thermal reception and neural pathways
that were mostly established by in vivo animal
experiments. To underline the importance of
modelling physiological responses from first
principles we first address the physiological
mechanisms, thereafter a mathematical translation is
described.
2.1 Physiology of Vasoconstriction
Physiological experimental evidence indicates that
skin blood flow is regulated by both reflex (neural)
and local mechanisms (Kellogg, 2006). Neural
control of vasoconstriction is mediated by the
sympathetic nervous system. Under thermoneutral
conditions blood vessels are under a baseline
sympathetic vasoconstrictor tone. During a cold
challenge an increase in sympathetic vasoconstrictor
tone causes blood vessels to constrict (Savage and
Brengelmann, 1996).
The ability of the body to react to a cold
challenge is determined by thermal reception, neural
integration of thermal information and vessel
responsiveness to the increased vasoconstrictor tone.
2.1.1 Thermal Reception
Thermal reception is mediated through temperature
sensitive neurons. The steady state fire rate vs.
temperature has a characteristic bell-shaped form.
In addition to steady state fire rates, temperature
dynamics influence the neuron fire rate such that
cold sensitive neurons will fire more often (also
referred to as bursts) during cooling than during
warming in the same temperature range (Zotterman,
1953, Mekjavic and Eiken, 2006). Likewise a warm-
sensitive neuron will fire more often when heated
rather than cooled. Although there is spatial
variation in the actual fire rate of neurons, the
general response of individual temperature sensitive
neurons has been accepted widely.
Figure 1: Figure after Zotterman (Zotterman, 1953),
steady-state fire rate of cold sensitive neuron (open circle)
and warm-sensitive neuron (closed circle).
2.1.2 Neural Integration
The specific integration of neural information
through neural pathways is still enigmatic. However
Nakamura and Morrison recently identified neural
control of cold defensive responses to skin cooling
in the rat (Nakamura and Morrison, 2008b,
Nakamura and Morrison, 2008a). For the
mathematical model we used their description of
sensory pathways, effector pathways and related
neuronal circuits (see Figure 1). Nakamura and
Morrison showed that in a neutral situation, when
there is virtually no cool input from the skin, cold
defence pathways are inhibited by warm sensitive
neurons in the hypothalamus. Hence, no
vasoconstriction occurs. However, during
environmental cooling, cold sensitive neurons at the
skin are excited and increase their fire rate.
Information of individual neurons is combined in
neurons of the spinal cord where it is transmitted to
the hypothalamus. There the warm sensitive neurons
in the hypothalamus are inhibited, which leads to the
increase of sympathetic adrenergic tone and
ultimately vasoconstriction.
2.2 Modelling of Vasoconstriction
The description of thermal reception and neural
integration was schematized in a diagram (See
Figure 2).
MODELING SKIN BLOOD FLOW - A Neuro-physiological Approach
157
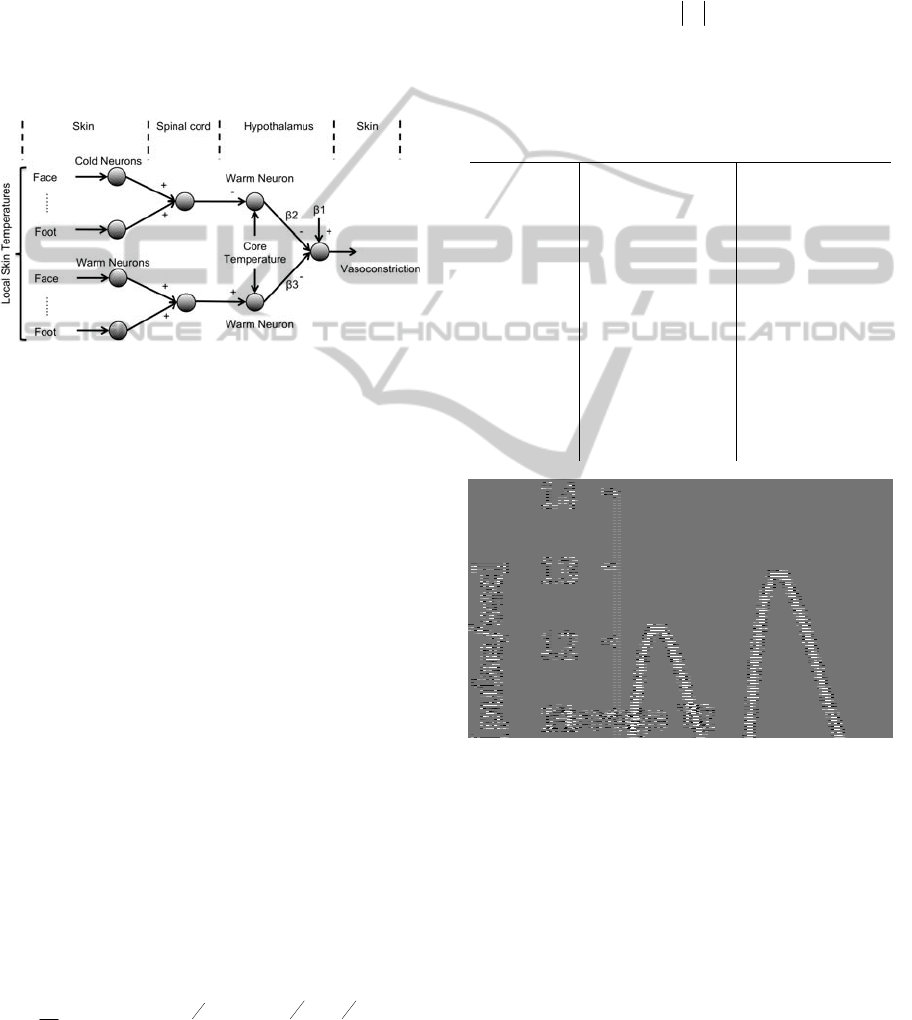
In the left part of the figure local skin
temperatures are transduced into neural coded
information by cold and warm sensitive neurons. In
the spinal cord section information from individual
neurons is combined and transmitted to the
hypothalamus. Warm sensitive neurons in the
hypothalamus transduce core temperature and are
inhibited by cold sensitive neurons from the
periphery, whereas peripheral warm sensitive
neurons perform an excitatory role. Control neurons
responsible for cold defence pathways are inhibited
by the warm sensitive neurons in the hypothalamus.
Figure 2: Schematic of neuronal model for control of skin
blood flow. + and – denote excitatory or inhibitory
pathways;
1 denotes the averaged combined effect of
other inputs than thermoreception on skin blood flow;
2
and
3 denote weighing of the inhibition of the cold
defense pathway by warm sensitive neurons in the
hypothalamus.
2.2.1 Thermal Reception
The neural input for the model is based on activation
patterns of thermo-sensitive neurons on the skin and
in the core region of the body. Simulation of both
the static and dynamic components of thermo-
sensitive neurons is based on the approach of
Mekjavic and Morrison (Mekjavic and Morrison,
1985). In their study they performed a polynomial fit
of the static fire rate of temperature sensitive
neurons. However, a typographical error seems to
have slipped in their table of coefficients. Here we
corrected the coefficients of the 2
nd
order of the
polynomial for warm receptors as 0.7707699 x 10
3
and the coefficient of the 6
th
order of the polynomial
for cold receptors as -0.26343323 x 10
0
, see Table 1
for the used coefficients.
Equations 1 to 3 describe the simulation of the
neuron fire rate (adjusted from Mekjavic, 1985):
C
i,t
1
t
F
1
A
0
1 e
j
K
P Ae
j
K
e
e
j
K
i
j 0
j
t
1
(1)
Here C
i,t
is the neural response at location i and
time t (C for cold sensitive neurons, W for warm
sensitive neurons);
t is the time interval (60 sec); F
1
is the static neuron fire rate at t=t-1. A
0
and A are
static gain factors that depend on the difference
static fire rates between two moments in time.
A
0
F
2
F
1
(2)
A
5.0
F
1
A
0
(3)
Table 1: Coefficients for the 10
th
order polynomial
function of static neuron fire rate as given in Mekjavic and
Morrison (1985). Coefficients in bold are corrected values.
Polynomial
order
Cold sensitive
neuron
Warm sensitive
neuron
0
-0.19005313e6 0.1526647e5
1
0.85318078e5 -0.5147704e4
2
-0.16974919e5
0.7707699e3
3
0.19724509e4 -0.67475955e2
4
-0.14833377e3 0.38244284e1
5
0.75486723e1 -0.14664175e0
6 -0.26343323e0
0.38526706e-2
7
0.62289589e-2 -0.68496075e-4
8
-0.95563808e-4 0.78889647e-6
9
0.85949930e-6 -0.53173142e-8
10
-0.34432887e-8 0.15936041e-10
Figure 3: Example of simulated neuron response using
Equation 1. The peak indicates an excitatory response,
after which the fire rate returns to its static level. The
dynamic component is larger for larger variations in
temperature. The average fire rate during 1 minute was
used as the input fire rate for the model.
K=5.5, K
i
=3.3 and K
e
=5.5 are static, inhibitory and
excitatory gain factors respectively. P is a sign
operator indicating an inhibitory or excitatory res
ponse. When cold sensitive neurons are heated P is
negative, when the same neurons are cooled P is
positive; vice versa for warm sensitive neurons. See
Figure 3 for an example of neuron simulation.
ICFC 2010 - International Conference on Fuzzy Computation
158

2.2.2 Neural Integration
As can be seen in Figure 2, neural information from
skin sites was integrated at the spinal neurons. From
then on, neuron response was considered as a neural
drive. The resulting neural drive (N) from cold (C)
and warm (W) sensitive neurons was defined as the
average fire rate over all locations.
N
Skin,Cold
C
i,t
n
loc
(4)
N
Skin,Warm
W
i,t
n
loc
(5)
It should be pointed out that due to the non-linear
characteristics of neuron fire rates, as a function of
temperature and temperature history, the mean skin
temperature was not used to calculate the neural
drive. For example, given two temperatures
T
1
=25C and T
2
=35C, due to the bell-shaped form
of the static neuron fire rate, the neuron fire rate of
the averaged temperature (30C) is not equal to the
averaged neuron fire rates at T
1
and T
2
.
The hypothalamic neural drive was calculated as
the neural response to core temperature. The
response of neurons in the body core is shifted by
2C (Mekjavic and Morrison, 1985). Inhibition of
core neural drive by peripheral cold neurons was
calculated by subtraction of cold peripheral neural
drive from the core neural drive. Likewise,
excitation of core neural drive by peripheral warm
neurons was simulated by addition of warm
peripheral neural drive on the core neural drive.
H
cold
N
Core,Warm
N
Skin,Cold
(6)
H
warm
N
Core,Warm
N
Skin,Warm
(7)
Here H denotes the net hypothalamic neural
drive of either warm or cold pathway and N denotes
the neural drive of neurons given their position and
type.
Weighting factors for the neural drive on cold
sensitive neurons (
2 and
3 in Figure 2) were
estimated by least squares regression using the
following model:
y
1
2
H
cold
3
H
warm
(8)
Here y denotes the perfusion response. The
constant
1 can be interpreted as the averaged
combined effect of other factors on skin blood flow.
2.3 Validation
The model is validated by k-fold cross validation.
This method maximizes the available data by fitting
the model on the average response of n-1 subjects
and calculating the mean squared residuals (MSR)
on the remaining subject.
MSR
y
t
fx
t
2
n
(9)
Where y
t
is the measured perfusion at time point
t, f(x
t
) is the model prediction at t and n is the
number of measurement points in one recording.
The MSR provides a measure of the quality of the
model prediction, irrespective of the length of
measurement. This process is iterated k times (k=n)
where each fold the model is fitted and tested on a
unique subset. Hence k-fold cross validation
provides a measure of the ability of the model to
predict the vasoconstriction response over
individuals whilst maintaining the experimental
conditions constant. The average MSR over k
iterations is used as general measure of the
capability of the model to predict perfusion.
2.4 Experimental Protocol
Eight young adult males (18 to 28 yrs) were
included (characteristics in Table 2). All subjects
were healthy, non-obese and not taking medications.
Subjects were in fastened state and refrained from
caffeinated or alcoholic beverages in the morning
prior to the test. The medical ethical committee of
Maastricht University Medical Centre+ approved the
study. Each subject gave verbal and written
informed consent prior to participation in the study.
All procedures conformed the standards of the
Declaration of Helsinki.
Table 2: Subject characteristics.
Variable
Mean ± SE
Age, yr
23.63 ± 1.05
Height, m
1.81 ± 0.02
Mass, kg
69.05 ± 3.49
BMI, kg/m
2
21.07 ± 1.07
Mean BP, mmHg
85.00 ± 1.98
Whole body fat, %
15.93 ± 1.60
Leisure Activity Level
3.34± 0.19
2.4.1 Protocol
Subjects arrived at the laboratory at 9:00 a.m. Skin
temperature was measured in 1-minute intervals by
MODELING SKIN BLOOD FLOW - A Neuro-physiological Approach
159

i-buttons (type DS1921H; Maxim/Dallas
Semiconductor Corp., USA) at the 14 positions of
the ISO standard for mean skin temperature
(Parsons, 2003, van Marken Lichtenbelt et al.,
2006). Core temperature was measured in 1-minute
intervals using a telemetric pill (Coretemp,USA).
Whole body skin temperature was controlled by a
water perfused suit (DTI, TUBEsuit) in combination
with a water temperature control unit (Blanketrol II,
Cincinnati Sub-Zero). Skin perfusion was sampled at
8Hz using laser-Doppler flowmetry (Perimed, PF
5000, Sweden) at the ventral side of the hand
between the base and metacarpal of the thumb.
Custom made Peltier elements in the casing of the
probe allowed for local temperature control. Whole
body fat percentage was measured using Dual X-ray
absorptiometry. Leisure activity level was indexed
by a Baecke questionnaire. Subjects were in supine
position and were able to watch TV. Room air
temperature was kept at 24C. A small draft in the
room was allowed to assure sufficient ventilation.
Before starting the measurements subjects
maintained in supine position for 1 hr to become
accustomed to the environment. During this period
the temperature of the water suit was maintained at
33.5C. Measurements were divided in a 15-minute
baseline period where the water temperature of the
suit was kept at 33.5C followed by 15-minutes of
whole body cooling where the temperature control
unit was set to 10C. Short term cooling was
preferred to minimalize the influence of other factors
than acute sympathetic activation of the nervous
system on vasoconstriction (Johnson, 2007). To
avoid interference from local skin perfusion
regulation, local skin was clamped at 33C
throughout the entire experiment (Kingma et al.,
2010).
2.5 Data Handling
Data handling and model development was
performed using Matlab R2007a, figures were
created with Microsoft Excel 2008 for Mac;
statistical tests on subject characteristics were
performed with SPSS16.0 for Mac. Perfusion data
was resampled to 1-minute intervals using a
(lowpass) FIR filter and normalized over the
baseline period. Temperature data were sampled on
a minute base. Peripheral warm and cold neuron fire
rates were simulated in 1-minute intervals for each
measured location and sequentially averaged over
subjects.
3 RESULTS
Estimated coefficients, regression statistics and k-
fold cross validation results of the neural model are
presented in Table 3.
Table 3: Estimated model coefficients, 1: model
constant; 2: integrated pathway of peripheral cold
neurons and hypothalamic warm neurons; 3: integrated
pathway of peripheral warm neurons and hypothalamic
warm neurons. Regression statistics: p-value, r
2
and
averaged mean squared residuals (MSR).
1
25.48
2
-1.44
3
3.26
R
2
-value
0.91
p-value
p<0.001
Averaged MSR
0.087
Averaged variance
0.080
Neural model regression analysis yielded
significant fits on the measured data. Given the high
r
2
–values the majority of the measured variance
could be explained by the model (Table 3).
Furthermore the averaged MSR of the k-fold cross
validation is close to the time-averaged variance in
the measurements, indicating that there is a small
bias in the model prediction.
Perfusion measurements and the model
prediction are shown in Figure 4. After t=15 subjects
were cooled and vasoconstriction is observed
immediately. After 10 minutes of cooling perfusion
reached a nadir. The fitted line through the data
points represents the prediction of the neural model.
Figure 4: Measured and fitted perfusion response. After 15
minutes whole body cooling was performed. Error bars
represent SEM.
ICFC 2010 - International Conference on Fuzzy Computation
160

4 DISCUSSION
In this study a model for skin blood flow during cold
exposure was developed based on neuro-
physiological concepts. Simulation of thermo-
reception through warm and cold sensitive neurons
was adapted from work by Mekjavic and Morrison
(Mekjavic and Morrison, 1985). Pathways of neural
integration were based on animal experiments by
Nakamura and Morrison (Nakamura and Morrison,
2008a, Nakamura and Morrison, 2008b). Neural
drives that were calculated by the model were fitted
to human experimental data on hand skin perfusion.
Given the high value of explained variance, the
model predicts vascular responses to a mild thermal
cold stimulus adequately. Furthermore, the averaged
MSR values are close to the variance of the
measurements. Therefore, this study shows that an
explicit declaration of a set point is not necessary for
modelling skin perfusion during short term cooling.
4.1 Limitations
The neuron response and neural afferent pathways
are established in small mammals and projected on
human response. Therefore, the modeled pathways
might deviate from the actual pathways in humans.
However, as long as no detailed human studies on
neural pathways and integration are available we
have to rely on these elaborate animal studies.
In general the thermoregulatory response is
subject to both thermal factors and non-thermal
factors like exercise or pathologies like motion-
sickness and fever (Mekjavic and Eiken, 2006). The
experimental set-up was developed to minimize the
influence of other factors than central sympathetic
regulation on vasomotor response. Also, other
factors such as humoral effects, or local regulation
(Q
10
-effect) are now neglected, but are known to
affect vasoconstriction. Therefore no conclusion can
be made on the relative influence of factors that
work either before or after the reciprocal cross-
inhibition.
The authors acknowledge that the current model
coefficients were not validated against data sets with
different experimental conditions. Therefore it is not
possible to conclude that the coefficients hold for
other types of thermal challenges.
In this study we did not incorporate the effect of
differences in spatial thermo-sensitivity. With a
greater dataset it might be possible to assign weights
to the individual branches of thermo-sensitive input
(face, hand, chest, etc.). It is however not possible to
use data of published studies, because usually mean
skin temperatures are presented. Our model instead
requires local skin temperature data.
5 CONCLUSIONS
In summary, this study presents a mathematical
model for skin blood flow during cold exposure
based on thermo-sensitive neurons and neuro-
physiological pathways. The model was fitted to
experimental data where young adult males were
exposed to a short mild cold exposure. The model
explained over 90% of the variance in the
measurements (r
2
=0.91). Hence, although further
research is warranted, the results of this model based
on first principles of neuro-physiological control of
skin blood flow are promising.
ACKNOWLEDGEMENTS
This study was sponsored by Senter Novem, The
Netherlands.
REFERENCES
Bligh, J. (2006) A Theoretical Consideration Of The
Means Whereby The Mammalian Core Temperature Is
Defended At A Null Zone. J Appl Physiol, 100, 1332-
7.
Hardy, J. D. & Dubois, E. F. (1937) Regulation Of Heat
Loss From The Human Body. Proc Natl Acad Sci U S
A, 23, 624-31.
Johnson, J. M. (2007) Mechanisms Of Vasoconstriction
With Direct Skin Cooling In Humans. Am J Physiol
Heart Circ Physiol, 292, H1690-1.
Kellogg, D. L., Jr. (2006) In Vivo Mechanisms Of
Cutaneous Vasodilation And Vasoconstriction In
Humans During Thermoregulatory Challenges. J Appl
Physiol, 100, 1709-18.
Kingma, B. R., Frijns, A. J., Saris, W. H., Van
Steenhoven, A. A. & Van Marken Lichtenbelt, W. D.
(2010) Cold-Induced Vasoconstriction At Forearm
And Hand Skin Sites: The Effect Of Age. Eur J Appl
Physiol, 109, 915-21.
Mekjavic, I. B. & Eiken, O. (2006) Contribution Of
Thermal And Nonthermal Factors To The Regulation
Of Body Temperature In Humans. J Appl Physiol,
100, 2065-72.
Mekjavic, I. B. & Morrison, J. B. (1985) A Model Of
Shivering Thermogenesis Based On The
Neurophysiology Of Thermoreception. Ieee Trans
Biomed Eng, 32, 407-17.
Nakamura, K. & Morrison, S. F. (2008a) A
Thermosensory Pathway That Controls Body Tempe-
MODELING SKIN BLOOD FLOW - A Neuro-physiological Approach
161

rature. Nat Neurosci, 11, 62-71.
Nakamura, K. & Morrison, S. F. (2008b) Preoptic
Mechanism For Cold-Defensive Responses To Skin
Cooling. J Physiol, 586, 2611-20.
Parsons, K. (2003) Human Thermal Environments, Taylor
& Francis.
Romanovsky, A. A. (2007) Thermoregulation: Some
Concepts Have Changed. Functional Architecture Of
The Thermoregulatory System. Am J Physiol Regul
Integr Comp Physiol, 292, R37-46.
Savage, M. V. & Brengelmann, G. L. (1996) Control Of
Skin Blood Flow In The Neutral Zone Of Human
Body Temperature Regulation. J Appl Physiol, 80,
1249-57.
Van Marken Lichtenbelt, W. D., Daanen, H. A., Wouters,
L., Fronczek, R., Raymann, R. J., Severens, N. M. &
Van Someren, E. J. (2006) Evaluation Of Wireless
Determination Of Skin Temperature Using Ibuttons.
Physiol Behav, 88, 489-97.
Zotterman, Y. (1953) Special Senses: Thermal Receptors.
Annu Rev Physiol, 15, 357-72.
ICFC 2010 - International Conference on Fuzzy Computation
162
