
EXPLORATION OF QUANTITATIVE ASSESSMENT IN
SYSTEMS ARCHITECTURE USING EVIDENTIAL REASONING
Yixing Shan, Lili Yang
Business School, Loughborough University, Leicestershire, LE11 3TU, U.K.
Roy Kalawsky
Electronic and Electrical Engineering Department, Loughborough University, Leicestershire, LE11 3TU, U.K.
Keywords: Multiple Attribute Decision Making (MADM), Evidential Reasoning (ER), Open systems, Architecture
assessment.
Abstract: A key issue in successful developing complex systems is how to assess the performance of architecture
model during the development process. Traditional assessment techniques are subjective and usually
highlight weaknesses rather than provide quantitative and objective results. In addition, the increasing
complexity of systems nowadays; has led to a move from federated systems which were closed and target
unique to embedded open systems, which extends new criteria to be considered in the assessment. This
paper provides an insight into how Evidential Reasoning (ER) approach as the specific Multi-Attribute
Decision Making (MADM) method can be used as a type of system assessment technique. The theory and
implementation details of ER with an initial case study are presented.
1 INTRODUCTION
Due to the cost of building and implementing large-
scale systems, it is vital to make sure architecture
designs are as accurate as possible before they are
built (IWAG 2007). The assessment of an
architecture model at early stage of the systems
development process will allow stakeholders and
engineers to have a better understanding of the
strengths and weaknesses of the architecture for
better decision making, to verify whether the system
is right against specifications and requirements in
order to meet the customer needs. Fixing defects
after software code has been implemented is at least
three times more costly (McConnell 2001). For
embedded systems, this cost saving could be more
when considering its complexity and hardware costs.
Many existing assessment techniques are
subjective and merely a step-by-step guide on how
to design architecture and qualitatively explain how
the architecture will meet the requirements or outline
possible weak points (Barbacci 2002). Although
they describe themselves as architecture assessment
methods, they appear to be more risk identification
or weakness analysis.
A possible way to assess an system more
accurately would be to quantitatively assess the
quality attributes, which are defined as a high level
system characteristic which cannot normally be
measured directly, specific to the system (Purewal,
Yang and Grigg 2009). Hence, the architecture
assessment process becomes an increasing complex
decision making problem in which one must
simultaneously cater in a rational way for many
inter-related criteria. It is also noted that the
architecture assessment has to be conducted on the
basis of both precise data and subjective judgments
that are vague in nature.
In this paper, we will focus on how Evidential
Reasoning (ER) approach primarily used in
management and business studies can be
implemented into the domain of systems engineering
to create a method of assessment for systems
architecture. The rest of the paper is organized as
follows: after a belief explanation of the open
systems and traditional architecture assessment
methods, we will introduce Multiple Attribute
Decision Making concept and describe the details of
146
Shan Y., Yang L. and Kalawsky R..
EXPLORATION OF QUANTITATIVE ASSESSMENT IN SYSTEMS ARCHITECTURE USING EVIDENTIAL REASONING.
DOI: 10.5220/0003062901460152
In Proceedings of the International Conference on Evolutionary Computation (ICEC-2010), pages 146-152
ISBN: 978-989-8425-31-7
Copyright
c
2010 SCITEPRESS (Science and Technology Publications, Lda.)

ER approach. This is then followed by a case study
that demonstrates the application of the method and
its implementation of possible architecture
assessment in the future. Conclusion and future
work are provided at the end of the paper.
2 OPEN SYSTEMS
AND ARCHITECTURE
ASSESSMENT
Open systems architecture implements sufficient
open specifications for interfaces, services, and
supporting formats to enable properly engineered
components to be utilized across a wide range of
systems with minimal changes, to interoperate with
other components on local or remote systems, and to
interact with users in a style that facilitates
portability (SEI-CMU 2008). The idea is that of a
desktop computer, where components can be
obtained from many independent sources and are
still compatible with the system (Henderson 2006).
Common advantages include reduced cost by using
commercial off-the shelf components (Zalcman
2002), better supportability which is based on the
fact that a faulty module can be replaced with a new
module without being necessary to be identical, thus
encouraging upgrade strategies (Murdoch and Hardy
2000), increased operational flexibility and
simplifying maintenance (Clements and Bergey
2005), combining affordable cost with the ability to
deal with rapidly evolving technology (Borky et al
1998).
To allow these development enhancements, a
number of underlying principles are used, including:
modularity of system functionality, adaptive
architecture (at design time), modular and layered
architecture components, flexible data interconnect
architecture. These characteristics extend other
criteria need to be considered in the architecture
assessment such as the use of standards, well defined
documentation, and level of impact when upgrading
or expanding the system (Purewal, Yang and Grigg
2009).
Currently, most existing assessment techniques
are based on the traditional federated system, which
do not support independent analysis of applications
on a shared resource (Conmy and McDermid 2001).
Among them, the most popular assessment methods
are those created by the Software Engineering
Institute (SEI), including the Quality Attribute
Workshop (QAW) and the Architecture Trade-Off
Analysis Method (ATAM) (Barbacci 2002). For
QAW, it does assessment in a very subjective
manner by exploring scenarios of an architecture
model and most results are documents with written
test cases and how the system will handle such cases
so that the stakeholders may be interpreted into
different ways. While for ATAM, it is more of a
guide on how to build the system rather than
precisely predict the behaviour of the system
characteristic. They are more types of analysis
methods rather than assessment scoring.
3 MCDM AND ER
Multiple Attribute Decision Making (MADM) refers
to making decision in the presence of multiple,
ususlly conflicting, criteria (Xu and Yang 2001).
Since 1970s, many MCDM methods have been
developed, such as the well-know Analytical
Hierarchy Process (AHP) (Saaty, 1977, 1988, 1994)
and Multiple Attribute Utility Theory (Keeney and
Raiffa 1993; Jacquet-Lagreze and Siskos 1982;
Belton and Stewart 2002). In those methods, as well
as their extensions, such as the interval-valued
assessment approach, MADA problems are
modelled as different alternatives which are assessed
on each criterion by either a single real number of an
interval value. While in many decision situations,
information will be of different types of forms, such
as a subjective judgement with uncertainty, a
probability distribution, or an incomplete piece of
data. Thus, using a single number or an interval
value to represent a judgement proves to be difficult
and sometimes unacceptable.
Evidential Reasoning (ER) (Yang and Singh
1994; Yang and Sen 1994; Yang 2001; Yang and Xu
2002a,b) is one of the latest developments within
MCDM literature. Based on a belief decision
structure and the evidence combination rule of the
Dempster-Shafer (D-S) theory (Dempster 1967;
Shafer 1976), the ER approach can both model
precise data and capture various types of
uncertainties such as ignorance (incomplete
information) and fuzziness (vague judgments). It has
been applied to decision problems in engineering
design, safety and risk assessment, organizational
self-assessment, and supplier assessment (Yang and
Xu 2002a).
3.1 Details of the ER Approach
In the ER application, assessment process can be
divided into five main parts: setting up the hierarchy,
weighting the basic attributes, normalizing the
EXPLORATION OF QUANTITATIVE ASSESSMENT IN SYSTEMS ARCHITECTURE USING EVIDENTIAL
REASONING
147

attribute value into one scale, evidence combination
and final assessment by aggregating the attributes.
3.1.1 Assessment Hierarchy
and Belief Decision Matrix
The assessment hierarchy is typically constructed
with attributes at different levels. A high level
attribute may represent a type of system
characteristic so that it is comparable with other
attributes. Such an attribute may only be evaluated
through a set of detailed factors which are associated
with measurable attributes or another embedded
hierarchical structure. The definition of attributes
and hierarchical structure is typically based on the
experts’ knowledge and the literature. Once the
hierarchy set up, a belief decision matrix D
g
can be
defined as follows:
Suppose M upper level attributes a
m
,
m = 1, . . . , M, which are referred to as problem
alternatives, are to be assessed based on L lower
level attributes e
i
, i = 1, . . . , L, named basic
attributes.
Meanwhile, M alternatives are all assessed using
the same set of N assessment grades H
n
, n = 1, . . . ,
N, which are required to be mutually exclusive and
collectively exhaustive for the assessment of all
attributes.
If alternative a
m
is assessed to a grade H
n
on an
attribute e
i
to a belief degree of B
n,i
, this assessment
will be denoted by S( e
i
( a
m
) ) = {( H
n
, B
n,i
( a
m
)),
n = 1, . . . , N}.
The individual assessments of the M alternatives
on the L basic attributes can be then represented by
the belief decision matrix D
g
= ( S ( e
i
( a
m
)))
L×M
.
In above definition, the belief degree is originally
designed to model a subjective assessment with
uncertainty (Yang and Singh 1994; Yang and Sen
1994). The expert may not always be one hundred
percent sure that the state of a factor is exactly
confirmed to one of the assessment grades. Thus one
or more single assessment grades may
simultaneously be combined to confirm the total
confidence of anything up to one hundred percent.
For example, to evaluate the attribute “Coupling
level” of a modular system at the development stage
a
m
, an expert may be 60% sure it is low and 30%
sure it is medium. In the statement above, “low” and
“medium” denote distinctive assessment grades, and
the percentage values of 60 and 30 are referred to as
the degrees of belief, which indicate the extents that
the corresponding grades are assessed to. Stage a
m
corresponds to an assessment alternative. Such
assessment can be thus expressed as follows:
S(Coupling(a
m
)) = {(low, 0.6), (medium, 0.3)}
(1)
It can be also noted that as the total degree of belief
is 0.6 + 0.3 = 0.9 < 1, the assessment in above
example is described as incomplete assessment.
3.1.2 Weighting
Weighting refers to assigning relative weights to the
L basic attributes e
i
by W = (w
1
, . . . , w
L
), which are
supposed to be known and satisfy the conditions
0 ≤ w
i
≤ 1 and
∑
=1
.
It plays an important role in assessment. In
determining the weights of different assessment
attributes, different methods can be implemented,
such as simple direct rating by an expert, or more
elaborate methods based on the pair-wise
comparison technique (Saaty 1988; Yang, Deng and
Xu 2001).
3.1.3 Normalization
Normalization refers to transforming the various
types of information at basic attributes into the belief
degree space which can be recognized by the
algorithm.
For qualitative assessment, the transformation is
to transform the various sets of evaluation standards
to a unified set so that all attributes can be assessed
in a consistent and compatible manner. For example,
the set of grade H = {H
n
, n = 1, ... , 7} can be
transformed to the set of grade K = {K
n
, n = 1, ... ,
5} as follows:
K
1
= {(H
1
, 1.0)},
K
2
= {(H
2
, 0.5),(H
3
, 0.5)},
K
3
= {(H
4
, 1.0)}, (2)
K
4
= {(H
5
, 0.5),(H
6
, 0.5)},
K
5
= {(H
7
, 1.0)},
For quantitative assessment, suppose any
precisely known attribute value y
i
, it must lie
between two adjacent assessment grades: Y
n,i
≤ y
i
≤
Y
n+1,i
, where n ϵ {1, ... , N-1}. It is obvious that we
can use these two assessment grades to characterize
the attribute value y
i
. Let B
n,i
and B
n+1,i
characterize
the belief degrees to which y
i
is assessed to the
grades Y
n,i
and Y
n+1,i
respectively, calculated by
B
n,i
= (Y
n+1,i
– y
i
) / (Y
n+1,i
– Y
n,i
) (3)
B
n+1,i
= (y
i
- Y
n,i
) / (Y
n+1,i
– Y
n,i
) (4)
Further detailed of transformation technique can be
referred in paper (Yang 2001).
ICEC 2010 - International Conference on Evolutionary Computation
148

3.1.4 Evidence Combination
In the evidence combination step, the ER algorithm
first transforms the original belief degrees, which
have been obtained in the scaling step, into basic
probability masses by combining the relative
weights and the belief degrees using the following
equations:
p
n,i
= p
i
(H
n
) = w
i
B
n,i
(a
m
), n = 1, ... , N, i = 1, ..., L (5)
p
H,i
= p
i
(H) = 1-
∑
,
= 1 -
∑
,
(
)
, i = 1, ... , L
(6)
,p
H,i
= ,p
i
(H) = 1 – w
i
, i = 1, ... , L (7)
p
H,i
= p
i
(H) = w
i
(1 -
∑
,
(
)
), i = 1, ... , L (8)
with p
H,i
= p
H,i
+ p
H,i
and
∑
=1
Here we can see the ignorance and uncertainty in the
individual assessment is broke down into two parts,
p
H,i
and p
H,i
, so that can be treated differently,
where p
H,i
is the unassigned probability mass caused
by the relative importance of the attribute e
i
, p
H,i
is
the unassigned probability mass caused by the
incompleteness of the assessment on e
i
. The p
H,i
is
the total of them, named the probability mass
assigned to the whole set H.
Next, based on the D-S theory, the basic
probability masses on the L basic attributes are
aggregated into the combined probability
assignments by using the following analytical
formulae:
{H
n
}: p
n
= k[
∏
(
,
+
,
+
,
)
-
∏
(
,
+
,
)
],
n = 1, ... , N (9)
{H}: p
H
= k[
∏
(
,
+
,
)
-
∏
,
] (10)
{H}: p
H
= k[
∏
,
] (11)
where
k = [
∑∏
(
,
+
,
+
,
)
- (N-1)
∏
(
,
+
,
)
]
-1
(12)
Finally, the combined probability assignments are
normalized into overall belief degrees by using the
following equations:
{H
n
}: B
n
= p
n
/ (1 – p
n
), n = 1, ... , N (13)
{H}: B
H
= p
H
/ (1 – p
H
) (14)
where B
n
and B
H
represent the overall belief degrees
of the combined assessments assigned to the
assessment grades H
n
and H, respectively. This
combined assessment can be denoted by
S(y(a
m
)) = {(H
n
, B
n
(a
m
)), n = 1, ... , N}
The above formulae (5)-(14) together constitute a
complete ER analytical algorithm which is
considered as the theory foundation of the ER ap-
proach in the business application.
3.1.5 Final Assessment with Utility
In the final assessment step, expected utility values
are calculated for ranking alternatives, as distributed
descriptions are not sufficient to show the difference
between two assessments.
Suppose H
1
is the least preferred grade having
the lowest utility and H
N
the most preferred grade
having the highest utility. Then the maximum,
minimum and average expected utilities on
alternative y are given by:
u
max
(y) =
∑
(
)
+ (B
N
+ B
H
)u(H
N
) (15)
u
min
(y) = (B
N
+ B
H
)u(H
1
) +
∑
(
)
(16)
u
avg
(y) = (u
max
(y) + u
min
(y)) / 2 (17)
If all original assessments are complete, then B
H
= 0
and u(y) = u
max
(y) = u
min
(y) = u
avg
(y).
We say u(y
n+1
) is preferred to u(y
n
) if and only if
u(y
n+1
) > u(y
n
).
4 INITIAL CASE STUDY OF ER
The ER algorithm has been developed into a
software program named IDS Multi-criteria
Assessor, or IDS for short. In this section, the
software will be used to carry out the assessment in
our case study to provide an insight of how the
approach can be implemented in order to assess the
system architecture.
As the first part, an assessment hierarchy with
the weight of each attribute is formed as shown in
table 1 below:
Table 1: Assessment attributes hierarchy and the weights
associated.
Level 1 Level 2 Level 3
1. Openness
(45%)
1.1 Modularity
(60%)
1.1.1 Coupling (35%)
1.1.2 Interface
Complexity (65%)
1.2 Interoperability
(40%)
1.2.1 Standard
Interfaces (70%)
1.2.2 Stable Interfaces
(30%)
2. Functionality
(55%)
2.1 Operability
(70%)
2.1.1 Initialisation
(15%)
2.1.2 Partitioning (20%)
2.1.3 Scheduling (45%)
2.1.4 Timing (20%)
2.2 Maintainability
(30%)
2.2.1 Complexity (75%)
2.2.2 Documentation
(25%)
EXPLORATION OF QUANTITATIVE ASSESSMENT IN SYSTEMS ARCHITECTURE USING EVIDENTIAL
REASONING
149
Although the attributes selecting is based on the
literature review of the systems engineering and the
field work conducted within Systems Engineering
Innovation Centre (SEIC), the hierarchy and weights
of each attribute are to some extent assumed for
simplicity.
Table 2 presents the belief degrees of each
measurable factor in two different development
stages. The values assigned here is also by
assumption. But to be noted, in the real application,
these values assignment can be calculated through
restrict definition and appropriate methods. For
example, the level of attribute “Complexity” can be
calculated by the number of classes, number of
interfaces, number of operations, number of
connectors etc.
Table 2: Assessment data for measurable factors.
Level 3 Factors Development Stages (alternatives)
Stage 1 Stage 2
1.1.1 Coupling {43,1.0} {57,1.0}
1.1.2 Interface
Complexity
{82,1.0} {49,1.0}
1.2.1 Standard
Interfaces
{65,1.0} {63,1.0}
1.2.2 Stable
Interfaces
{47,1.0} {44,1.0}
2.1.1
Initialisation
{(A,0.8),
(G,0.2)}
{(A,0.4),
(G,0.6)}
2.1.2
Partitioning
{(P,0.5),
(A,0.5)}
{(P,0.2),
(A,0.6),
(G,0.1)}
2.1.3 Scheduling {(A,0.2),
(G,0.7)}
{G,1.0}
2.1.4 Timing {A,1.0} {(P,0.2),
(A,0.7),
(G,0.1)}
2.2.1
Complexity
{78,1.0} {62.1.0}
2.2.2
Documentation
{92,1.0} {72,1.0}
(The assessment grades for qualitative attributes are defined as W
– worst, P – poor, A – average, G – good and B – best. The
quantitative attributes are assessed from 0 to 100, where 100
represent the best situation. The number behind the assessment
grade or value represents the belief degree.)
We can see both qualitative and quantitative
attributes in the model. Assessment with uncertainty
between different grades and incomplete assessment
on individual attribute are demonstrated.
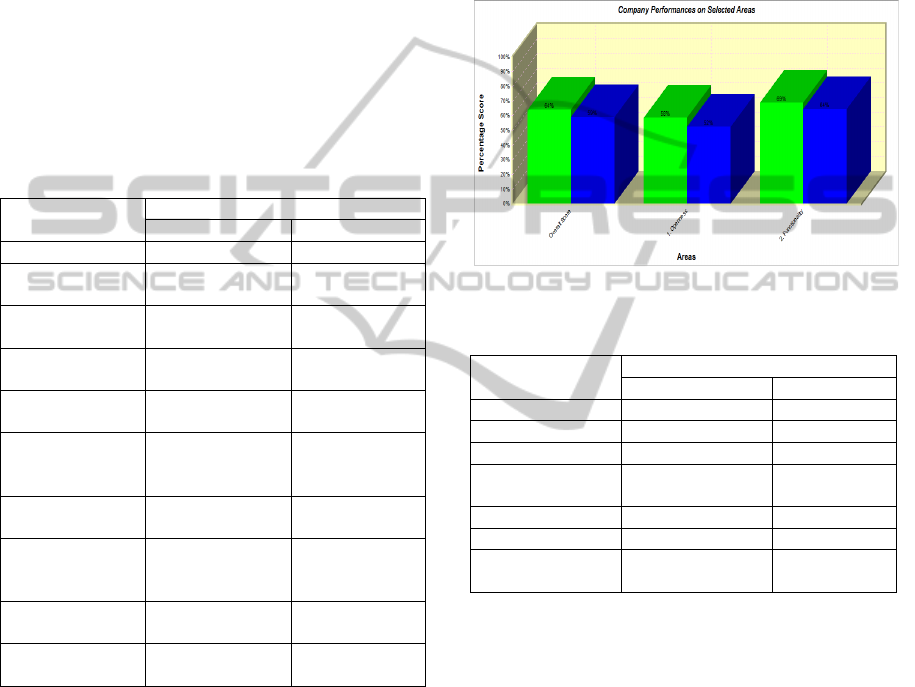
Figure 1 and Table 3 below shows the results of
the overall assessment implemented by the IDS. It
can be seen the overall score for development stage
1 (0.6418) is better than the stage 2 (0.5891), which
can be concluded that the modification work in
development stage 2 is not successful comparing
with the original achievement (stage 1). Further
examine the assessment of each high level system
characteristic, only the scoring of operability is
improved in development stage 2. We can thus make
a possible conclusion according to the results of the
assessment that other system characteristics are
sacrificed in the improving of system operability in
development stage 2. It is not a recommended
modification from the view of overall.
Figure 1: Overall score of the assessment.
Table 3: Utility results of the final assessment.
High level
attributes
Development stages (alternatives)
Stage 1 Stage 2
Overall score 0.6418 0.5891
1. Openness 0.5840 0.5218
1.1 Modularity 0.6250 0.5223
1.2
Interoperability
0.5510 0.5296
2. Functionality 0.6879 0.6447
2.1 Operability 0.5220 0.5926
2.2
Maintainability
0.8433 0.6793
5 CONCLUSIONS AND FUTURE
WORK
The initial investigation in this paper has shown that
ER approach appears to provide a method to
quantitatively assess the current system
architectures, with the ability to deal with various
types of uncertainties.
In recent years, the original ER approach has
been further developed to support the solution of
MADM problems with interval grades assessment
(Xu, Yang and Wang 2006; Wang, Yang, Xu and
Chin 2006), type of fuzziness (Yang, Wang , Xu and
Chin 2006) and even both of them (Guo, Yang Chin,
Wang and Liu 2009).
In Interval ER (IER) approach, the unknown por-
ICEC 2010 - International Conference on Evolutionary Computation
150

tion of performance represented by the probability
mass assigned to the whole set H in the original ER
is narrowed on the subsets of adjacent grades so that
taking the advantage with ability of handling the
interval judgement and reducing the uncertainty in
the final assessment.
In fuzzy ER and fuzzy IER approaches,
triangular and trapezoidal fuzzy sets are
incorporated into the ER and IER to simulate the
overlap of adjacent assessment grades to support the
solution of more sensitivity analysis in complex
MADM problems. However, due to additional
uncertainties caused by the fuzzy sets, the
uncertainties of the final assessment will be enlarged
apparently in comparison with the non-fuzzy results.
The next stage of our research is to investigate
how the ER approach and its extensions can be
modified in any way in order to be implemented into
the actual application of architecture assessment.
REFERENCES
Barbacci, M. R., 2002. SEI architecture analysis
techniques and when to use them. Carnegie-mellon
University Software Engineering Institute Technical
Note, CMU/SEI-2002-TN-005.
Belton, V., Stewart, T. J., 2002. Multiple criteria decision
analysis – an integrated approach. Kluwer Academic
Publishers.
Borky, J. M., Lachenmaier, R. N., Messing, J. P., Fandk,
A., 1998. Architectures for next generation military
avionics systems. In Proceedings of the IEEE
Aerospace Conference, Vol.1, pp. 265-281.
Clements, P., Bergey, J., 2005. The U.S. Army’s Common
Avionics Architecture System (CAAS) product line: a
case study. Carnegie-Mellon University Software
Engineering Institute Technical Report CMU/SEI-
2005-TR-019.
Conmy, P., McDermid, J., 2001. High level failure
analysis for integrated modular avionics. In 6
th
Australian Workshop in Industrial Experience with
Safety Critical Systems and Software, Brisbane.
Dempster, A. P., 1967. Upper and lower probabilities
induced by a multi-valued mapping. Annals of
Mathematical Statistics 38: 325-339.
Guo, M., Yang, J. B., Chin, K. S., Wang, H. W., Liu, X.
B., 2009. Evidential reasoning approach for
multiattribute decision analysis under both fuzzy and
interval uncertainty. IEEE Transactions on Fuzzy
Systems, Vol.17, No.3.
Henderson, P., 2006. The architecture of open systems –
presentation. Dependable Systems and Software
Engineering and Open Middleware Infrastructure
Institute, University of Southampton.
Industrial Avionics Working Group (IAWG). Parallel
certification study: design architecture and safety case
architecture trade-off and mutual optimisation.
Industrial Paper for IAWG Parallel Certification
Study, IAWG-AJT-703.
Jacquet-lagreze, E., Siskos, J., 1982. Assessing a set of
additive utility functions for multicriteria decision
making, the UTA method. European Journal of
Operational Research 10(2), 151-164.
Keeney, R. L., Raiffa, H., 1993. Decisions with multiple
objectives, second ed. Cambridge University Press.
McConnell, S., 2001. An ounce of prevention. IEEE
Software Vol.18.
Murdoch, J., Hardy, D., 2000. Open systems architecting
U.S. DoD open systems – joint task force. 3
rd
Annual
Systems Engineering & Supportability Conference.
Purewal, K., Yang, L., Grigg, A., 2009. Quantitative
assessment of systems architecture using evidential
reasoning. 7
th
Annual Conference on Systems
Engineering Research.
Saaty, T.L., 1977. A scaling method for priorities in
hierarch structures. Journal of Mathematical
Psychology 15(3):234-281.
Saaty, T. L., 1988. The analytic hierarchy process.
University of Pittsburgh.
Saaty, T. L., 1994. Fundamentals of decision making with
the analytic hierarchy process. USA:RWS
Publications.
Shafer, G., 1976. A mathematical theory of evidence.
Princeton: Princeton University Press.
SEI-CMU 2008. Carnegie Mellon University. CMU
architecture-based languages and environments
project. Available online at
http://www.cs.cmu.edu/~acme/
Wang, Y. M., Yang, J. B., Xu, D. L., Chin, K. S., 2006.
The evidential reasoning approach for multiple
attribute decision analysis using interval belief
degrees. European Journal of Operational Research
175(1): 35-66.
Xu, L., Yang, J. B., 2001. Introduction to multi-criteria
decision making and the evidential reasoning
approach. Working Paper No. 0105, Manchester
School of Management, ISBN 1 86115111 X.
Xu, D. L., Yang, J. B., Wang, Y. M., 2006. The ER
approach for multi-attribute decision analysis under
interval uncertainties. European Journal of
Operational Research 174(3): 1914-1943.
Yang, J. B., 2001. Rule and utility based evidential
reasoning approach for multiple attribute decision
analysis under uncertainty. European Journal of
Operational Research 131 (1), 31-61.
Yang, J. B., Deng, M., Xu, D. L., 2001. Nonlinear
regression to estimate both weights and utilities via
evidential reasoning for MADM. In:Processings of the
5
th
International Conference on Optimisation:
Techniques and Applications, Hong Kong.
Yang, J. B., Wang, Y. M., Xu, D. L., Chin, K. S., 2006.
The evidential reasoning approach for MADA under
both probabilistic and fuzzy uncertainties. European
Journal of Operational Research, 171, 309-343.
Yang, J. B., Sen, P., 1994. A general multi-level
evaluation process for hybrid MADM with
EXPLORATION OF QUANTITATIVE ASSESSMENT IN SYSTEMS ARCHITECTURE USING EVIDENTIAL
REASONING
151

uncertainty. IEEE Transactions on Systems, Man, and
Cybernetics 24 (10), 1458-1473.
Yang, J. B., Singh, M. G., 1994. An evidential reasoning
approach for multiple attribute decision making with
uncertainty. IEEE Transactions on Systems, Man, and
Cybernetics Part A: Systems and Humans 32(3), 289-
304.
Yang, J. B., Xu, D. L., 2002a. On the evidential reasoning
algorithm for multiattribute decision analysis under
uncertainty. IEEE Transactions on Systems, Man, and
Cybernetics Part A: Systems and Humans 32(3): 289-
304.
Yang, J. B., Xu, D. L., 2002b. Nonlinear information
aggregation via evidential reasoning in multiattribute
decision analysis under uncertainty. IEEE
Transactions on Systems, Man, and Cybernetics Part
A: Systems and Humans 32(3): 376-393.
ICEC 2010 - International Conference on Evolutionary Computation
152
