
PCF: PROJECTION-BASED COLLABORATIVE FILTERING
Ibrahim Yakut, Huseyin Polat
Computer Engineering Department, Anadolu University, 26470 Eskisehir, Turkey
Mehmet Koc
Electrical and Electronics Engineering Department, Anadolu University, 26470 Eskisehir, Turkey
Keywords:
Collaborative filtering, e-Commerce, projection, Scalability and Accuracy.
Abstract:
Collaborative filtering (CF) systems are effective solutions for information overload problem while contribut-
ing web personalization. Different memory-based algorithms operating over entire data set have been utilized
for CF purposes. However, they suffer from scalability, sparsity, and cold start problems. In this study, in order
to overcome such problems, we propose a new approach based on projection matrix resulted from principal
component analysis (PCA). We analyze the proposed scheme computationally; and show that it guarantees
scalability while getting rid of sparsity and cold start problems. To evaluate the overall performance of the
scheme, we perform experiments using two well-known real data sets. The results demonstrate that our scheme
is able to provide accurate predictions efficiently. After analyzing the outcomes, we present some suggestions.
1 INTRODUCTION
Collaborative filtering (CF) methods have been pro-
posed to overcome information overload problem
caused by the huge amount of data available on
the Internet. CF systems facilitate web personaliza-
tion needed by e-commerce companies (Riedl, 2001).
Such systems support responding for items whose
contents cannot be easily analyzed by computational
processes (Herlocker et al., 1999).
CF schemes first collect customers’ preferences.
They then construct an n×m user-item matrix includ-
ing users’ ratings, where n and m represent number
of users and items, respectively. Then, when an ac-
tive user (a) who is looking for a recommendation
for a target item (q) asks a prediction (p
aq
) from an
e-commerce site utilizing CF systems, a’s neighbor-
hood is formed. Finally, the weighted average of her
neighbors’ ratings of q is then presented as a referral.
Active users who seek predictions for target items,
which they think to buy or taste, request recommen-
dations from CF systems. Besides providing referrals
for single items called prediction, such schemes also
produce a list of items that might be liked by active
users called top-N recommendation.
Conventional memory-based schemes operate
over the entire user database, where entire process
is conducted online; and that causes scalability prob-
lems in commercial recommender systems. Online
computation time exponentially increases with in-
creasing n and/or m. Furthermore, they are directly
affected by sparse data. Finally, they suffer from cold
start problem in which available data are not enough
to produce predictions. This happens especially in the
new established e-commerce companies. Such ven-
dors are not able to offer referrals at all because in
memory-based schemes, there must be enough com-
monly rated products between users and sufficient
ratings for target items to estimate referrals. There-
fore, the coverage is very low. To resolve such prob-
lems or overcome the shortcomings of memory-based
approaches, model-based techniques have been pro-
posed (Su and Khoshgoftaar, 2009).
In this study, we propose a model-based approach
using principal component analysis (PCA). The pro-
posed method is a solution for such limitations that
memory-based approaches have. It can overcome the
scalability problem by performingCF tasks off-line as
much as possible. Sparsity problem can be resolved
by filling the empty cells with non-personalizedvotes.
So, even if there is a limited number of users’ data, the
proposed scheme can offer predictions for all items.
408
Yakut I., Polat H. and Koc M..
PCF: PROJECTION-BASED COLLABORATIVE FILTERING.
DOI: 10.5220/0003071204080413
In Proceedings of the International Conference on Knowledge Discovery and Information Retrieval (KDIR-2010), pages 408-413
ISBN: 978-989-8425-28-7
Copyright
c
2010 SCITEPRESS (Science and Technology Publications, Lda.)

2 RELATED WORKS
”Collaborative filtering” concept first appeared in
the Tapestry recommender system (Goldberg et al.,
1992). Herlocker et al. (Herlocker et al., 1999)
present an algorithmic framework for performing CF
and evaluate the memory-based algorithms experi-
mentally. Su and Khoshgoftaar (Su and Khoshgof-
taar, 2009) present a detailed survey about CF con-
sisting of its background, proposed algorithms, and
their contributions and limitations.
To solve scalability and sparsity issues in
memory-based systems, many model-based algo-
rithms have been proposed. In some of such model-
based schemes, dimensionality reduction techniques
have already been applied (Goldberg et al., 2001;
Honda et al., 2001; Kim and Yum, 2005; Russell
and Yoon, 2008; Sarwar et al., 2000). Goldberg et
al. (Goldberg et al., 2001) propose a model-based al-
gorithm called Eigentaste in which items are grouped
into gauge and non-gauge sets. Gauge set is abso-
lutely dense part collected ratings for the same items
from users via universal queries applied all the users
before the prediction generation. It is then reduced in
dimensionality by PCA and users are clustered based
on the reduced data. Our scheme is different from
Eigentaste because our method does not require any
universal query or dense gauge set, which may not be
always feasible in practice.
Honda et al. (Honda et al., 2001) uses PCA with
fuzzy clustering for CF tasks. Their simultaneous
approach uses incomplete data set including missing
values, which are predicted using the approximation
of the data matrix. Although they utilize clustering in
their scheme, we apply PCA only to obtain projection
matrix. Kim and Yum (Kim and Yum, 2005) propose
a scheme that utilizes both singular value decompo-
sition (SVD) and PCA. They fill the missing entries
with SVD and perform iterative PCA for generating
predictions. Although the accuracy of the recommen-
dations generated using their scheme is better, itera-
tive PCA, clustering a, and computing p
aq
are con-
ducted online. Thus, online process time of the al-
gorithm is costly. Unlike their scheme, our scheme
determines a projection matrix off-line, which is then
used to produce referrals online.
Russell and Yoon (Russell and Yoon, 2008) apply
discrete wavelet transformation(DWT) to CF systems
to improve performance. Sarwar et al. (Sarwar et al.,
2000) propose an SVD-based scheme to overcome the
problems that memory-based schemes face. Their ap-
proach is an effective solution; however, a must be
in the generated model as one of the users. Thus,
predictions cannot be generated before the model is
updated; and the model construction is too costly for
online response immediately. If a recommendation
should be generated for a new user, the model must
be updated, which costly. In our scheme, a does not
need to participate in the prediction model. Therefore,
our scheme can response to any new comer.
3 PCA-BASED COLLABORATIVE
FILTERING
Our method includes both off-line and online compu-
tations. During off-line phase, a model is constructed
using PCA. In online recommendation process, p
aq
is
estimated from the projection matrix of user-item ma-
trix and a’s ratings vector. PCA is a dimensionality
reduction technique that can be widely used in sig-
nal processing applications (Zhang et al., 2001) and
pattern recognition (Gunal et al., 2005). Obtaining
eigenvalues and eigenvectors of covariance matrices
for normal distributions is also known as Karhunen-
Loeve transforms (KLT). PCA is a special case of
KLT subspace analysis. KLT is very effective to find
the best representation of a given data set using min-
imum number of basis vectors (Gunal et al., 2005).
It is also known as the optimal linear dimensional-
ity reduction (Bishop, 1996). PCA is a multivariate
procedure rotating the data such that maximum vari-
abilities are projected onto the axes. Essentially, a set
of correlated variables are transformed into a set of
uncorrelated variables, which are ordered by reduc-
ing variability. The uncorrelated variables are linear
combinations of the original variables, and the last of
these variables can be removed with minimum loss
of real data. Our goal here is to transform the given
data set x
i
= (x
1i
, x
2i
, . . . , x
mi
) for i = 1, 2, . . . , n into
z
i
= (z
1i
, z
2i
, . . . , z
ki
) for i = 1, 2, . . . , n, where k < m.
To do so, covariance matrix (C) of the data must be
obtained, as follows:
C =
n
∑
i=1
(x
i
−
¯
x)((x
i
−
¯
x))
T
, (1)
where
¯
x
i
=
1
n
∑
n
j=1
x
i
. After determining C, its eigen-
values (λ
1
> λ
2
> . . . > λ
m
) and the correspond-
ing eigenvectors (e
1
, e
2
, . . . , e
m
) are calculated. Since
span of {e
1
, e
2
, . . . , e
m
} is R
m
, x
i
=
∑
m
j=1
z
j
e
T
j
for i =
1, 2, . . . , n, where z
j
= x
i
e
T
j
. In the dimension reduc-
tion phase, since there is information loss, as much
information as possible must be saved. To achieve
this, the eigenvectors corresponding to the largest k
eigenvalues should be used, as follows:
ˆ
x
i
=
k
∑
j=1
z
j
e
j
=
k
∑
j=1
(x
i
e
T
j
)e
j
=
k
∑
j=1
(e
j
e
T
j
)x
i
= Px
i
(2)
PCF: PROJECTION-BASED COLLABORATIVE FILTERING
409

for i = 1, 2, . . . , n, where P =
∑
k
j=1
e
j
e
T
j
. Selection of
the eigenvectors minimizes the error kx
i
−
ˆ
x
i
k. k must
be chosen so that the sum of the first largest k eigen-
values is greater than some fixed percentage θ, as fol-
lows (Oja, 1983):
∑
k
i=1
λ
i
∑
m
i=1
λ
i
> θ. (3)
3.1 Our Method
Ratings for various items collected from many users
are used in CF tasks. Suppose that A is an n × m ma-
trix including n users’ votes for m items, where there
are n rows and m columns. To work with PCA prop-
erly, there should not be any cells with null values in
A. However, A is not fully dense due to the nature of
collection of taste information. Given an entire items
set, customers usually rate a limited number of them;
that leads to very sparse set. The convenient way to
obtain a dense data set is to fill the empty cells with
non-personalized or default votes (v
d
s). We propose
to use row (user) mean, column (item) mean, or dis-
tribution of users’ ratings to determine v
d
s.
Each user can be considered as a feature vector.
After filling the sparse feature vectors with v
d
s, the re-
sulting dense data matrix is normalized by subtracting
the corresponding row averages from each element of
matching feature vectors. At the end of normaliza-
tion, normalized data matrix (
˜
A) is obtained. Then,
the covariance matrix C is computed, as follows:
C =
1
n− 1
˜
A
T
˜
A. (4)
After performing PCA of C, eigenpairs (λ
i
and e
i
)
for i = 1, 2, . . . , m are obtained. P, which is an m× m
matrix, is constructed, as follows:
P =
k
∑
i=1
e
i
e
T
i
, (5)
where e
1
, e
2
, . . . , e
k
are the eigenvectors correspond-
ing to the largest k eigenvalues. Determining the best
value of k is a key to the success of our scheme. Thus,
we focus on the percentage of information kept by
each eigenvalue.
The fixed percentage value (θ) described previ-
ously is used to select eigenvectors. Note that θ repre-
sents the percentage of variance kept by the selected
eigenvectors from the first to the kth one. Since its
value is important and can affect our results, we also
experimentally test how varying θ values affect the
overall performance of our proposed scheme. Once
P is constructed, the predictive model is obtained.
Aforesaid processes discussed so far are performed
off-line. The output of such computations is the
model or P, which is used for providing CF tasks on-
line. Unlike online costs, note that off-line costs are
not critical for overall performances. Online phase
can described, as follows:
1. An active user a sends her known ratings and a
query (for which item (q) she is looking for pre-
diction) to the CF system.
2. The scheme first preprocess her ratings vector by
filling the empty cells with v
d
s, as explained pre-
viously.
3. The preprocessed filled ratings vector called a and
P then are used to estimate p
aq
, as follows:
p
aq
= a· P(q), (6)
where P(q) is the q
th
column of P and · is the
scalar dot product.
In addition to Eq.(6), p
aq
can be estimated using
a’s normalized ratings vectors, as follows:
p
aq
= v
a
+ ˜a· P(q), (7)
where ˜a includes normalized ratings using deviation
from mean approach and v
a
is the mean rating of a’s
ratings.
3.2 Analysis of the Proposed Scheme
We analyze the proposed method in terms of accuracy,
coverage, and communication, storage, and compu-
tation costs. Since off-line costs are not critical for
overall performance, we scrutinize our method’s on-
line costs. In order to assess the scheme in view of
preciseness, we perform various experiments using
well-known real data sets explained in the following
section.
In traditional memory-based schemes, there
should be enough commonly rated items between
users and sufficient ratings for q in order to produce
predictions. When this is not the case, online ven-
dors, especially the newly established ones, face with
coverage and/or cold start problem. We claim that
our proposed method responds each request without
such problems. Since P can be constructed without
common item requirements in similarity calculations
and generating prediction in conventional CF meth-
ods, any request can be addressed. Therefore, it is
expected to reply for any request of prediction by any
active user a. Moreover, P can be updated in particu-
lar periods with respect to the number of joined new
users and recently released items.
Like in other CF schemes, since a asks a referral
and the system returns a result, number of commu-
nications is two only. Similarly, amount of data to
KDIR 2010 - International Conference on Knowledge Discovery and Information Retrieval
410
be transferred is also same as in the similar CF al-
gorithms. A vector including ratings is sent to the
CF system; and a value is returned. Thus, in terms
of online communication costs (number of commu-
nications and amount of data to be sent), our scheme
achieves the same performancewith other algorithms.
Storage cost is in the order of O(nm) because the sys-
tem stores n users’ ratings for m items. This cost is
also same with the similar CF algorithms. The only
additional storage cost is due to saving v
d
s, which are
determined off-line to improve online performance.
They are used to fill a’s empty cells. They are saved
in a 1× m vector. Hence, supplementary storage cost
is in the order of O(m). Compared to O(nm), where n
is large, this extra storage cost is negligible. It can be
considered as adding a new user to the database.
In CF applications, online computation time is
critical. In our method, only one scalar dot product is
conducted between two vectors with length m during
online phase. In other words, m multiplications and
m − 1 summations are performed online for produc-
ing each prediction. Since online computation time
is in the order of O(m), we can say that our scheme
responds each query in linear time. The online cost
depends on m. In e-commerce applications, the in-
crease in n is much more larger than the increase in m.
Therefore, scalability problems are generally caused
by the increase in the number of users. Due to these
facts, our method scales practically in CF applications
and it is an efficient solution to resolve scalability
problems.
4 EXPERIMENTS
To show whether the proposed scheme provides ac-
curate predictions or not, we performed experiments
using two well-known real data sets. We conducted
trials using Jester and MovieLens Public (MLP) data
sets. Jester (Goldberg et al., 2001) is a web-based
joke recommendation system. It has 100 jokes and
records of 73,421 users. Almost 56% of all possible
ratings are present. Thus, it is a very dense set. The
ratings range from -10 to +10, and the scale is contin-
uous. MLP was collected by the GroupLens Research
Project at the University of Minnesota (web, ). Each
user has rated at least 20 movies, and ratings are made
on a 5-star scale. It consists of 100,000 ratings for
1,682 movies made by 943 users.
As evaluation criteria, we chose the Mean Abso-
lute Error (MAE) and the Normalized Mean Abso-
lute Error (NMAE) (Goldberg et al., 2001). They
are the most common criteria for CF. The MAE is a
measure of the deviation of recommendations from
their true user-specified values (Sarwar et al., 1998).
The MAE is normalized by dividingthe difference be-
tween the maximum and the minimum ratings so that
the NMAE can be obtained. The lower the MAE and
the NMAE, the more accurate our results are. There-
fore, they should be minimized.
We divided data sets into two disjoint sets: train-
ing and testing. Training data are used to create the
P and we determined the amount of training data ac-
cording to different experiment settings. In each ex-
periment, we uniformly randomly selected 100 dif-
ferent users from Jester and MLP for testing. Sim-
ilarly, five ratings were uniformly randomly chosen
from available ratings of each test user. For each test
item, we withheld their given ratings and tried to pre-
dict their values given all other votes using our pro-
posed scheme. We compared the predictions that we
found based on our method with the withheld votes.
Since train and test sets were determined randomly,
we ran our experiments 100 times by using different
train test sets. After calculating overall averages of
the MAE and NMAE values, we displayed them.
We first performed trials to show how the quality
of the referrals changes with varying θ values. Re-
member that the value of k is determined based on θ.
Thus, its value affects accuracy. We used Jester and
MLP in these trials. We randomly selected 800 and
1,000 users’ data for training from MLP and Jester,
respectively. We varied θ values from 1 to 100. To
fill empty cells, we used row mean votes as v
d
s; and
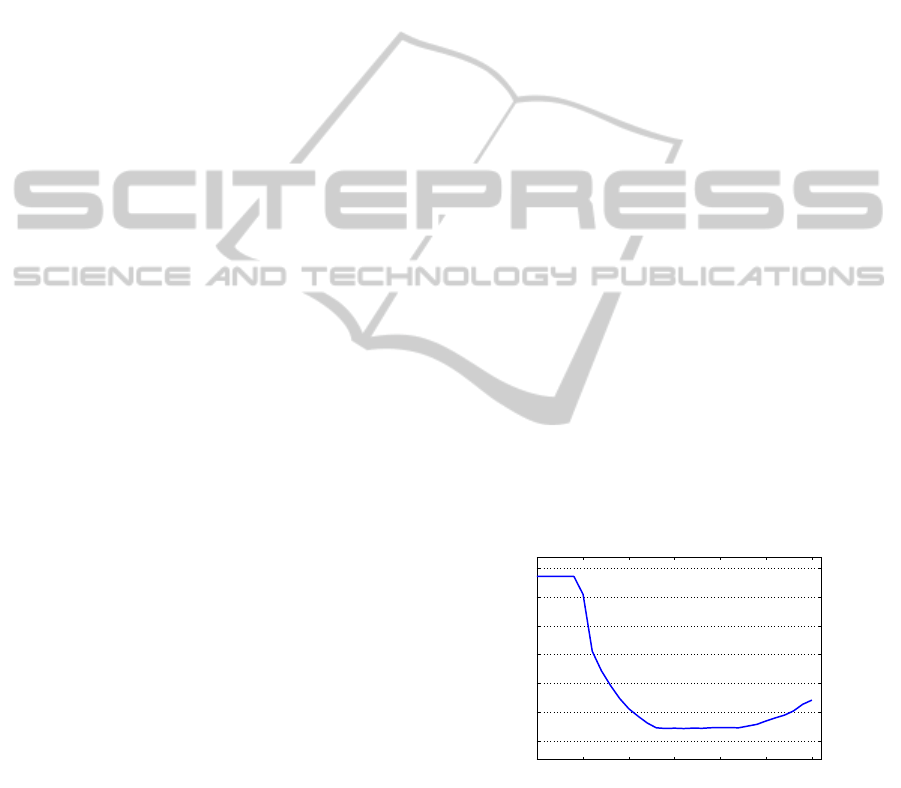
utilized Eq.(6) to estimate predictions. We displayed
the MAEs for MLP and Jester in Fig. 1 and Fig. 2,
respectively.
70 75 80 85 90 95 100
0.8
0.82
0.84
0.86
0.88
0.9
0.92
θ Values
MAEs
Figure 1: Accuracy vs. θ (MLP data set).
As seen from Fig. 1, the best results are obtained
when θ is 86 for MLP, where the MAE is 0.808. We
obtained the similar results for θ values ranging from
83 to 92. For MLP, since the energy in the first prin-
cipal component is 75% of the total energy kept by
all the train data, the MAE is the same for θ values
from 0 to 74, where the results are the worst due to
insufficient information. Accuracy significantly im-
PCF: PROJECTION-BASED COLLABORATIVE FILTERING
411
proves with varying θ values from 74 to 83. While it
is proper to select any θ value from 83 to 92 for bet-
ter accuracy, it is preferable to set it at 83 for off-line
computational efficiency. Since k is 32 for θ = 83 and
it is 132 for θ = 92 in Eq. (5), quarter of train data
produces the sam e accuracy. For values of θ larger
than 92, accuracy is getting worse due to uncorrelated
information (noise and/or redundancy).
30 40 50 60 70 80 90 100
3.35
3.4
3.45
3.5
3.55
3.6
3.65
3.7
3.75
3.8
θ Values
MAEs
Figure 2: Accuracy vs. θ (Jester data set).
For Jester, as seen from Fig. 2, since 38% of the
total energy is concentrated in the first principal com-
ponent, the MAEs do not change significantly up to
θ = 38. The best MAE value, which is 3.361, is
obtained when θ is 57. In other words, this value
corresponds to k being 9 in Eq. (5). The scheme
achieves better results for Jester than the scheme pro-
posed in (Goldberg et al., 2001). Compared to the
results in (Goldberg et al., 2001), the improvement
is about 11.3% for jester. Accuracy becomes better
with increasing θ values from 38 to 57. However, as
seen from Fig. 2, MAEs become worse for values of
θ larger than 57. For MLP and Jester, the best NMAE
values are 0.202 and 0.168, respectively.
50 100 200 400 800
0.8
0.82
0.84
0.86
0.88
0.9
0.92
0.94
0.96
0.98
n
MAEs
Figure 3: Accuracy vs. n (MLP data set).
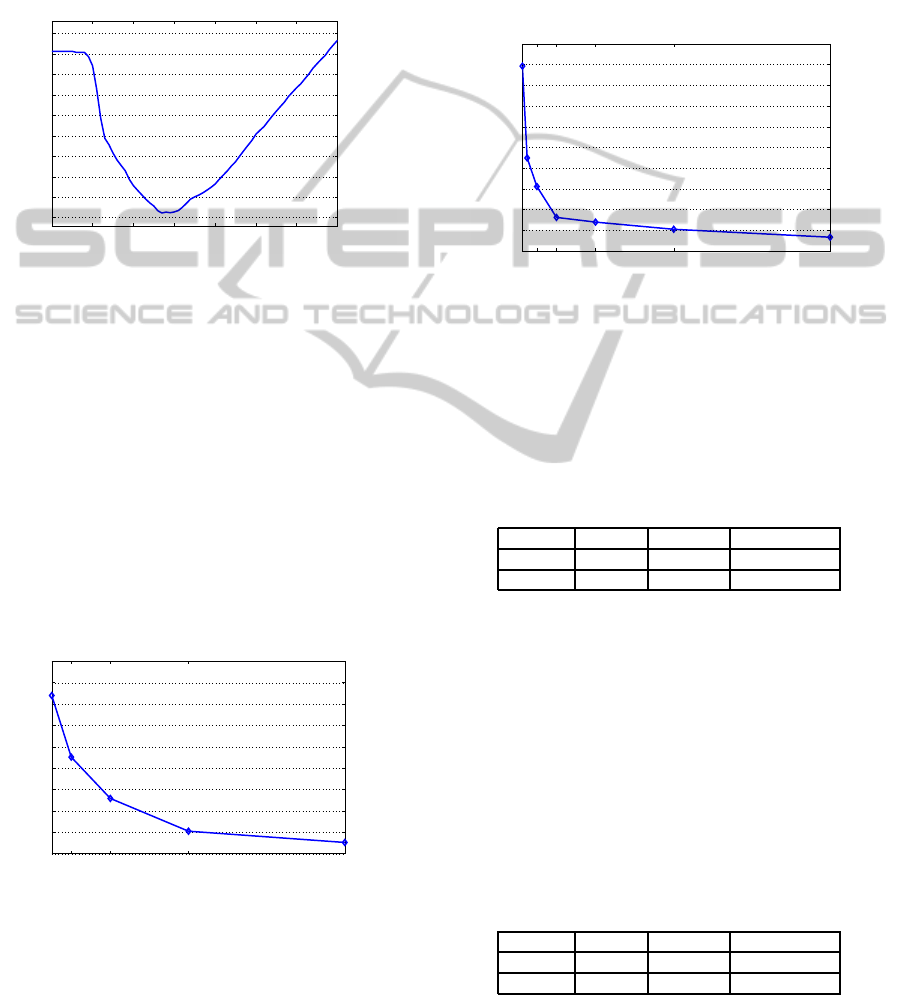
We also conducted trials to observe accuracy
changes with varying n values for both data sets. We
set θ at its optimum values determined for both data
sets previously. We used row mean votes to fill empty
cells and utilized Eq. (6) to compute referrals. We var-
ied n from 50 to 800 for MLP while changed it from
64 to 4,000 for Jester. After computing overall aver-
ages, we displayed them in Fig. 3 and in Fig. 4 for
MLP and Jester, respectively.
As seen from Fig. 3, accuracy improves with in-
creasing n values and then becomes stable. For n val-
ues larger than 400, the MAE gradually converges to
0.808 for MLP. However, accuracy significantly en-
hances with increasing n values from 50 to 400. Our
results are still promising for n is greater than 400.
64 250 500 1,000 2,000 4,000
3.3
3.35
3.4
3.45
3.5
3.55
3.6
3.65
3.7
3.75
3.8
n
MAEs
Figure 4: Accuracy vs. n (Jester data set).
Similar trends occur for Jester as seen from Fig. 4.
With increasing n values from 64 to 500, MAEs sig-
nificantly improve. For n values larger than 500, ac-
curacy gradually improves and becomes stable. Al-
though the best results are obtained when n is 4,000,
the outcomes are still promising when n is 1,000.
Table 1: Accuracy vs. Different v
d
s (MLP Data Set).
v
d
Row Column Distribution
MAE 0.8089 1.1935 0.9377
NMAE 0.2022 0.2983 0.2344
We then performed trials to show how different
non-personalized rating computation methods affect
accuracy. We proposed to use row or column mean,
or user’s ratings’ distribution to determine v
d
s. We
ran experiments using both data sets while setting θ
at its optimum values. For MLP and Jester, we used
800 and 1,000 randomly chosen users’ data for train-
ing, where we used Eq. (6) to compute referrals. After
running the trials 100 times, we computed overall av-
erages and displayed them in Table 1 and Table 2 for
MLP and Jester, respectively.
Table 2: Accuracy vs. Different v
d
s (Jester Data Set).
v
d
Row Column Distribution
MAE 3.3610 3.5793 3.6321
NMAE 0.1681 0.1789 0.1816
As seen from Table 1 and Table 2, the row mean
approach outputs the best results for both data sets.
KDIR 2010 - International Conference on Knowledge Discovery and Information Retrieval
412

The worst results are obtained for column mean
method. Thus, the row mean votes should be used
to fill empty cells.
We finally conductedexperimentsto scrutinize the
two methods to estimate predictions. We again used
both data sets while randomly chosen 800 and 1,000
users from MLP and Jester, respectivelywere used for
training. We utilized the values and/or methods that
give the best results. We displayed the outcomes in
Table 3.
Table 3: Accuracy vs. different algorithms.
MLP Jester
Algorithm Eq. (6) Eq. (7) Eq. (6) Eq. (7)
MAE 0.8089 0.7953 3.3610 3.3704
NMAE 0.2022 0.1988 0.1681 0.1685
As seen from Table 3, the algorithms almost
achieve the same results for Jester. However, using
Eq. (7) for prediction generation slightly makes accu-
racy better for MLP.
5 CONCLUSIONS AND FUTURE
WORK
We have presented a model-based scheme to provide
predictions in linear time with ensuring decent accu-
racy. We have shown that our scheme is scalable and
guarantees coverage. Increasing n values do not af-
fect our method’s online performance. We have per-
formed real data-based experiments. Our scheme pro-
duces better referrals than Eigentaste (Goldberg et al.,
2001). It also achieves comparable results with the
scheme explained in (Sarwar et al., 2000).
We are planning to investigate how to improve the
accuracy of our scheme. Our scheme can be enhanced
with some supporting algorithms like clustering, pre-
processing, and so on. We will study whether it is
possible to offer top-N recommendation from the pro-
posed framework. One important issue that should
be addressed is the applicability of our scheme to bi-
nary data. Finally, considering the increase in web
users’ privacy concerns, we will also study providing
recommendations using the proposed algorithm while
preserving users’ privacy.
ACKNOWLEDGEMENTS
This work was partially supported by the Grant
108E221 from TUBITAK.
REFERENCES
www.cs.umn.edu/research/Grouplens.
Bishop, C. M. (1996). Neural Networks for Pattern Recog-
nition, pages 310–314 and 318–319. Aston Univer-
sity, Birmingham, UK.
Goldberg, D., Nichols, D., Oki, B. M., and Terry, D. (1992).
Using collaborative filtering to weave an Information
Tapestry. Communications of ACM, 35(12):61–70.
Goldberg, K., Roeder, T., Gupta, D., and Perkins, C. (2001).
Eigentaste: A constant time collaborative filtering al-
gorithm. Information Retrieval, 4(2):133–151.
Gunal, S., Ergin, S., and Gerek, O. N. (2005). Spam e-
mail recognition by subspace analysis. In Proceedings
of INISTA-International Symposium on Innovations in
Intelligent Systems and Applications, pages 307–310,
Istanbul, Turkey.
Herlocker, J. L., Konstan, J. A., Borchers, A., and Riedl,
J. T. (1999). An algorithmic framework for per-
forming collaborative filtering. In Proceedings of the
22nd Annual International ACM SIGIR Conference on
Research and Development in Information Retrieval,
pages 230–237, Berkeley, CA, USA.
Honda, K., Sugiura, N., Ichihashi, H., and Araki, S.
(2001). Collaborative filtering using principal com-
ponent analysis and fuzzy clustering. Lecture Notes
in Computer Science, 2198:394–402.
Kim, D. and Yum, B. J. (2005). Collaborative filtering based
on iterative principal component analysis. Expert sys-
tems with Applications, 28(4):823–830.
Oja, E. (1983). Subspace Methods of Pattern Recognition.
John Wiley and Sons Inc., New York, USA.
Riedl, J. T. (2001). Guest editor’s introduction: Personaliza-
tion and privacy. IEEE Internet Computing, 5(6):29–
31.
Russell, S. and Yoon, V. (2008). Applications of wavelet
data reduction in a recommender system. Expert Sys-
tems with Applications, 34(4):2316–2325.
Sarwar, B. M., Karypis, G., Konstan, J. A., and Riedl, J. T.
(2000). Application of dimensionality reduction in
recommender system–A case study. In Proceedings of
the ACM WebKDD 2000 Web Mining for E-commerce
Workshop, pages 682–693, Boston, MA, USA.
Sarwar, B. M., Konstan, J. A., Borchers, A., Herlocker,
J. L., Miller, B. N., and Riedl, J. T. (1998). Using
filtering agents to improve prediction quality in the
GroupLens research collaborative filtering system. In
Proceedings of the 1998 ACM Conference on Com-
puter Supported Cooperative Work, pages 345–354,
Seattle, WA, USA.
Su, X. and Khoshgoftaar, T. M. (2009). A survey of col-
laborative filtering techniques. Advances in Artificial
Intelligence, 2009:1–20.
Zhang, B., Fu, M., and Yan, H. (2001). A nonlinear neu-
ral network model of mixture of local principal com-
ponent analysis: Application to handwritten digits
recognition. Pattern Recognition, 34:203–214.
PCF: PROJECTION-BASED COLLABORATIVE FILTERING
413
