
OPTIMIZATION OF A STEAM TURBINE GUIDE VANE BY END
WALL CONTOURING USING EVOLUTIONARY ALGORITHMS
Nils Moser and Franz Joos
Power Engineering, Laboratory of Turbomachinery, Helmut-Schmidt-University
University of the Federal Armed Forces Hamburg
Holstenhofweg 85, D-22043, Hamburg, Germany
Keywords: CFD, Control stage, Evolutionary algorithm, Guide vane, Optimization, Steam, Turbine.
Abstract: The subject of this paper is the optimization of a guide vane of steam turbine control stage by end wall
contouring. The investigated control stage is derived from an existing industrial steam turbine design. The
end wall contour is varied in rotational direction within specified restrictions by an evolutionary algorithm.
The algorithm is directly connected to a mesh generator and a Computational Fluid Dynamics (CFD) solver.
The optimization goal is the reduction of the total pressure loss over the guide vane. The geometry of the
rotor blade has been retained unchanged. The flow field of the varied stage is compared with the baseline
geometry. The optimum candidates are further investigated with CFD simulations for different operating
point scenarios. Numerical results show that the axisymetric end wall contouring of the nozzle has a
considerable effect on the loss behavior of the nozzle over a wide range of pressure ratios. Due to end wall
contouring the boundary layer in the nozzle is significantly affected which results in a significant reduction
of the secondary flow effects in the guide vanes.
1 NOMENCLATURE
nozzle chord
number of individual
isentropic coefficient of air
static pressure at guide vane outlet
,
total pressure at guide vane inlet
,
total pressure at guide vane outlet
pressure ratio
,
shroud radius of shroud point i
∗
transformed coordinates
,
max. shroud radius
,
min. shroud radius
hub radius
2 INTRODUCTION
Secondary losses, in addition to profile losses, are
one of the most important loss mechanisms in turbo
machines. Their influence emerges in particular at
blade profiles with high aerodynamic loads, high
pressure ratio, high flow velocity and low aspect
ratio. Secondary loss can constitute up to 30% of the
overall loss. The effect of secondary flows has been
intensively investigated by Langston (2001),
Sieverding (1985) and Gregory-Smith (1997). Dejc
and Zarjankin (1960) have shown that secondary
losses and boundary layer effects can be reduced by
an axisymetric end wall contour. They used a cubic
function to define the end wall contour. Moustapha
and Williamson (1985) investigated rotational
constrictions in the meridian plane. They asserted
that a streamwise downward constriction exhibits a
lower loss than a linear constriction. Rose (1994)
achieved a significant influence of the static pressure
at the profiled wall by a three-dimensional
contouring of a high pressure gas turbine. Harvey,
Rose, Taylor, Shapar, Hartland and Gregory-Smith
(2000) examined a 3D hub contour of a turbine. The
contour was described with a divergence from the
reference contour at six axial positions in
circumferential direction by a Fourier function. The
static pressure distribution at the hub surface and the
exit flow angle variation were selected as
optimization target. Harvey et al. asserted the
passage vortex and the overall losses were reduced
by the 3D profiled hub. Furthermore, they
discovered a new vortex near the hub. Experiments
327
Moser N. and Joos F..
OPTIMIZATION OF A STEAM TURBINE GUIDE VANE BY END WALL CONTOURING USING EVOLUTIONARY ALGORITHMS.
DOI: 10.5220/0003074603270331
In Proceedings of the International Conference on Evolutionary Computation (ICEC-2010), pages 327-331
ISBN: 978-989-8425-31-7
Copyright
c
2010 SCITEPRESS (Science and Technology Publications, Lda.)
by Hartland, Gregory-Smith, Harvey and Rose
(2000) validated these results. Eymann, Foersterm
Beversdorff, Reinmoeller, Niehuis and Gier (2002)
experimentally investigated an axisymmetric end
wall contour simultaneous with a blade profile
optimization in the first stage of a gas turbine. They
asserted that the vortex system behind the first guide
vane was dislocated near the end walls.
Additionally, Eymann observed a reduction of the
passage and the trailing edge vortex as a result of the
optimization.
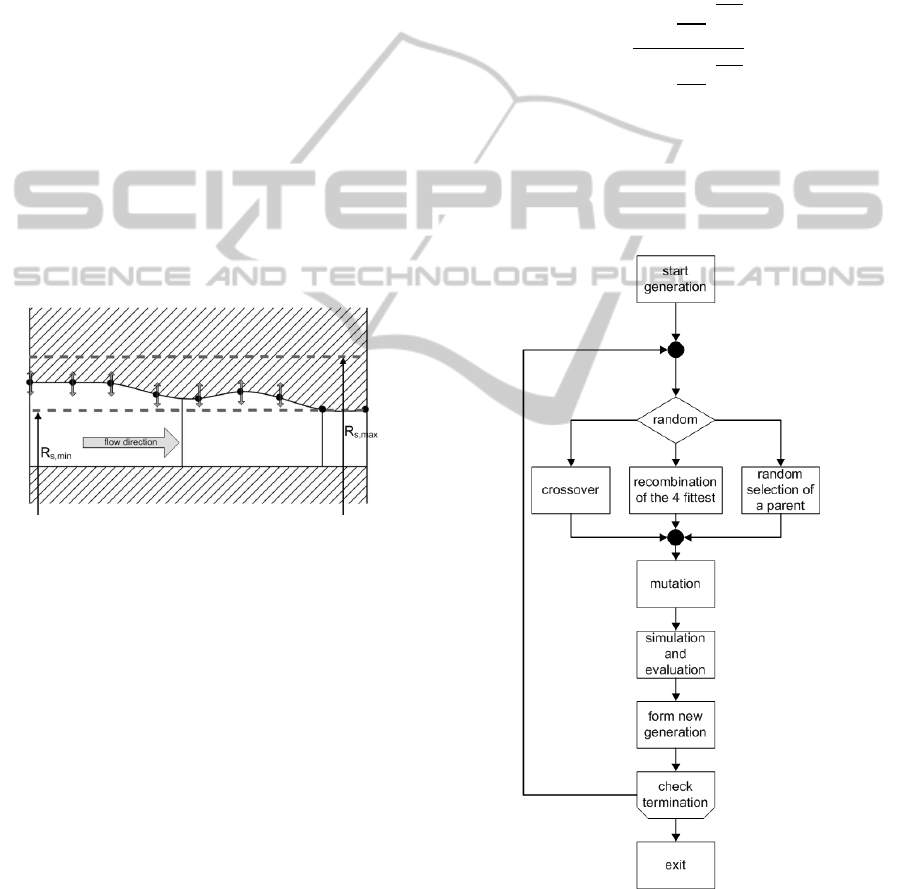
3 GEOMETRY RESTRICTION
The control stage investigated is derived from an
existing industrial steam turbine design. Due to the
production process of guide vanes for control stages
of steam turbines the end wall contour has to be
axisymmetric. The shroud contour is defined by an
equidistant distribution of seven points which define
a b-spline as shown in Fig. 1.
Figure 1: Illustration of geometry restriction.
These seven points are varied in radial direction
within the following restriction of R
s
:
,
=
+0.25∗
≤
,
(1)
,
=
+0.5∗
≥
,
(2)
By virtue of undisturbed flow conditions at the
inlet and outlet of the guide vane channel the radial
shroud contour gradient equals zero. The cross
section of the outlet remains unchanged for all
geometry variants.
4 EVOLUTIONARY ALGORITHM
The optimization of the shroud contour is a complex
multi dimensional problem. The optimization
parameters are the radial positions of the seven
points, which describe the contoured shroud. Due to
the seven degrees of freedom a simple analytic
solution is not suitable. In order to achieve a
systematic optimization of the contoured end wall an
evolutionary algorithm has been used. The main loss
mechanism in guide vanes is the total pressure loss
due to secondary flow regimes. Hence the total
pressure loss of the guide vane is selected as fitness
function for the evolutionary algorithm. It is
evaluated as shown in Equation (3). The evaluated
pressure is mass flow averaged.
=1−
1−
,
1−
,
(3)
An evolutionary optimization algorithm is based
on the technique of adaption and evolution as shown
by Rechenberg (1994) and Weicker (2002). The
workflow of the used evolutionary algorithm is
shown in Fig. 2.
Figure 2: Workflow.
4.1 Evaluation of the Fitness
After gaining the geometry information for the child
ICEC 2010 - International Conference on Evolutionary Computation
328
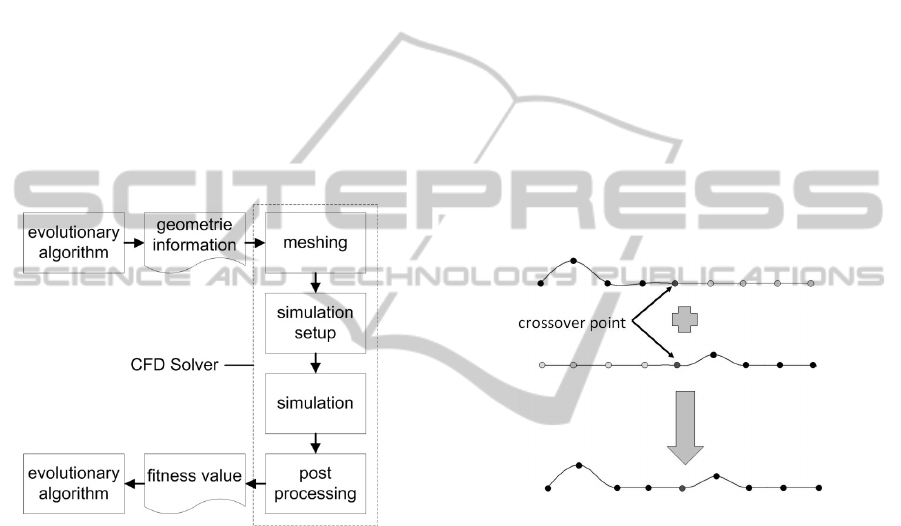
individual the pressure loss is evaluated. Due to the
influence of the end wall contouring on the
secondary flow phenomena every single individual
must be simulated by means of 3D-CFD. For this
reason the evolutionary algorithm is directly
connected to a commercial mesh generator and a
CFD solver. ANSYS CFX 11.0 is used as CFD
solver. The mesh generator creates the three-
dimensional numerical model and hands it over to
the CFD solver which simulates and evaluates every
single child individual. The numerical mesh of the
guide vane has a resolution of about 1 mio. control
volumes. The ”Shear Stress Transport Model” is
used as turbulence model. The convergence criterion
of the CFD solver is an overall residual below 10
-5
.
Figure 3 shows the scheme of the evaluation
process. One single evaluation process needs about
30 minutes.
Figure 3: Evaluation process.
After evaluating each individual, the next
generation is formed. It is based on Darwin‘s
principal ”survival of the fittest”. This means only
the fittest individual of the parent generation and the
child individuals are transferred to the next
generation. The optimization is looped until a certain
number of simulations is reached or a stagnation
over 50 loops in the optimization process is noticed.
4.2 Evolution Strategy
(μ+λ)-strategy is selected as evolutionary strategy.
This means that from μ parental individuals λ child
individuals are generated and the μ fittest of the
(μ+λ) individuals are passed onto the next
generation. Parental individuals can be transferred to
the next generation, too. One problem of this
strategy is that the algorithm tends to hang up on a
local optimum but on the other side the algorithm is
quite fast and robust. This is the reason why the
(μ+λ)-strategy is selected. Due to the fact that the
evaluation of the fitness by CFD consumes about 30
min. per individual, the number of the parental
individuals (μ) is set to 20 and the number of the
child individuals (λ) is set from 1 to 5. For the
creation of the child individuals 3 different
mechanisms are required:
simple mutation
recombination of the four fittest
crossover.
The simple mutation slightly varies the shroud
geometry of a randomly selected parental individual.
The recombination mechanism averages the shroud
geometry of the four fittest parental individuals and
mutates this average value. The crossover
mechanism crosses two randomly selected parental
individuals at a random position as shown in Fig. 4.
Afterwards this new geometry is also mutated.
Figure 4: Scheme of crossover.
4.3 Results
In the first step the operating point of the guide vane
is kept constant during optimization. The optimum
candidate is further investigated with CFD
simulations for different operating point. The design
pressure ratio over the nozzle is π = 0.5. Air is the
chosen fluid because in a further step the result will
be compared with measurements of an air turbine
test rig. The original shroud contour with a constant
shroud radius
,
=
,
is used as the reference
geometry.
In order to properly visualize the target function
of the shroud variation a multidimensional scaling is
used to project the eight-dimensional space on a
three-dimensional space. The Euclidean distances
between the individuals in the three dimensional
space are approximately calculated as a
monotonically transformation of the corresponding
dissimilarities in the eight-dimensional space. The
OPTIMIZATION OF A STEAM TURBINE GUIDE VANE BY END WALL CONTOURING USING EVOLUTIONARY
ALGORITHMS
329
transformation scheme is given in Equation (4).
,
⋮
,
∗
∗
(4)
Elements which are close to each other in the
eight-dimensional space are also close in the three-
dimensional space. As goodness-of-fit criterion for
the approximately calculated transformation the
minimum of the squared standardized residual sum
of squares (stress), normalized with the sum of
fourth powers of the dissimilarities, is used. Further
information can be found at Seber (1984), Borg and
Groenen (1997) and Backhaus, Erichson, Plinke and
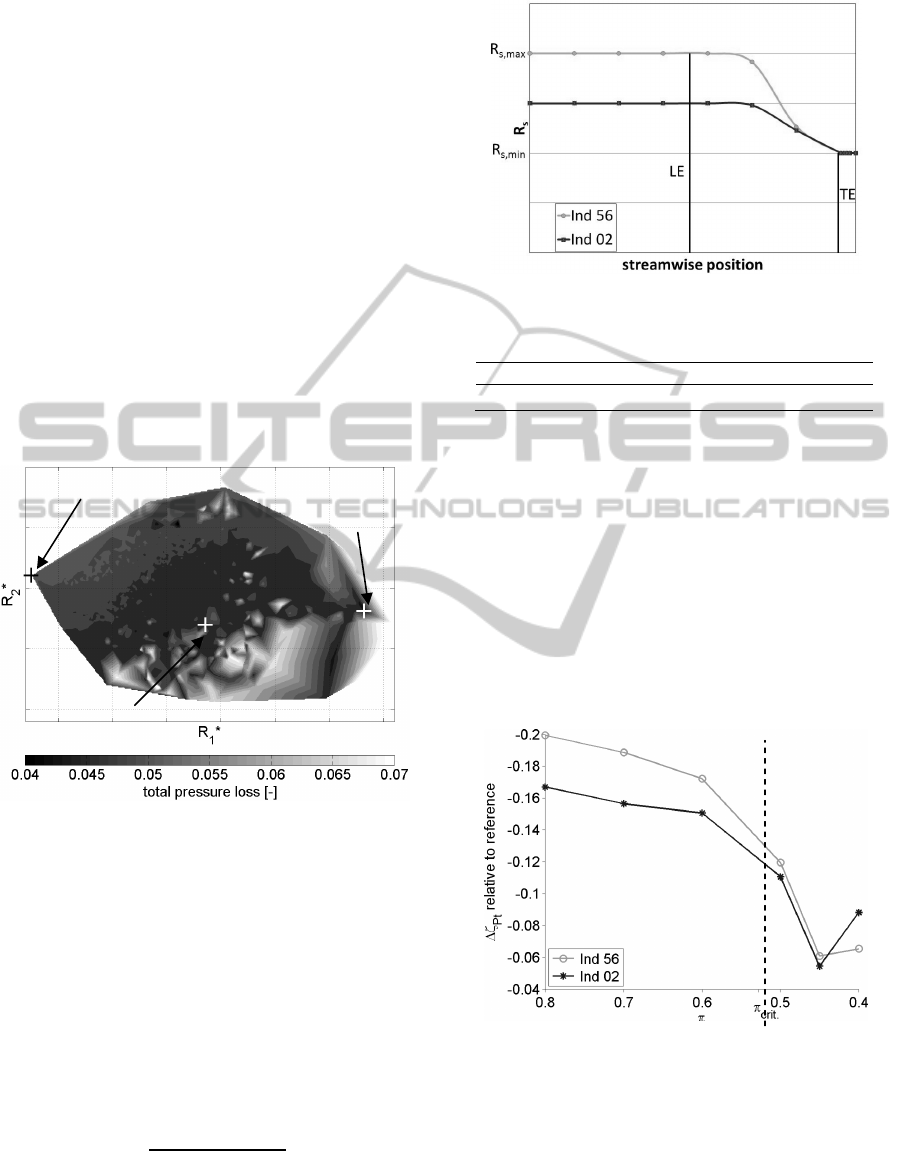
Weiber (2006). Figure 5 shows the total pressure
loss
over the transformed coordinates
∗
and
∗
.
The map was generated using the information of
over 2500 individuals.
Figure 5: Multidimensional scaling.
4.4 Guide Vane Simulation Results
For comparison a shroud contour according to Dejc
and Trojanovskij (1973) was also simulated and
evaluated (Ind 02). The optimum contour of the
evolutionary algorithm is named Ind 56. The
investigated contours are shown in Figure 6.
Table 1 shows the difference of the pressure loss
of the both end wall contours in relation to the
reference contour. It is calculated as shown in
Equation (5).
∆
,
=
,
−
,
,
(5)
Figure 6: Illustration of the investigated contours.
Table 1: Total pressure loss relative to reference.
Ind 02 Ind 56
∆
,
-0.1106 -0.1196
In a further step the three geometries are
investigated at different pressure ratios over the
nozzle. Figure 7 shows the characteristic of ∆
relative to the reference contour. The dashed line
marks the critical pressure ratio of air. It is
noteworthy that the advantage of contouring over the
straight contour increases as pressure ratio increases.
Especially at subcritical pressure ratios the total
pressure loss is reduced by end wall contouring. It
can be observed that the optimized contour has an
significant advantage over the straight and the Ind
02 contour.
Figure 7: Total pressure loss relative to reference over
pressure ratio.
5 CONCLUSIONS
A new axisymmetric end wall design has been
designed for a guide vane of a control stage. This
end wall design has been gained by an evolutionary
reference
Ind 56
Ind 02
ICEC 2010 - International Conference on Evolutionary Computation
330

optimization algorithm. This algorithm has been
successfully connected to a commercial CFD solver.
The aim of the end wall contouring was to reduce
the total pressure loss and the secondary flow
regimes in the guide vane. A significant reduction of
the total pressure loss was achieved. This
investigation shows that the optimization of the
shroud contour is not a simple problem. It shows
that an evolutionary algorithm is a suitable
optimization method for this problem. However it
also shows that the evaluation of the fitness function
has to be speed up. One method would be an
approximated one dimensional calculation of the
flow field in the guide vane. In order to include the
influence of the guide vane contour on the efficiency
of the control stage, the whole stage will be
simulated during the further optimization. In a
further step the results of this investigation will be
compared with measurements of an air turbine test
rig with different end wall configurations.
ACKNOWLEDGEMENTS
The investigations were conducted as part of the
joint research program COOREFF-T/COORETEC-
turbo in the frame of AG Turbo. The work was
supported by the Bundesministerium für Wirtschaft
und Technologie (BMWi) as per resolution of the
German Federal Parliament under grant number
0327716Q. The authors gratefully acknowledge AG
Turbo and MAN Diesel & Turbo SE for their
support and permission to publish this paper. The
responsibility for the content lies solely with its
authors.
REFERENCES
Backhaus, K., Erichson, B., Plinke, W., and Weiber, R.
(2006). Multivariate Analysemethoden. Springer.
Borg, I., and Groenen, P., 1997. Modern Multidimensional
Scaling. Springer.
Dejc, M. E., and Zarjankin, A. E. (1960). Methods of
Increasing the Efficiency of Turbine Stages.
Teploenergetika, 2, pp. 18–24.
Dejc, M. E., and Trojanovskij, B. M. (1973).
Untersuchung und Berechung axialer Turbinenstufen.
Berlin: VEB Verlag Technik.
Eymann, S., Foerster, W., Beversdorff, M., Reinmoeller,
U., Niehuis, R., and Gier, J. (2002). Improving 3D
flow characteristics in a multistage LP turbine by
means of endwall contouring and airfoil design
modification part 1: design and experimental
investigation. In Proceedings of ASME Turbo Expo.
ASME Paper GT2002-30352.
Gregory-Smith, F. G. (1997). Secondary and Tip-
Clearance Flows in Axial Turbines. VKI LS, 1997-01.
Von Karman Institute for Fluid Dynamics, Rhode St.
Genese, Belgium.
Hartland, J. C., Gregory-Smith, D. G., Harvey, N. W., and
Rose, M. G. (2000). Nonaxisymmetric Turbine End
Wall Design: Part II - Experimental Validation. ASME
Journal Turbomachinery, 122, 286–293.
Harvey, N. W., Rose, M. G., Taylor, M. D., Shapar, S.,
Hartland, J. C., and Gregory-Smith, D. G. (2000).
Nonaxisymmetric Turbine End Wall Design: Part I -
Three-Dimensional Linear Design System. ASME
Journal Turbomachinery, 122, 278–285.
Langston, L., 2001. Secondary Flows in Axial Turbines -
A Review. Annals of New York Academy Sciences,
934.
Moustapha, S. H., and Williamson, R. G. (1985).
Investigation of the Effect of two Endwall Contours
on the Performance of an Annular Nozzle Cascade.
Proceedings of AIAA. AIAA-85-1218.
Rechenberg, I. (1994). Evolutionsstrategie ’94. Stuttgart:
Frommann-Holzboog.
Rose, M. G. (1994). Non-axisymmetric Endwall Profiling
in the HP NGVs of an Axial Flow Gas Turbine.
Proceedings of ASME Turbo Expo. ASME Paper No.
94-GT-249.
Seber, G. A. F. (1984). Multivariate Observations. Wiley.
Sieverding, C. H. (1985). Recent progress in the
understanding of basic aspects of secondary flows in a
turbine blade cascade. ASME Journal of Engineering
Gas Turbines and Power, 107(2), 248–252.
Weicker, K. (2002). Evolutionaere Algorithmen. Teubner
Verlag.
OPTIMIZATION OF A STEAM TURBINE GUIDE VANE BY END WALL CONTOURING USING EVOLUTIONARY
ALGORITHMS
331
