
CORTICAL RHYTHMS INDUCED BY TMS STIMULATION
Analysis with a Neural Mass Model
Filippo Cona, Melissa Zavaglia, Mauro Ursino
Department of Electronics, Computer Science and Systems, University of Bologna, Via Venezia 52, Cesena, Italy
Mario Rosanova
Department of Clinical Science, “Luigi Sacco”, University of Milan, Milan, Italy
Keywords: Transcranial magnetic stimulation, Neural mass models, Cortical rhythms, Effective connectivity.
Abstract: Knowledge of cortical rhythms represents an important aspect of modern neuroscience, to understand how
the brain realizes its functions. Recent data suggest that different regions in the brain may exhibit distinct
rhythms when perturbed by Transcranial Magnetic Stimulation (TMS) (Rosanova et al., 2009) and that
these rhythms can change due to the connectivity among regions. In this context, neural mass models can be
very useful to simulate specific aspects of electrical brain activity and, above all, to analyze and identify the
overall frequency content of EEG in a cortical region of interest (ROI). In this work we implemented a
model of connectivity among cortical regions (Ursino, Cona and Zavaglia, 2010) to fit the impulse
responses in three ROIs during an experiment of TMS stimulation. In particular we investigated Brodmann
Area (BA) 19 (occipital lobe), BA 7 (parietal lobe) and BA 6 (frontal lobe). Results show that the model can
reproduce the natural rhythms of the three regions quite well, acting on a few internal parameters.
Moreover, model can explain most rhythm changes induced by stimulation of another region, by using just a
few long-range connectivity parameters among ROIs.
1 INTRODUCTION
The study of brain rhythms represents an important
aspect of modern neuroscience. The electrical
activity of the brain is very complex, including
different oscillatory patterns at different frequencies,
which may change with the particular task. It is
generally assumed that these rhythms are not merely
epiphenomena, but play a relevant role in many
perceptive, motor and cognitive functions.
An estimation of the intrinsic rhythms of brain
regions, and of how these rhythms can be
transmitted and modified as a consequence of brain
connectivity, can be achieved using the TMS
technique combined with EEG recordings. This
technique allows the measurement of cortical
reactivity and functional connectivity (Miniussi and
Thut, 2010). TMS, in fact, can be used to elicit
changes in the synchronization of the brain
oscillatory activities, and thus in the rhythms power
(Brignani, Manganotti, Rossini and Miniussi, 2008;
Fuggetta, Pavone, Fiaschi and Manganotti, 2008).
Moreover, TMS has been used to perturb cortical
regions in order to map the different cognitive and
motor functions over the brain (Hallett, 2007) and to
link these functions to characteristic oscillatory
activities (Thut and Miniussi, 2009).
In a recent work, Rosanova et al. (2009)
observed the oscillation rate in three brain regions
(occipital, parietal, and frontal) following TMS
stimulation of different intensities in a group of
healthy volunteers. Results show that the natural
frequency can be directly measured in virtually any
area of the cerebral cortex. Moreover, these natural
rhythms can be transmitted from one region to
another (or the intrinsic rhythms can be modified) as
a consequence of connectivity among ROIs.
The previous results are suitable to be analyzed
using neurologically inspired computational models.
Actually, the impulse response is a classical
instrument in modeling literature to estimate
parameters and validate model structure in a
straightforward way. Computational models, in turn,
are essential to reach a deeper understanding of the
205
Cona F., Zavaglia M., Ursino M. and Rosanova M..
CORTICAL RHYTHMS INDUCED BY TMS STIMULATION - Analysis with a Neural Mass Model.
DOI: 10.5220/0003080402050211
In Proceedings of the International Conference on Fuzzy Computation and 2nd International Conference on Neural Computation (ICNC-2010), pages
205-211
ISBN: 978-989-8425-32-4
Copyright
c
2010 SCITEPRESS (Science and Technology Publications, Lda.)

neural mechanisms involved in rhythms generation
and in their propagation .
In recent years, we developed a neural mass
model to study rhythm generation and rhythm
transmission among connected cortical regions. The
model was built starting from equations proposed by
Jansen and Rit (1995) and Wendling, Bartolomei,
Bellanger and Chauvel (2002), with inclusion of a
new loop to simulate the role of fast GABA-ergic
interneurons in the genesis of gamma oscillations
(Ursino et al., 2010). The model was able to
simulate multiple rhythms within the same ROI and
the transmission of rhythms from one region to
another, by simply modulating a few parameters
which represent short-range connections within a
region and inter-area long-range connectivity
(Ursino et al., 2010).
The experimental results by Rosanova et al.
(2009) are particularly suitable to test our model. In
particular, some model predictions (the presence of
intrinsic rhythms in individual ROIs and the
possibility to transmit rhythms via a few effective
connections among ROI) agree at least qualitatively
with these experimental data.
Hence, the present study was designed with the
following two main purposes:
i) to analyze whether the response of individual
ROIs to direct TMS stimulation can be simulated
with sufficient accuracy with the model by
modifying just a few internal parameters of that
region. This aspect is the same as to fit the natural
rhythm of a ROI with a parsimonious biologically
inspired model;
ii) to analyze whether a model of interconnected
ROIs can at least approximately explain how natural
rhythms can be transmitted or modified as a
consequence of inter-region connections. In this case
too, we are looking for a parsimonious description.
In this work, we simulated the behavior of
Brodmann Area (BA) 19 (occipital lobe), BA 7
(parietal lobe) and BA 6 (frontal lobe) with a
network of three interconnected regions. Parameters
are given to reproduce the effect of TMS stimulation
of medium intensity in one representative subject.
2 METHODS
2.1 Experimental Data Recording
(TMS and EEG)
During the experiment, subjects were lying on an
ergonomic chair, relaxed, and with eyes open
looking at a fixation point on a screen. A focal
bipulse, figure-of-eight coil with 60mm wing
diameter driven by a biphasic stimulator (eXimia
TMS Stimulator; Nexstim) was used to stimulate the
subjects’ cortex. Three cortical sites (middle or
superior occipital gyrus, superior parietal gyrus, and
middle or caudal portion of the superior frontal
gyrus) were selected based on an atlas of brain
regional anatomy (Tamraz and Comair, 2000),
anatomically identified on a T1-weighted individual
MRI (resolution 1 mm) acquired with a 1 T Philips
scanner and were targeted by means of a Navigated
Brain Stimulation (NBS) system (Nexstim). We
recorded high-density EEG using a TMS-compatible
60-channel amplifier (Nexstim) which gates the
TMS artifact and prevents saturation by means of a
proprietary sample-and-hold circuit (Virtanen,
Ruohonen, Naatanen and Ilmoniemi, 1999). The
EEG signals, referenced to an additional electrode
on the forehead, were filtered (0.1–500 Hz) and
sampled at 1450 Hz with 16-bit resolution. Two
extra sensors were used to record the
electrooculogram. In most cases, no TMS-induced
magnetic artefacts were detected, and in all cases,
the EEG signals were artefact-free after the stimulus.
TMS trials containing noise, muscle activity, or eye
movements were automatically detected and
rejected. The event related potentials were obtained
by averaging across all the trials of each session
(100-200 per session). More technical details on the
procedure can be found in Rosanova et al. (2009).
In this work, only data from one subject have
been examined, obtained with a TMS intensity as
high as 120 V/m.
2.2 Cortical Sources Reconstruction
Source modelling was performed following a
multiple step procedure: the free licence package
SPM (http://www.fil.ion.bpmf.ac.uk/spm) was used
to create the cortical mesh by adapting an average
Montreal Neurological Institute (MNI) cortex to the
subject’s MRI data; skull and scalp meshes were
also co-registered with EEG sensors positions into
the subject’s MRI space; a 3-spheres BERG method
was obtained to calculate the Lead Field Matrix by
using the free access Brainstorm software package
(http://neuroimage.usc.edu/brainstorm); the inverse
solution was calculated on a single trial basis by
applying an empirical Bayesian approach with
estimation of covariance components using
Restricted Maximum Likelihood (Friston, Henson,
Phillips and Mattout, 2006). In order to compute the
overall current evoked by TMS in different cortical
ICFC 2010 - International Conference on Fuzzy Computation
206

areas, cortical sources were attributed to different
Brodmann areas using an automatic tool of
anatomical classification
(http://www.ansir.wfubmc.edu). Currents recorded
within each area were cumulated in order to produce
a new time series.
C
pe
C
pf
C
ps
v
p
+
-
-
C
ep
v
e
C
sp
v
s
z
p
h
e
(t)
G
e
, ω
e
z
s
+
u
p
(t)/C
pe
+
h
e
(t)
G
e
, ω
e
y
e
y
p
h
s
(t)
G
s
, ω
s
z
e
y
s
C
fs
v
f
C
fp
C
ff
h
f
(t)
G
f
, ω
f
+
+
-
-
z
f
h
e
(t)
G
e
, ω
e
u
f
(t)
y
l
y
f
Figure 1: Model layout of a single cortical region.
2.3 Model of a Single Cortical Area
The model of a cortical region consists of four
neural populations, which represent pyramidal
neurons, excitatory interneurons, and inhibitory
interneurons with slow and fast synaptic kinetics
(GABA
A,slow
and GABA
A,fast
respectively). Each
population represents a group of neurons of the same
type, which approximately share the same
membrane potential and so can be lumped together.
All populations are described with a similar
mathematical formalism. Briefly, each population
receives an average postsynaptic membrane
potential (say v) from other neural populations, and
converts this membrane potential into an average
density of spikes fired by the neurons. In order to
account for the presence of inhibition (when
potential is below a given threshold) and saturation
(when potential is high) this conversion is simulated
with a static sigmoidal relationship. Moreover, each
population sends synapses to other populations (or,
in case of pyramidal neurons, to other regions too).
Each synaptic kinetics is described with a second
order system, but with different parameter values.
In the following, a quantity which belongs to a
neural population will be denoted with the subscript
p (pyramidal), e (excitatory interneuron), s (slow
inhibitory interneuron) and f (fast inhibitory
interneuron). To model a whole cortical region, the
four populations are connected via excitatory and
inhibitory synapses, with impulse response h
e
(t),
h
s
(t) or h
f
(t), assuming that pyramidal neurons and
excitatory interneurons synapses have similar
dynamics. The average numbers of synaptic contacts
among neural populations are represented by eight
parameters, C
ij
(see Fig. 1), where the first subscript
represents the target (post-synaptic) population and
the second subscript refers to the pre-synaptic
population. These connections agree with those
proposed by Wendling et al. (2002) but with the
addition of the new self-loop C
ff
. The model is
displayed in Fig. 1. For more details see Ursino et al.
(2010).
2.4 Model of Connectivity
Among Areas
To simulate cortical connectivity between two
regions (the pre-synaptic and post-synaptic regions
will be denoted with the superscript k and h,
respectively), we assumed that the average spike
density of pyramidal neurons of the pre-synaptic
area (z
k
) affects the target region via a weight factor,
W
j
hk
(where j = p or f, depending on whether the
synapse targets pyramidal neurons or GABA
A,fast
interneurons) and a time delay of 1 ms. This is
achieved by modifying the membrane potential v
p
h
and/or v
f
h
of the target region, with the time
dynamics of an excitatory synapse. Long range
synapses which target to slow inhibitory
interneurons or to excitatory interneurons have not
been considered since they have a minor role in
model dynamics (Ursino et al., 2010). The
generalization to more than two regions is trivial.
2.5 Simulation of TMS Experiments
and Parameter Fitting
In order to simulate the TMS experiment described
above, we implemented a model of connectivity
among three cortical regions. These regions wish to
simulate the Brodmann Area (BA) 19 (occipital
lobe), BA 7 (parietal lobe) and BA 6 (frontal lobe).
A manual fitting between simulated EEG and real
data has been achieved both in the time and
frequency domains. In particular, we focused
CORTICAL RHYTHMS INDUCED BY TMS STIMULATION - Analysis with a Neural Mass Model
207

attention on the 400 ms following the TMS impulse,
and on the frequency range 10–50 Hz. In order to
eliminate possible differences in amplification, all
experimental time series have been preliminarily
multiplied by a constant gain so that their amplitudes
would be comparable to those of the simulated
signals. It is worth noting that we didn’t consider the
first oscillations in the experimental signals because
they are mostly artefactual. The time frequency
maps were obtained using the Morlet wavelet
transform.
Manual fitting has been subdivided into two
steps:
Step i) In the first step, we tried to investigate the
impulse response of a single region, when the same
region receives the TMS stimulus. In this phase,
connectivities among regions were put to zero. The
TMS stimulus in the single cortical area was
simulated by instantly modifying the four state
variables representing the outputs of the synapses
blocks (y
p
, y
e
, y
s
, y
f
) by the same amount (say y).
Table 1: Model parameters.
Parameters Common
G
e
5.17
G
s
4.45
G
f
57.1
ω
e
75
ω
s
30
ω
f
75
C
e
p
5
C
p
e
25
C
s
p
60
Parameters BA 19 BA 7 BA 6
C
p
s
65 15 70
C
f
p
52 70 50
C
fs
12 12 12
C
pf
35 7.5 35
C
f
f
35 9.5 22.5
Δy
i
-0.04 0.012 -0.01
Table 2: Inter regions connections toward pyramidal
neurons.
to \ from BA 19 BA 7 BA 6
BA 19 - 0 0
BA 7 34 - 0
BA6 0 0 -
Table 3: Inter regions connections toward GABA
A,fast
neurons.
to \ from BA 19 BA 7 BA 6
BA 19 - 20 15
BA 7 0 - 40
BA6 10 15 -
This operation simulates a sudden change in the
membrane potentials of the four neural groups,
which agree with other TMS implementations in
neural models (Esser, Hill and Tononi, 2005).
In order to reproduce the intrinsic frequency
content of each region, we acted on the numbers of
synaptic contacts among the neural populations of
each ROI (C
ij
). The list of parameters is shown in
Table 1. In particular, we focused only on those
internal parameters (C
ps
, C
fp
, C
pf
, C
ff
, C
fs
) that most
influenced the frequency content of the model output
(Ursino et al., 2010). The intensity of the stimulus
Δy was positive when the deflection in the time
response was negative (see BA 7 in Table 1) and
negative otherwise (BA 19 and BA 6 in Table 1).
Step ii) By maintaining the same internal
parameters of the three regions obtained in step i, we
acted on inter-regions connectivity, to simulate the
changes in the frequency rhythms that each region
exhibit as a consequence of stimulation in another
region, still trying to preserve the fitting results
achieved in step i. To have a parsimonious
description, we assumed that the connectivity from
one region to another may target either to pyramidal
neurons or to fast inhibitory interneurons (i.e., we
never used both simultaneously). This reduces the
number of connectivity parameters to six. As it is
reported in Tables 2 and 3, only a connectivity is
toward pyramidal cells, while all the remaining ones
are toward GABA
A,fast
interenurons, underlying the
importance of this neural group in the generation of
different rhythms (Ursino et al., 2010).
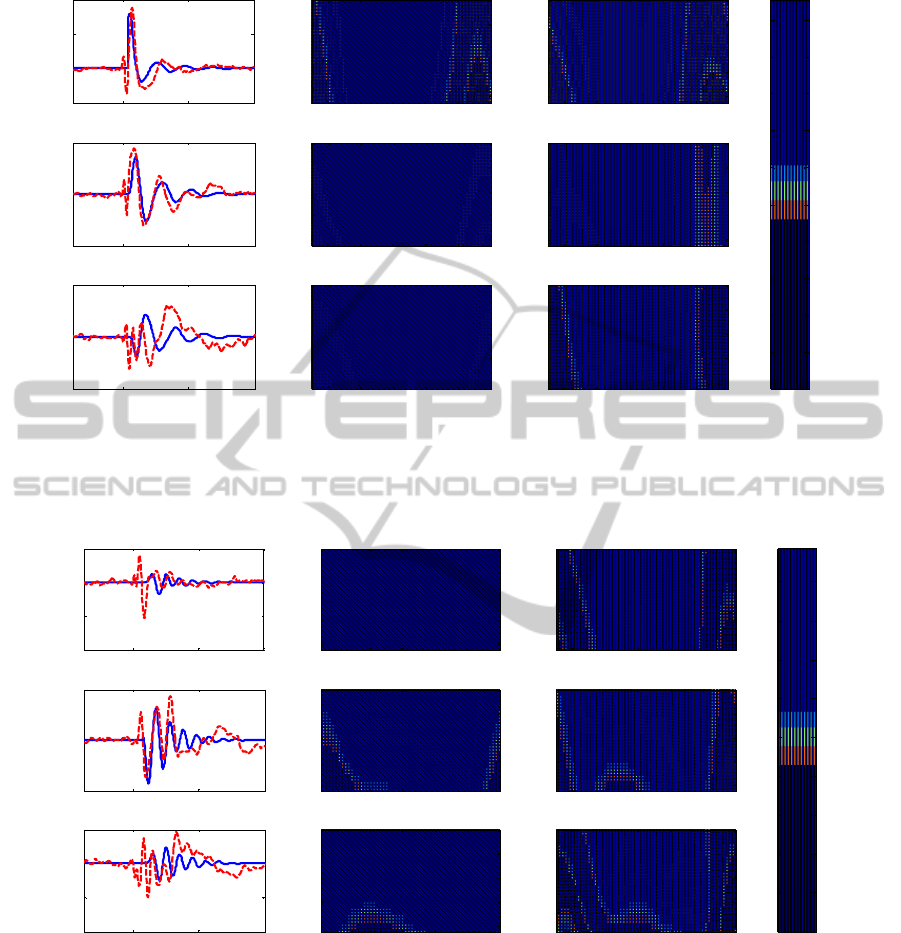
3 RESULTS
Real and simulated signals were compared both in
time and frequency domains. In particular, Figs. 2-4
display the time patterns and the spectrograms of the
simulated and real signals in response to TMS
stimulation on BA19 (Fig. 2), on BA7 (Fig. 3) and
on BA 6 (Fig. 4). Results show that the model can
reproduce the main experimental patterns of cortical
activity quite satisfactorily.
The main result is that each region exhibits a
different intrinsic rhythm, and this rhythm exhibits
evident changes as a consequence of the stimulation
of another region. The model can explain both these
aspects, ascribing the first to the internal parameters
of the region, and the second to the mutual long-
range connections among regions. Focusing on BA
19, one can observe that this region exhibits an
activity mainly in the alpha range when it is directly
stimulated by TMS, although with components also
ICFC 2010 - International Conference on Fuzzy Computation
208
0.8 1 1.2
-2
0
2
4
BA 19 Potential
potential (mV)
0.8 1 1.2
-2
0
2
BA 7 Potential
potential (mV)
0.8 1 1.2
-2
0
2
BA 6 Potential
time (s)
potential (mV)
BA 19 Simulated wavelet map
frequency (Hz)
0.7 0.8 0.9 1 1.1
10
20
30
40
50
BA 7 Simulated wavelet map
frequency (Hz)
0.7 0.8 0.9 1 1.1
10
20
30
40
50
BA 6 Simulated wavelet map
time (s)
frequency (Hz)
0.7 0.8 0.9 1 1.1
10
20
30
40
50
BA 19 Experimental wavelet map
frequency (Hz)
0.7 0.8 0.9 1 1.1
10
20
30
40
50
BA 7 Experimental wavelet map
frequency (Hz)
0.7 0.8 0.9 1 1.1
10
20
30
40
50
BA 6 Experimental wavelet map
time (s)
frequency (Hz)
0.7 0.8 0.9 1 1.1
10
20
30
40
50
0
20
40
60
80
100
120
140
160
180
200
Figure 2: Cortical activations due to TMS stimulus on BA 19. In the first column are shown the experimental (red dashed
line) and simulated (blue line) time responses, while in the second and third columns are shown the resp ective time
frequency maps.
0.8 1 1.2
-1
-0.5
0
0.5
BA 19 Potential
potential (mV)
0.8 1 1.2
-0.5
0
0.5
BA 7 Potential
potential (mV)
0.8 1 1.2
-1
-0.5
0
0.5
BA 6 Potential
time (s)
potential (mV)
BA 19 Simulated wavelet ma
p
frequency (Hz)
0.7 0.8 0.9 1 1.1
10
20
30
40
50
BA 7 Simulated wavelet map
frequency (Hz)
0.7 0.8 0.9 1 1.1
10
20
30
40
50
BA 6 Simulated wavelet map
time (s)
frequency (Hz)
0.7 0.8 0.9 1 1.1
10
20
30
40
50
BA 19 Ex
p
erimental wavelet ma
p
frequency (Hz)
0.7 0.8 0.9 1 1.1
10
20
30
40
50
BA 7 Experimental wavelet map
frequency (Hz)
0.7 0.8 0.9 1 1.1
10
20
30
40
50
BA 6 Experimental wavelet map
time (s)
frequency (Hz)
0.7 0.8 0.9 1 1.1
10
20
30
40
50
0
5
10
15
20
25
30
35
40
45
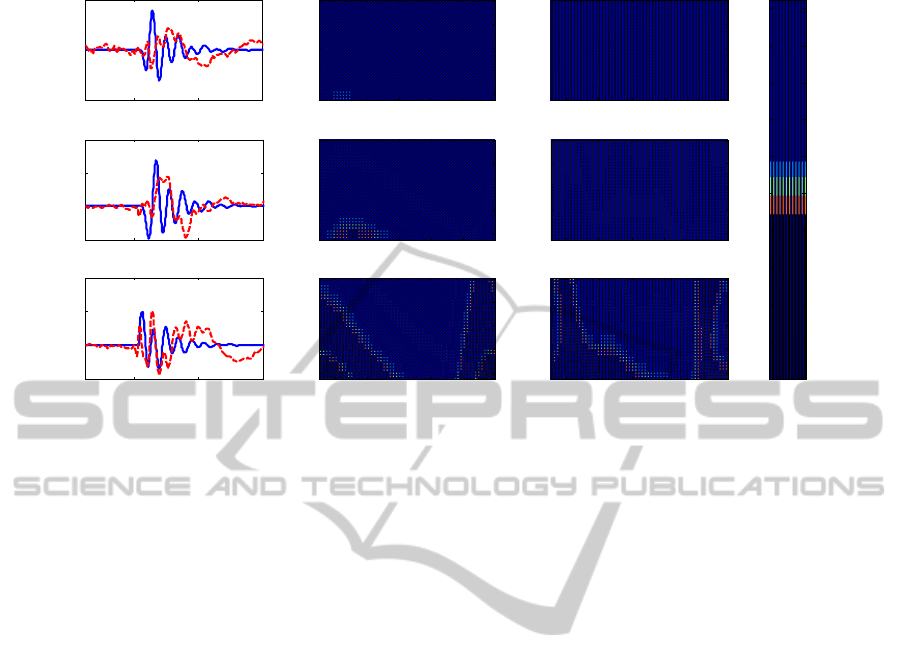
Figure 3: Cortical activations due to TMS stimulus on BA 7.
in the beta and gamma ranges (Fig. 2), while it
oscillates in the beta range when BA 7 is stimulated
(Fig. 3).
BA 7 exhibits an activity in high-beta range when
directed stimulated (Fig. 3), while it oscillates
mostly in alpha range when the BA 19 is stimulated
(Fig. 2). BA 6 oscillates mostly in gamma and alpha
range when it is stimulated by the TMS (Fig. 4), and
it oscillates in beta range and in alpha range
respectively when BA 7 (Fig. 3) and BA 19 (Fig. 2)
are stimulated. It is worth noting that the activity of
BA 19 and BA 7 is not statistically significant with
respect to the baseline activity following stimulation
of BA 6 (Rosanova et al., 2009). Hence, we did not
try to carefully simulate these signals with the model
(Fig. 4).
As it is reported in Tables 2 and 3, the strongest
connectivities are those toward BA 7, which is the
CORTICAL RHYTHMS INDUCED BY TMS STIMULATION - Analysis with a Neural Mass Model
209
0.8 1 1.2
-0.5
0
0.5
BA 19 Potential
potential (mV)
0.8 1 1.2
-0.5
0
0.5
1
BA 7 Potential
potential (mV)
0.8 1 1.2
-1
0
1
2
BA 6 Potential
time
(
s
)
potential (mV)
BA 19 Simulated wavelet map
frequency (Hz)
0.7 0.8 0.9 1 1.1
10
20
30
40
50
BA 7 Simulated wavelet map
frequency (Hz)
0.7 0.8 0.9 1 1.1
10
20
30
40
50
BA 6 Simulated wavelet map
time
(
s
)
frequency (Hz)
0.7 0.8 0.9 1 1.1
10
20
30
40
50
BA 19 Experimental wavelet map
frequency (Hz)
0.7 0.8 0.9 1 1.1
10
20
30
40
50
BA 7 Experimental wavelet map
frequency (Hz)
0.7 0.8 0.9 1 1.1
10
20
30
40
50
BA 6 Experimental wavelet map
time
(
s
)
frequency (Hz)
0.7 0.8 0.9 1 1.1
10
20
30
40
50
0
10
20
30
40
50
60
70
80
90
100
Figure 4: Cortical activations due to TMS stimulus on BA 6.
only region receiving a connectivity toward
pyramidal cells. The other two regions receive a
connectivity only toward GABA
A,fast
interneurons.
4 CONCLUSIONS
The main objective of the present work was to
investigate whether a recent neural mass model of
interconnected regions (Ursino et al., 2010), can
explain the patterns of neural rhythms evoked by
TMS stimulation, in three different cortical regions
(occipital, parietal and frontal). Results are reliable
and underline the following fundamental aspects:
i) The impulsive response evoked in a cortical
region via a TMS stimulus of medium intensity can
be fitted quite well acting just on a few parameters
internal to the region, which represent the number of
synaptic connections between the neural populations
involved.
ii) Different regions exhibit different natural
rhythms when directly stimulated by TMS (roughly
in the alpha band for the BA19, in the beta band for
the BA7 and in the gamma band for the BA6). This
result, which was well evident in the former work by
Rosanova et al. (2009), is now explained in terms of
differences in the internal connections between the
neural populations, without the need to hypothesize
changes in synaptic dynamics (i.e., all synapses
which refer to a given class of neurons have the
same dynamics in the model, independently of the
cortical region).
iii) The natural rhythms in a ROI are modified if
another region is stimulated. Model can simulate
these rhythm changes fairly well, ascribing them to
effective connectivity among ROIs. Substantially,
the main new result of this study is that a simple and
parsimonious pattern of connectivity (with only six
weights) can explain how a natural frequency can be
modified and/or a new rhythm can be received
following stimulation of another ROI. In general, the
simple connectivity pattern shown in Tables 2 and 3
can mimic many of the rhythm changes observed
during the experiment in the three regions (occipital,
parietal and frontal). In perspective, this result may
have important implications for neuroscience. On
one hand, the way a natural rhythm is transmitted
from one region to another may play an important
role in many perceptive, motor or cognitive brain
functions (Fries, Nikolic and Singer, 2007; Kaiser
and Lutzenberger, 2005; Steriade, 2006).
Furthermore, the observation of rhythm changes in
different brain regions may provide important clues
to assess brain connectivity from high resolution
scalp EEG, a problem of large relevance in
contemporary cognitive neuroscience.
iv) Most interregional connections in this study
are directed from pyramidal toward fast GABAergic
interneurons. We do not think that this result
signifies that excitatory pyramidal-pyramidal
connections are unimportant in brain connectivity.
Rather, this result underlines that fast inhibitory
interneurons play an essential role in rhythm
transmission, especially at high EEG frequencies
ICFC 2010 - International Conference on Fuzzy Computation
210

(high beta and gamma). This is probably a
consequence of their fast dynamics. A similar
conclusion was achieved, via a sensitivity analysis,
in another modeling paper (Ursino et al., 2010).
Although the results attained in the present work
are quite satisfactory, the study also exhibits several
limitations, which may become the target of future
improvements or extensions. First, there is no
warranty that the parameter values obtained in this
study are unique. Probably, different combinations
of parameters do exist which provide similar results.
The problem of the uniqueness of parameter
estimates is very complex in all non-linear fitting
procedures. The solution will require the inclusion
of additional knowledge, to constrain parameter
estimates (for instance, the use of additional
anatomical or neurophysiological knowledge, and
the use of Bayesian estimation techniques).
In the present study we used a manual fitting
procedure. An improved fitting may be achieved, in
future works, using an automatic algorithm. This,
however, must deal with the problem of multiple
solutions and with a smart choice of an initial guess.
The experiment was performed on 7 subjects, but
in this pilot study we used data recorded just from
one of them. Fitting to all available data will be
attempted in future works, once an automated
estimation algorithm is available. Comparison
between the connectivity patterns obtained on
different subjects will be of the greatest value to
check the repeatability of the obtained results, and to
understand which connectivity parameters are more
subject dependent.
In the present study, we did not consider
connections between cortical regions and the
thalamus. Conversely, cortico-thalamic connections
are known to play a pivotal role in generating brain
oscillations (Steriade, 2006) as well as in the
transmission of information among cortical regions.
The choice of not including thalamic regions in the
model was motivated by a parsimony reason: we
wished to realize a parsimonious model of a TMS
stimulation experiment, with a reduced number of
regions and of connectivity parameters.
Consequently, a single ROI in the model can be
considered representative not only of cortical
dynamics, but more generally of an entire cortico-
thalamic circuit. Inclusion of an explicit description
of the thalamus may represent a possible model
extension. However, we expect that this enlarged
model would require more data to fit individual
parameters in both cortical and thalamic regions
altogether.
REFERENCES
Brignani, D., Manganotti, P., Rossini, P. M. and Miniussi,
C., (2008). Modulation of cortical oscillatory activity
during transcranial magnetic stimulation. Human
Brain Mapping, 29(5), 603-612.
Esser, S. K., Hill, S. L. and Tononi, G., (2005). Modeling
the effects of transcranial magnetic stimulation on
cortical circuits. Journal of Neurophysiology, 94(1),
622-639.
Fries, P., Nikolic, D. and Singer, W., (2007). The gamma
cycle. Trends in Neurosciences, 30(7), 309-316.
Friston, K., Henson, R., Phillips, C. and Mattout, J.,
(2006). Bayesian estimation of evoked and induced
responses. Human Brain Mapping, 27(9), 722-735.
Fuggetta, G., Pavone, E. F., Fiaschi, A. and Manganotti,
P., (2008). Acute modulation of cortical oscillatory
activities during short trains of high-frequency
repetitive transcranial magnetic stimulation of the
human motor cortex: a combined EEG and TMS
study. Human Brain Mapping, 29(1), 1-13.
Hallett, M., (2007). Transcranial magnetic stimulation: a
primer. Neuron, 55(2), 187-199.
Jansen, B.H. and Rit, V.G., (1995). Electroencephalogram
and visual evoked potential generation in a
mathematical model of coupled cortical columns.
Biological Cybernetics, 73(4), 357-366.
Kaiser, J. and Lutzenberger, W., (2005). Human gamma-
band activity: a window to cognitive processing.
Neuroreport, 16(3), 207-211.
Miniussi, C. and Thut, G., (2010). Combining TMS and
EEG offers new prospects in cognitive neuroscience.
Brain Topography, 22(4), 249-256.
Rosanova, M., Casali A., Bellina V., Resta F., Mariotti M.
and Massimini M., (2009). Natural frequencies of
human corticothalamic circuits. Journal of
Neuroscience, 29(24), 7679-7685.
Steriade, M., (2006). Grouping of brain rhythms in
corticothalamic systems. Neuroscience, 137(4), 1087-
1106.
Tamraz, J. and Comair, Y. (2000). Atlas of regional
anatomy of the brain using MRI. Berlin: Springer.
Thut, G. and Miniussi, C., (2009). New insights into
rhythmic brain activity from TMS-EEG studies.
Trends in cognitive sciences, 13(4), 182-189.
Ursino, M., Cona, F. and Zavaglia, M., (2010). The
generation of rhythms within a cortical region:
Analysis of a neural mass model. Neuroimage, 52(3),
1080-1094.
Virtanen, J., Ruohonen, J., Naatanen, R. and Ilmoniemi,
R.J., (1999). Instrumentation for the measurement of
electric brain responses to transcranial magnetic
stimulation. Med.Biol.Eng Comput., 37(3), 322-326.
Wendling, F., Bartolomei, F., Bellanger, J. J. and Chauvel,
P., (2002). Epileptic fast activity can be explained by a
model of impaired GABAergic dendritic inhibition.
European Journal of Neuroscience, 15(9), 1499-1508.
CORTICAL RHYTHMS INDUCED BY TMS STIMULATION - Analysis with a Neural Mass Model
211
