
AN ONTOLOGY DRIVEN MULTI-AGENT SYSTEM FOR
CLIENT ASSIGNMENT IN A BANK QUEUE
María de Lourdes Martínez-Villaseñor
1,3
, David González-Marrón
2,3
, Miguel González-Mendoza
3
and Neil Hernández Gress
3
1
Universidad Panamericana Campus México, Augusto Rodin 498, Col. Insurgentes Mixcoac, México, D. F., México
2
Instituto Tecnológico de Pachuca, Carretera México-Pachuca Km 81.5, Pachuca, Hidalgo, México
3
Instituto Tecnológico y de Estudios Superiores de Monterrey, Carretera Lago de Guadalupe Km 2.5
Atizapán de Zaragoza, Edo. de México, México
Keywords: Multi-agent, Ontology, Bank queue, Client profiling.
Abstract: This paper presents an ontology driven multi-agent system that uses a negotiation process for decision-
support in a Bank Queue. The system assists queue client assignment based on the client profile and the
cashiers’ workload in order to guarantee a minimum time response in client attention. The multi-agent
system has a direct positive impact in the quality of service. Simulations of service providers’ management
are presented in order to optimize the use of the resources. Our ontological user profiling and multi-agent
system approach can be easily extended and adapted to other domains by adding client profile
characteristics and adapting agent behaviours. The ontology proved to be useful when sharing content
between agents and performing semantic checks.
1 INTRODUCTION
High quality customer service is one of the key
ingredients for success when marketing products and
services. Enterprises all over the world recognize
that offering a good service even attached to a
product sell is most likely to determine their
competitive advantage. For that matter, knowing the
customer better can help many service providers to
improve and customize their service delivery and
development. To model user preferences, interests,
and requirements is a very important research area
for several applications, like Web usage and content
mining and Web search personalization (Jin, 2000;
Sieg, 2007), Service Marketing (Chen, 2009),
Personalized Information Services (So, 2009) among
many others. Ontological user profiling and adaptive
multi-agent systems attempts have been made
providing decision-support in gathering and
presentation on information. Harvey & Decker
(2005), demonstrate that the influence of the user
models on content selection and presentation
improves system output, (Harvey, 2005).
The quality of service in a bank is determined in
a large proportion by the time customers have to
wait in a queue before he or she receives attention
and the way the service provider recognizes their
special needs. Time of response restrictions and user
requirements have to be taken into consideration in a
client assignment system in order to guarantee a fair
quality of service.
In this paper, we present an ontology driven
multi-agent system that uses a Contract Negotiation
Process between a manager agent and several
cashier agents (service providers) for a Bank Queue
management. The system supports the decision on
the assignment of a new client to a cashier based on
the cashiers’ workload and the user profile to
guarantee a 20 minutes time response. The system
simulates the service providers’ management with
the purpose of optimizing the number of cashiers
opened considering the number of clients, the arrival
and service rates, and the clients’ profile.
In Section 2, the multi-agent system architecture
and its approach in client assignment are introduced.
In the Section 3 the client profiling and the ontology
development for user profiling as well as the
evaluation function derived from user characteristics
are presented. Agents bid summiting and negotiation
process is presented in Section 4. In Section 5 the
implementation is described, and in Section 6 the
241
Martínez-Villaseñor M., González-Marrón D., González-Mendoza M. and Hernández-Gress N..
AN ONTOLOGY DRIVEN MULTI-AGENT SYSTEM FOR CLIENT ASSIGNMENT IN A BANK QUEUE.
DOI: 10.5220/0003089602410250
In Proceedings of the International Conference on Knowledge Engineering and Ontology Development (KEOD-2010), pages 241-250
ISBN: 978-989-8425-29-4
Copyright
c
2010 SCITEPRESS (Science and Technology Publications, Lda.)

experiments and results of the simulation are
explained. Finally, in the last section main
conclusions and suggestions for future work are
presented.
2 MULTI-AGENT SYSTEM
CLIENT ASSIGNMENT IN A
BANK QUEUE
In ordinary bank branches clients arrive in the day
when just a few cashiers are necessary, however, at
the busiest times, the bank has to open every cashier
they have. Bank personal must foresee the changes
in the frequency of client arrivals in order to
optimize resources, in this case, the number of open
cashiers.
Some banking institutions establish policies and
rules on attention time of response. For example, in
Bolivia and Argentina a client must not wait in line
more than 30 minutes before he or she receives
attention,(Central,2010)(
NoticiasOnline.org,2010).
Based on banking policies, for the purpose of this
system, we considered a policy of 20 minutes
attention time of response. A new cashier should
open if some client is near to that time limit in order
to fulfil this policy. Additionally, for our purposes,
we consider six cashiers available in view of an
average bank branch.
To simulate the process we develop a multi-
agent system. In this system, agents provide us with
autonomy and decision-making capacity as well as
social ability for cooperation and negotiation needed
to provide a solution to this problem.
2.1 Multi-agent System Architecture
Our multi-agent system has three types of agents
with two distinctive roles. These agents are
described in the following paragraphs:
A. The cashier agents are responsible for providing
banking services for the customers assigned to
their queue. They should always be in contact
with the manager agent to receive future clients
and to constantly verify if some client waiting
time is near to 20 minutes. If so, the client must
be reassigned for immediate attention.
B. The executive agents are responsible of
providing banking services as well. The
differences in the services provided by the
cashiers are not relevant for this work because
the 20 minutes policy on attention time of
response also applies in spite of these
differences. The agent role is considered the
same.
C. The manager agent, only one, is responsible of
opening and closing cashiers i.e. creating and
destroying cashier agents when needed. He or
she is also responsible for assigning every
incoming client to the most convenient cashier
agent in order to provide attention to the
customer as fast as possible. The Manager
Agent receives the client´s profile information,
evaluates these characteristics and negotiates
with the active cashier agents, and assigns the
client to a cashier queue.
For statistical purposes, the manager agent registers
the client profile and arrival time in a blackboard
and the corresponding cashier agent updates this
record when the client leaves. Both types of agents
can read these records.
With some interval the cashier agents verify from
the records, how long has each client really been
waiting.
3 CLIENT PROFILE
There are many client characteristics worthy of
consideration to provide a personalized service and
speed up the client attention. In order to classify the
clients that arrive to a bank branch, we considered
the following characteristics:
1) The type of service required which determine
if the client needs to be attended by a cashier
or an executive.
2) Type of client: VIP or regular customer
3) Physical condition: handicapped, pregnant
women, elderly.
4) Number of intended transactions.
The type of service required determines the first
client categorization: Temporary client if the client
is going to be attended by a cashier or repeat client
if he or she is going to be attended by an executive.
Each section queue is separated. In this paper we
only describe the cashiers queue but the process of
managing the executives queue is similar and the
implementation is straightforward. The manager
cooperates with the executive agents in the same
manner as it works with the cashiers.
Depending of the type of client, physical
condition and number of intended transactions, an
expected time of attention (
) is calculated. This
variable (1) describes how long it takes a cashier to
serve a particular client. If we calculate an expected
KEOD 2010 - International Conference on Knowledge Engineering and Ontology Development
242
time of attention for each client, it is possible to
estimate how long each client must wait in line.
1
Where
= client expected time of attention
=Number of transactions and
|0 4
(1)
= Handicapped and 0,1
= Pregnant and 0,1
= Elderly and 0,1
Tc=Type of client (vip or regular) and
0,1
|0
2 i=1,2,3
Each
represents a weight that can be
considered for each physical condition attribute with
the intention of doing a more accurate estimation.
The value of the attribute itself is 1 when the
characteristic is present in a client or 0 if it is not.
We suppose that certain client attributes add
delay to the normal time spend in making one
operation and when clients are VIPs clerks make an
extra effort to speed up the execution of their
transactions.
Each cashier or executive agent has a queue and
the manager agent has to decide taking the current
state of the system and the client profile, which
agent is the best choice for assigning each arriving
client, in order to minimize the expected time of
response. The equation 1 applies to the cashier
agents, but equation for executive agents is similar.
∑
1
Where
= client expected time of attention
(2)
i
=Number of transactions of service
i
required and
|0 2
= minutes taken to perform service
i
required
= Handicapped and 0,1
= Elderly and 0,1
Tc=Type of client (vip or regular) and
0,1
|0
2 i=1,2
Transactions in the cashier equation are
considered to last one minute each plus the client’s
profile increase. This is not likely to be true for
executive transactions due to the nature of the
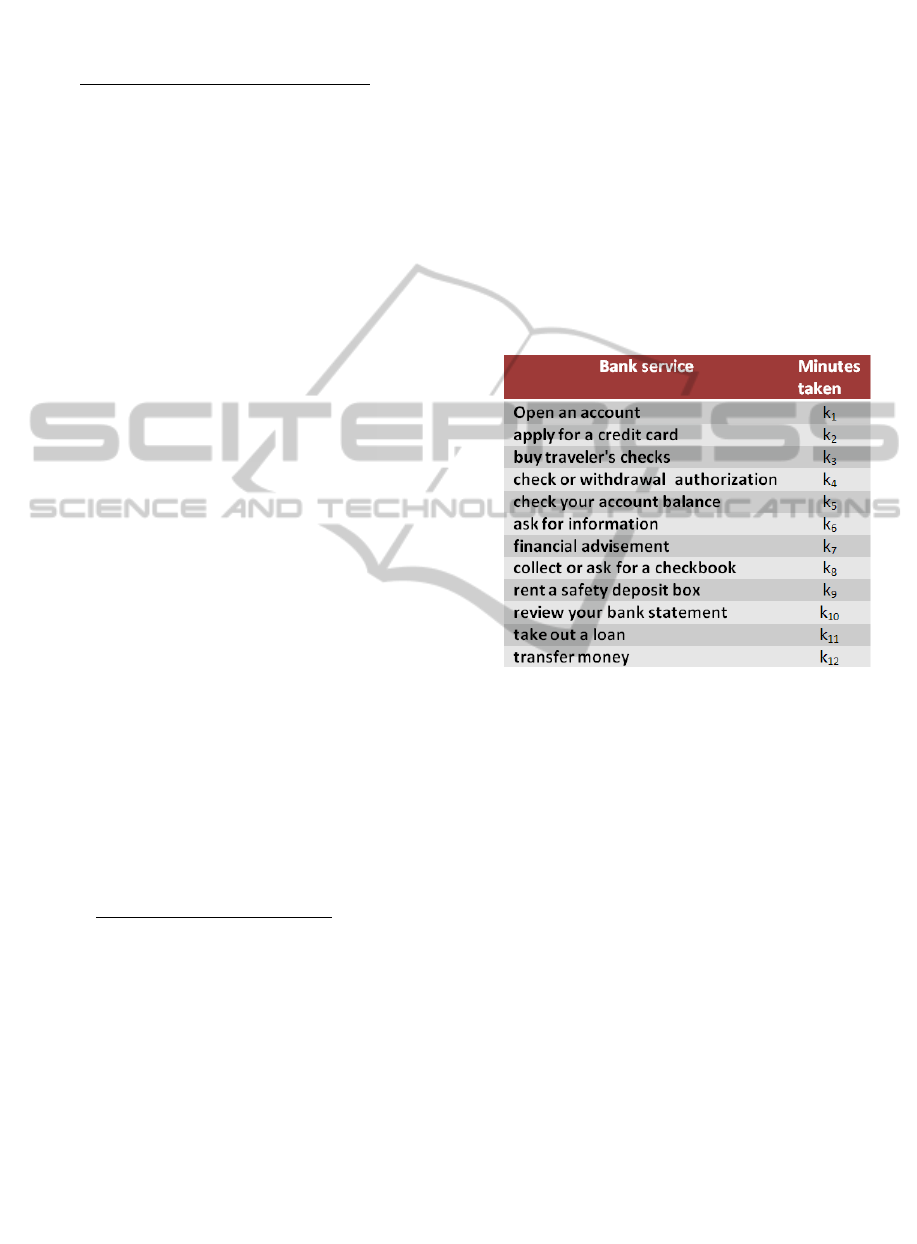
service required. To calculate the expected time of
attention of a client served by an executive agent, we
considered the type of service the client requires and
the minutes taken to perform each service (k
i
).
The k constants should be determined by a bank
expert and are intended to be system parameters.
Examples of bank services performed in a bank
branch by bank tellers (executive agents) are shown
in figure 1.
Figure 1: Examples of bank services performed by the
executive agents.
3.1 Ontology Development for Client
Profiling
We develop the multi-agent system using JADE
(Java Agent Development Framework) to simplify
the implementation of the agents and their
communication through JADE’s tools that complies
with FIPA specifications (Bellifemine,1999).
Agents in our multi-agent system have to share
content with the purpose of cooperation in order to
reach the common goal of fulfilling the 20 minutes
policy on attention time of response. For that matter,
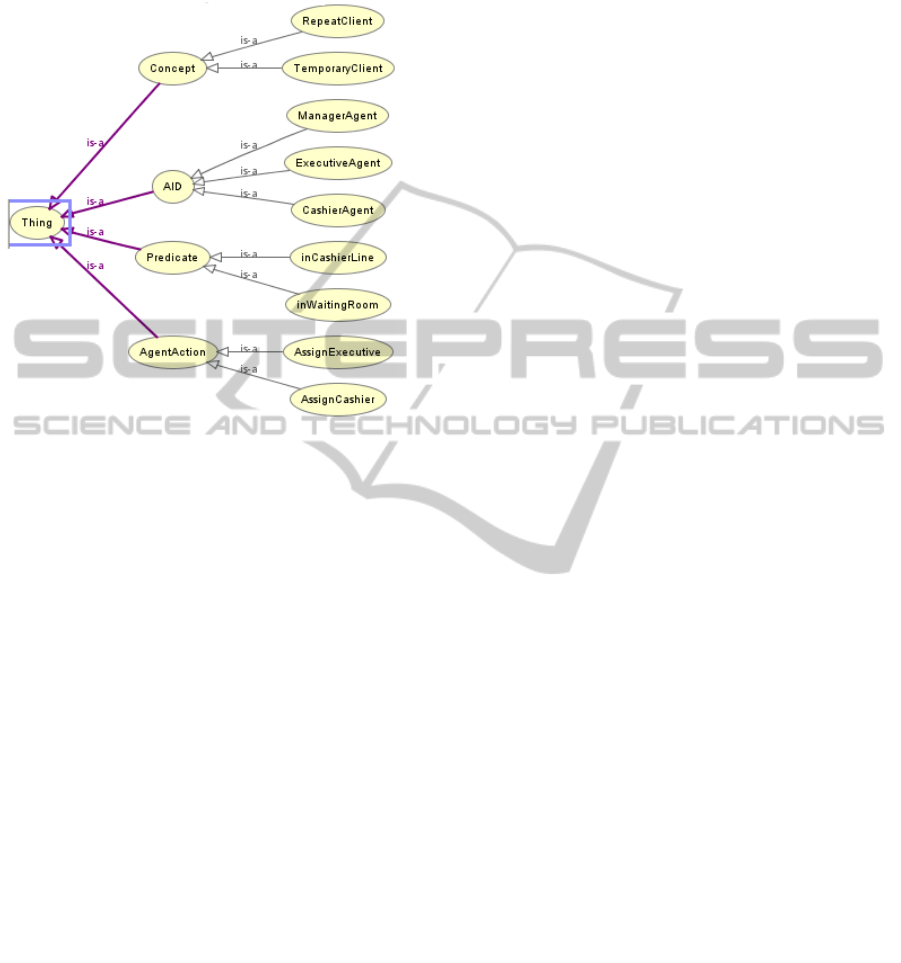
we designed the following ontology (Figure 2) so
JADE can perform the proper semantic checks on
given content expressions. Exploiting the JADE
content language and ontology support included in
the jade.content package includes developing proper
Java classes for concept, predicate and agent actions
(Bellifemine, 2001).
The type of service required at arrival time
determines what information is needed to considered
at the moment. This means that a client is classified
AN ONTOLOGY DRIVEN MULTI-AGENT SYSTEM FOR CLIENT ASSIGNMENT IN A BANK QUEUE
243
as a temporary client even though he has remained
several years as a client if he or she asks for a
cashier’s service. For a temporary client we consider
Figure 2: Ontology for client profiling.
just the type of client, physical condition and
number of intended transactions attributes. These
attributes are dynamic and vary for almost each time
a client arrives to a bank branch. For a repeated
client, a client that is looking for executive, more
long-term information is needed in addition to the
dynamic attributes described in equation 2. The
attributes in the long term scenario are age, gender,
salary, current investments, credit and general
historic records in the bank. These attributes can be
exploited also for other purposes.
Two concepts are designed with their
corresponding slots from the categories mentioned:
RepeatClient and TemporaryClient.
There are two agent actions used in manager
agent and cashier or executive agent negotiation:
AssignCashier and AssignExecutive. AssignCashier
action includes a slot with type TemporaryClien ,
and AssignExecutive includes a slot with type
RepeatClient with the purpose of sharing the
corresponding client information between manager
and the service agent (cashier or executive). One of
these two actions is sent in the manager agent´s
proposal.
Two relevant predicates were designed to enable
the service agents (cashier or executive) to respond
the manager agent´s proposal. An inCashierline
predicate is used in the manager agent and cashier
agent negotiation, and an inWaitingRoom predicate
is used if the service agent is an executive. With the
purpose of sending information relevant to the
proposal response, the predicates described include
the cashier or executive agent´s information, the
proposed client information and the expected
occupation time for the state of the service agent
queue.
4 CLIENT ASSIGNMENT
NEGOTIATION PROCESS
The presented multi-agent system gives decision-
support assistance in a Bank scenario based on
client’s profile and service provider agents’
workload. For that matter a negotiation process is
used. When a new client arrives the manager agent
receives his or her profile and calculates the
expected time of attention with equation 1. A
Contract Net Protocol is developed since the
manager agent wishes that the best suited cashier
agent assigns the client to its queue. The expected
time of attention among the client profile is sent in
the assign content of a FIPA cfp (call for proposal)
message to all active cashier agents. Each active
cashier agent receives the client profile and the
expected time of attention and evaluates the
expected occupation time given its current queue
status and the received information. The expected
occupation time (
) is the time the cashier agent
calculates a new client must wait in line before he or
she receives attention, if the current client prospect
is assigned to its queue. In other words, the cashier
agent calculates its workload if the proposed client
were to be assigned to its queue.
Where
expectedoccupationtime
expectedtimeofattentionofthe
proposedclient.
∑
= Sum of expected time of
attention of the n current clients
in the cashiers queue.
Each cashier agent sends a proposal if the expected
occupation time is less than or equal to 20 minutes,
or rejects the proposal if the expected occupation
time is longer. The occupation time with the
cashier’s agent identification and the client profile is
sent in an inline predicate content to the manager
agent.
KEOD 2010 - International Conference on Knowledge Engineering and Ontology Development
244
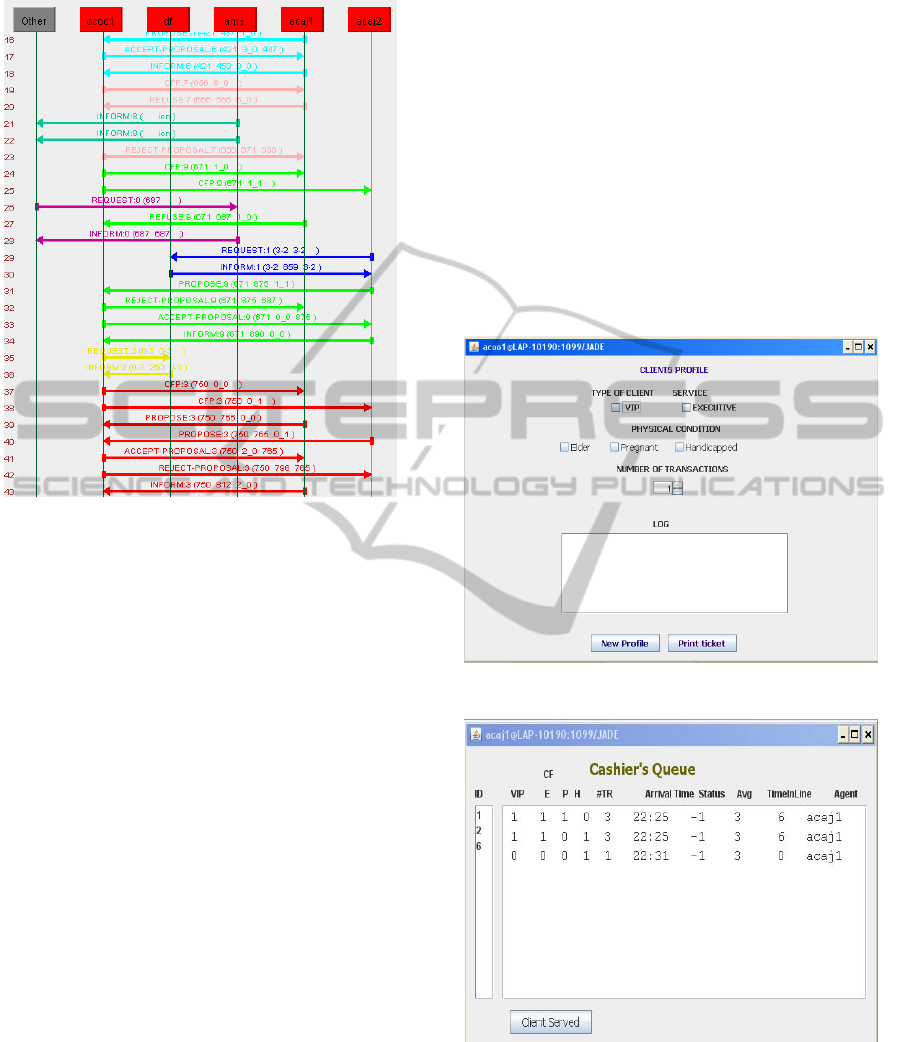
Figure 3: Partial view of agents’ negotiation.
The manager agent receives all the cashier agent
bids and evaluates which cashier agent has the
minimum occupation time for the given client
profile and accepts the best offer.
The main decision the manager agent can make
as a result of this negotiation, is which cashier agent
is the best suited to provide service to the incoming
client. However, other decisions can follow this
negotiation. If all cashiers reject the proposal, it
means that everybody is too busy and a new cashier
agent should be opened. On the contrary, if all bids
on the proposal are too low or even some of them
are zero, it means that at least one cashier agent
should be closed. The “low” threshold should be
determined by the bank based on an expert opinion
and is intended to be a system parameter.
5 IMPLEMENTATION
As we described earlier, the multi-agent system was
implemented using Jade (Java Agent Development
Framework). The ontology was first designed with
Protégé platform (http://protege.stanford.edu) and
afterwards, corresponding Java classes were
generated using the Ontology Bean Generator for
Jade (van Art, 2002). For preliminary
experimentation two swing-based Graphical User
Interfaces (GUI) were designed in Java. The first
interface of the manager agent (Figure 4) allows the
user to determine the arriving client attributes and
initiate its process simulating the bank branch device
that prints a turn number for the clients.
The second interface of the cashier agent (figure
5) allows the user to visualize how the clients are
been assigned to the agent´s queue and the client´s
attributes. The process of providing a service to the
client is implemented in the cashier agent GUI with
a button that simulates the event of finishing the
attention of a client and deleting its information
from the queue. In order to proof the multi-agent
system performance, two procedures were
implemented to simulate automatic entrance and exit
of clients.
Figure 4: Manager agent GUI.
Figure 5: Cashier agent GUI.
The arrival and service rates are simulated with
Java timers, and random client profiles are generated
for each input.
Interfaces can be used for a particular sequence
of client entrance and attention or the timer
AN ONTOLOGY DRIVEN MULTI-AGENT SYSTEM FOR CLIENT ASSIGNMENT IN A BANK QUEUE
245
procedures and random generated clients for a batch
simulation can be employed.
6 EXPERIMENTATION AND
RESULTS
For our experimentation, we considered a dynamic
number of parallel service providers; the system will
open and close cashier agents as needed and will
serve with First-come, First-served (FCFS) service
discipline.
When a client arrives, the manager agent assigns
him/her to the agent cashier’s queue with minimum
workload. No client should be assigned to a queue
were the expected occupation time is more or equal
20 minutes consequently the queue capacity does not
depend on the number of clients but on the expected
occupation time calculated with equation 3. This is
related with each client’s profile and determines the
cashier´s workload. For the client expected time of
attention given w
=2, w
=1 and w
=2 we
implemented the following instance of equation 1.
With this weight values we suppose that a
handicapped or an elder client would cause a greater
delay than a pregnant women when been served.
When using the interfaces, client attributes are
captured or randomly generated using the batch
simulation process.
We verified the multi-agent system performance
in three basic scenarios that differ only in the
constant arrival and service rates. These rates are
measured in clients per minute. We simulated the
equivalent of eight hours of bank activity for each
scenario.
Given the expected time of attention of all
randomly generated profiles, the mean is 3.04
minutes with a standard deviation of 1.97.
6.1 First Scenario: Arrival Rate is
Slower than the Service Rate
In the first scenario we performed several
experiments in which the arrival rate is slower than
the service rate, simulating a very slow day.
First, we experimented with the following rates:
each 6 minutes a client arrives and each minute a
client can be served. In eight hours 80 clients
arrived. As expected, the system opened the first
cashier agent and began to serve clients. Even
though there was some delay in the service due to
the client’s profile, no other cashier agent was
needed. Most clients were served upon arrival.
When varying the service rate but keeping it
faster or equal than the arrival rate, the result
remains the same: just one cashier was needed and
no client had to wait more than 20 minutes.
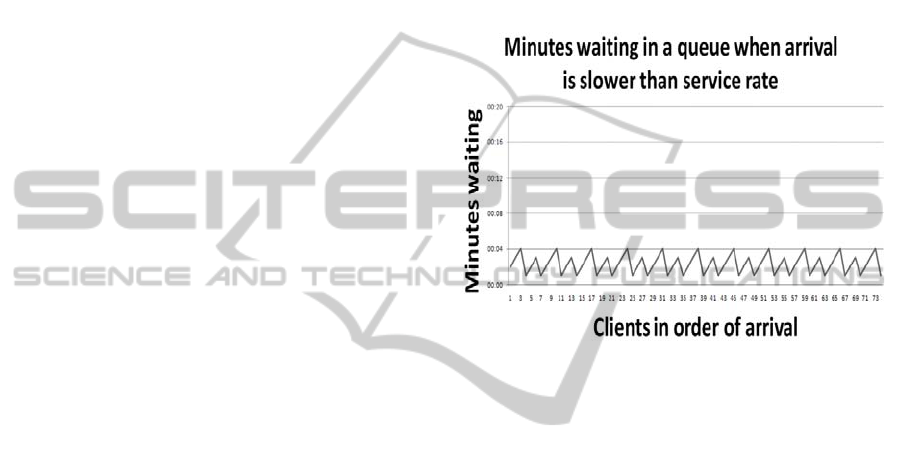
Figure 6 shows the time in minutes that clients
waited in a queue when the arrival rate was 6 clients
per minute and each 3.5 minutes a client can be
served, simulating the average service delay due to
the clients profile.
Figure 6: Minutes waiting in a queue in the first scenario.
6.2 Second Scenario: Arrival Rate is
Faster than the Service Rate
The arrival rate in this scenario was faster than the
service rate; this simulates very busy hours with
service for average clients.
In the first experiment of this scenario, the
arrival rate is 3.5 times faster than the service rate,
therefore each 3.5 minutes a client can be served and
one client arrives every minute. This service rate
was chosen to be a bit greater than the expected time
of attention mean, in order to simulate serving delay
depending on the client’s profile. In eight hours, 480
clients arrived and were served.
The system began with one cashier open and
because of the difference in the arrival and service
rates; more cashiers were almost immediately
needed. We observed that the system opened
cashiers one by one, and the clients waited a long
time until enough cashiers for the service rate given
were available. Five cashier agents opened in total,
to speed up the service.
Figure 7 shows how as waiting times increase,
new cashier agents start improving clients’ waiting
times momentarily until the fifth cashier opened and
KEOD 2010 - International Conference on Knowledge Engineering and Ontology Development
246
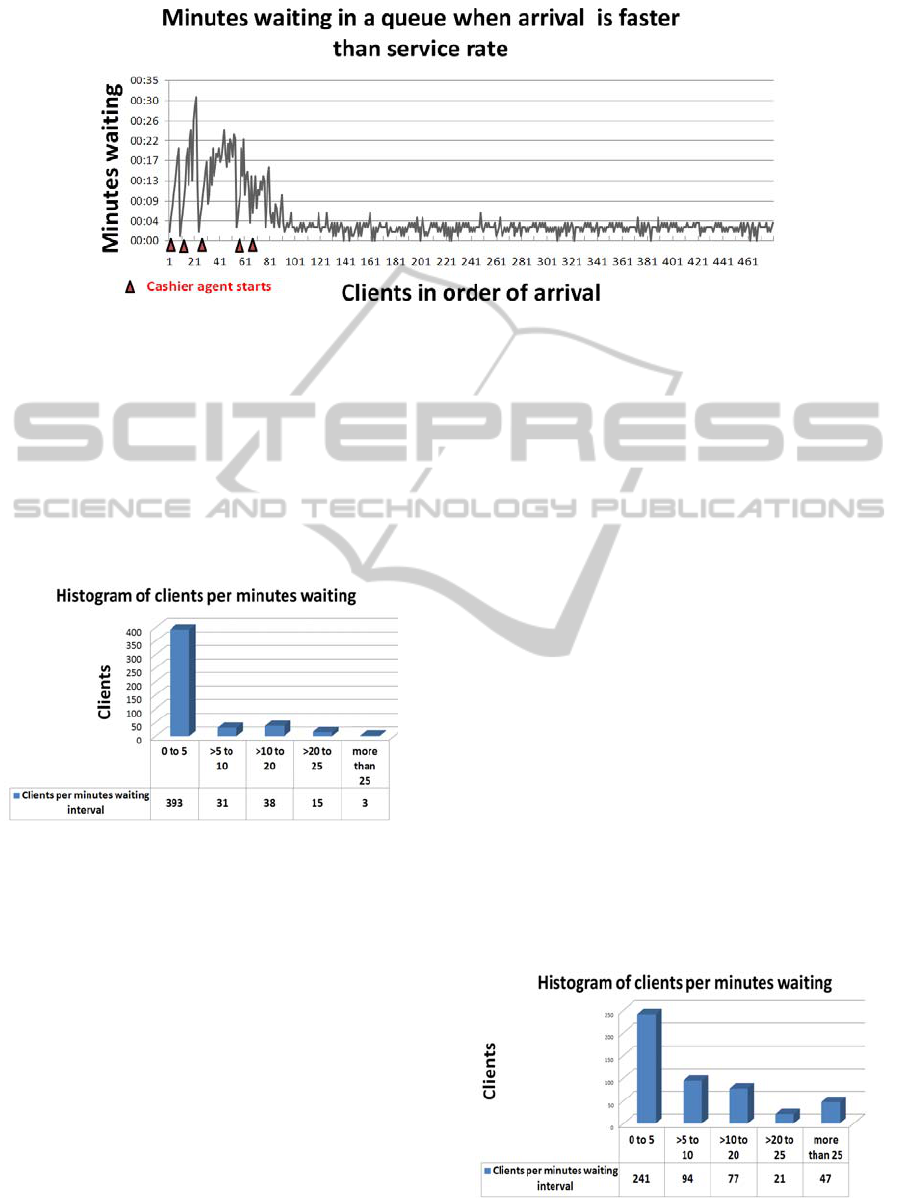
Figure 7: Minutes waiting in a queue in the second scenario.
stabilized the system. Notice that the small triangles
on the bottom show when a cashier agent start. Once
the required cashier agents provided the service,
every client was attended in less than ten minutes.
Analyzing the frequency of clients’ waiting
minutes in different intervals, we observe that the
grand majority of the clients waited up to five
minutes, however 3% of the clients waited more
than 20 minutes.(Figure 8).
Figure 8: Histogram of clients per minutes waiting in the
second scenario.
6.3 Worst Scenario: Clients with High
Expected Time of Attention in a
Very Busy Day
In this scenario we wanted to simulate what would
happen if, due to their profile and number of
transactions, all clients required a great deal of time
to be served and the number of clients was also
large.
We programmed the arrival rate to be one client
per minute and service rate so that every five
minutes one client can be served. The service rate is
calculated considering that the expected time of
attention mean is 3.04 minutes with a standard
deviation of 1.97. We added the mean plus the
standard deviation in order to simulate that all
clients will take more than the average time to be
served, approximately 5 minutes.
As the difference between the arrival rate and the
service rate was much larger, the system took longer
to stabilize. Six cashier agents were open altogether.
In the mean time, 68 clients out of 480 had to wait
more than 20 minutes as a result of the lack of
enough cashiers for the arrival rate given (figure 9).
Specifically 14.166% of the clients waited more than
the allowed 20 minute policy. In the worst case, a
client waited up to 48 minutes.
If we compare the graphic of minutes waiting in
the second scenario (figure 7) with the same graphic
for the worst scenario (figure 10) we can see that as
the gap between the arrival and service rates grows,
the system needs more time to stabilize. The
importance of opening the right number of cashier
agents as fast as possible is evident.
In order to choose the right number of cashiers
required, three important factors have to be
considered: the arrival rate, the service rate, and the
cashier’s expected occupation time. Actually, the
next cashier agent opens if all the currently active
cashier agents reject a new proposal for assigning a
client.
Figure 9: Histogram of clients per minutes waiting in the
worst scenario.
AN ONTOLOGY DRIVEN MULTI-AGENT SYSTEM FOR CLIENT ASSIGNMENT IN A BANK QUEUE
247
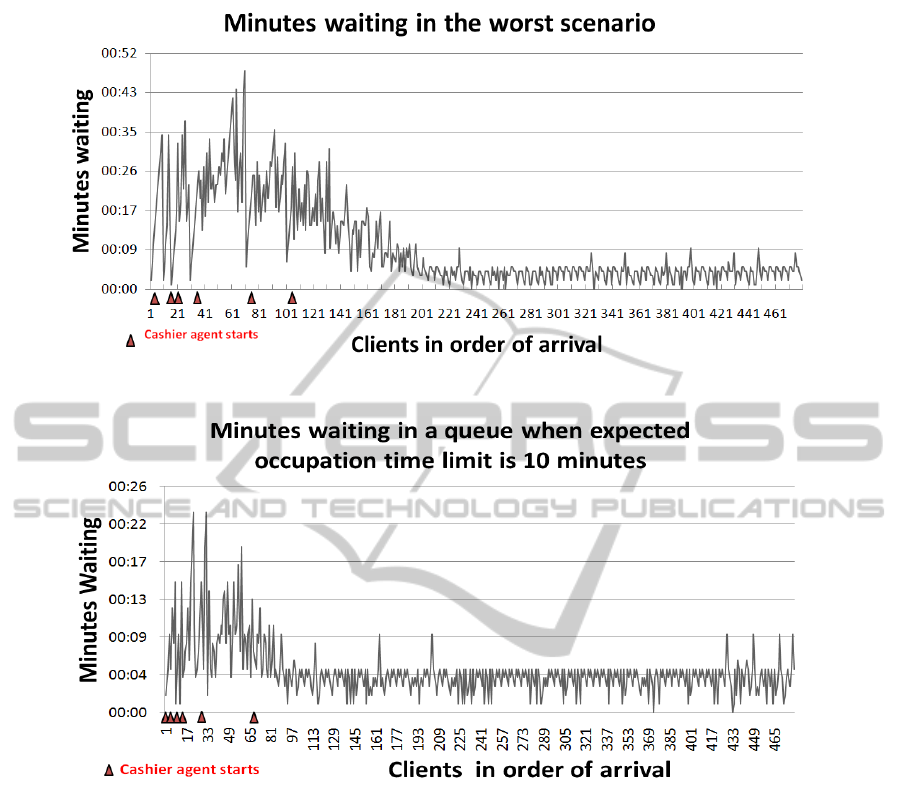
Figure 10: Minutes waiting in a queue in the worst scenario.
Figure 11: Minutes waiting in a queue in the worst scenario with 10 minute limit in the expected occupation time.
As we described earlier, when the cashier agent’s
expected occupation time (equation 3) is more than
20 minutes, the agent rejects every new proposal
received. Therefore, if we want the system to open
new cashier agents more rapidly, this parameter can
be lowered.
6.4 Other Experiments
With the purpose of verifying the impact of a lower
expected occupation time, we conducted an
experiment with the same parameters for the worst
scenario but we changed the expected occupation
limit for the cashier agents to 10 minutes instead of
20. The results are presented in figure 11.
In this simulation, six cashier agents were
opened; the same number of cashier agents as the
simulation with 20 minutes expected occupation
time limit. Although the cashier agents started
earlier as we expected, due to the clients’ profile and
number of transactions, the system took more time
to stabilize.
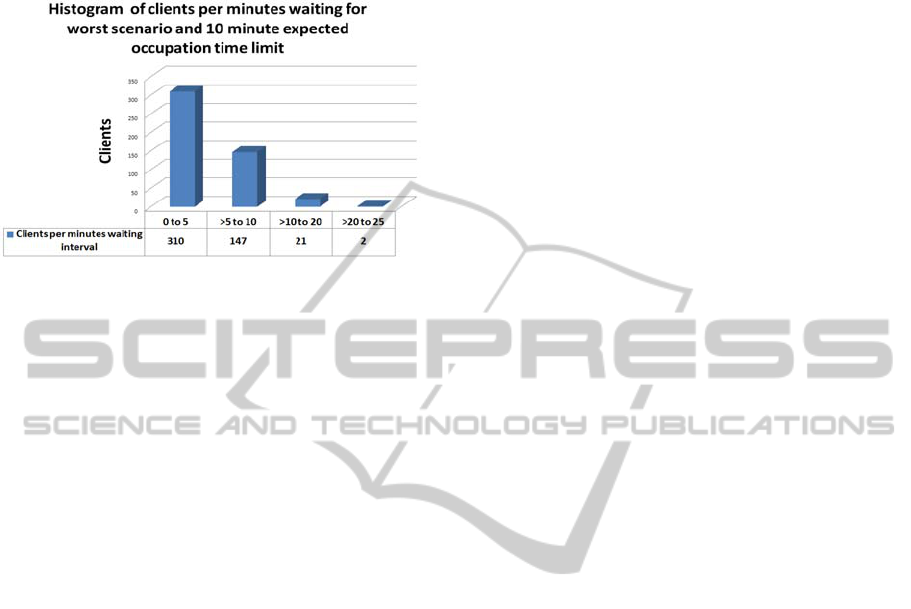
We can assume from this experiment that the
resources i.e. cashier agents, needed for given arrival
and service rates are the same, for instance, six
cashier agents in this example. The expected
occupation time limit impacts the results starting the
cashier agents earlier therefore the occurrence of
clients waiting more than 20 minutes decreases.
Only two clients out of 480 waited more than 20
minutes, representing 0.417%. (Figure 12)
From this last experiment we observe that it is
likely to fulfill the goal with little percent of error
but resources, i.e. cashier personnel have to be
allocated, as soon as the arrival rate increases. In real
life situations, the cost of allocating resources to
KEOD 2010 - International Conference on Knowledge Engineering and Ontology Development
248
serve versus the institution commitment to the
quality of service wanting to provide must be
evaluated and balanced.
Figure 12: Histogram of clients per minutes waiting in the
worst scenario and 10 minutes expected occupation time
limit.
7 CONCLUSIONS AND FUTURE
WORK
In this paper we presented a Multi-agent system
based on an ontology that simulates the service
provider’s management and the assignment of
clients in a bank branch. Experiments and simulation
of cashier agents’ management were presented.
The results of our experiments show three
factors that are important to consider in fulfilling the
20 minute waiting time policy to guarantee the
quality of service: 1) the arrival rate, 2) the service
rate, and 3) the service provider workload
determined by the expected occupation time of each
cashier or executive. Regarding the arrival rate, it
can be predicted; however this is not in the scope of
this paper. The service rate depends on the client’s
profile and the number of transactions. We presented
a way to evaluate the expected time of attention for
each client in order to estimate the service rate,
assign the client to a queue, and simulate the clients
been served. The expected occupation time for each
cashier is calculated from the expected time of
attention of its clients, thus, each cashier agent
workload is estimated. The use of the resources, i.e.
starting and closing cashier agents, is determined by
the state of all cashier agent queues.
We develop a client profiling ontology with the
purpose of cooperation and negotiation between the
manager agent and service agents. It proved to be
useful when sharing content and performing
semantic checks. The client’s profile can be
modified adding new attributes relevant to this
domain.
Some upgrades to the initial version can be made
for a more realistic aid in decision-support on client
assignment. In order to establish the most significant
characteristics for each strategic bank service a
feature analysis of client attributes can be made.
This analysis would help to enhance and improve
client’s profile as well as construct service ontology
To conclude, a bank branch can fulfil a 20
minute waiting time policy better manage its
resources, and improve the quality of service by
estimating the expected attention time according to
the client’s profile and the number of transactions
Our experiments show that it is possible to fulfil the
20 minute waiting time policy if the institution
designates the resources needed as soon as the
arrival rate increases. The decision maker has to
confront the cost of the resources versus the quality
of service promised.
In the future we expect to develop new queue
models using improved client profiles, using just one
queue, or reassigning a client if the agent discovers
that one or more of its clients are close to 20 minutes
waiting.
The system is designed to admit serving the
clients with other priorities instead of always using
First-come, First-served (FCFS) service discipline.
This is possible using the interactive interface but
exhaustive experiments must be done.
In addition, a reinforcement learning model
where the manager agent learns based on cashier
agents’ performance could be implemented. Adding
criteria other than the queue workload to the
assignment decision
REFERENCES
Bellifemine, F., Poggi, A., Rimassa, G., 2001, Developing
multi-agent systems with a FIPA-compliant agent
framework, Software—Practice & Experience, v.31
n.2, p.77-97
Bellifemine,F., Poggi,A., Rimassa,G., 1999, “JADE - A
FIPA-compliant agent framework”, Proc In Fourth
International Conference on the Practical Application
of Intelligent Agent and Multi Agent Technology,
Pages: 97-108
Central de reclamos de autoridad de supervisión del
sistema financiero, February 2010, Recopilación de
Normas para Bancos y Entidades Financieras, Sección
2: Atención de Clientes y Usuarios en Cajas, Art. 4º.
Tiempo de espera máximo, Bolivia.
Chen,H., Sui, Y., June 2009, "Ontology driven multi-agent
system to support service marketing of the publishing
house," icsssm, pp.641-645, In 6th International
Conference on Service Systems and Service
Management
AN ONTOLOGY DRIVEN MULTI-AGENT SYSTEM FOR CLIENT ASSIGNMENT IN A BANK QUEUE
249

Harvey,T., Decker,K., and Carberry, S.,2005, ”Multi-
agent decision support via user-modeling”, In
Proceedings of the fourth international joint
conference on Autonomous agents and multiagent
systems, July 25-29, The Netherlands
Jin,X., Zhou,Y., Mobasher,B., September 2000,
”Integrating Web Usage and Content Mining for More
Effective Personalization”, In Proceedings of the
International Conference on E-Commerce and Web
Technologies (ECWeb2000), Greenwich, UK.
NoticiasOnline.org, Consulted:.May 18th, 2010, In El
Diario de Patagonia Online, San Martin de los Andes,
http://www.noticiasonline.org/index.php?option=com_
content&view=article&id=1463%3Acolas-no-mas-de-
30-minutos-en-
euquen&catid=22%3Aactualidad2&Itemid=7,
Protege, http://protege.stanford.edu, Consulted: May
18
th
,2010, Stanford Center for Biomedical Informatics
Research at the Stanford University School of
Medicine.
Sieg,A., Mobasher,B., Burke,R., 2007, ”Web search
personalization with ontological user profiles”, In
CIKM \'07: In CIKM '07: Proceedings of the sixteenth
ACM conference on Conference on information and
knowledge management, pp. 525-534.
So, C.F., Chapmann C.L. Lai, and Raymond Y.K. Lau,
2009, “Ontological User Profiling and Language
Modeling for Personalized Information Services”, In
Proceedings of the 2009 IEEE International
Conference on e-Business Engineering,Pages: 559-
564
van Aart, C.J.. Beangenerator, 2002,
http://protege.cim3.net/cgi-bin/wiki.pl?Ontology
BeanGenerator.
KEOD 2010 - International Conference on Knowledge Engineering and Ontology Development
250
