
MULTI-MODAL ANALYSIS OF COMPLEX NETWORK
Point Stimulus Response Depending on its Location in the Network
Takeshi Ozeki, Teruhiko Kudo
Faculty of Science and Technology, Sophia University, 7-1 Kioicho, Chiyodaku, Tokyo,102-8554, Japan
Yosuke Takeda
Facultyof Economics, Sophia University, 7-1 Kioicho, Chiyodaku, Tokyo, 102-8554, Japan
Keywords: Adjacency matrix, Multi-modal Analysis, Markov transition, Euclidian Norm.
Abstract: We report a new method of diagnosis of a node in a network by “Point Stimulus Response”. The “Point
Stimulus Response” corresponds to the impulse response of the network, that is, the state temporal variation
in the Markov transition with the delta-function of initial state. We can evaluate the reaction of the system
against a point stimulus such as a point failure. In this report, for the first, we summarize our mathematical
platform for analysing complex network system using the adjacency matrix as the transition matrix in
Markov transition approximation. On this basis, we formulate the point stimulus response. The location
dependence of the point stimulus response is demonstrated in Tokyo Metropolitan Railway Network System.
For a concrete example, the total amount of suffered passengers and time response of recovery from a point
failure will be discussed depending on the location of point failure in the network system. It can be said that
a way to find a point for effective stimulus response is one of key approaches for knowledge discovery.
However, the real indication or meaning of the point stimulus is in the stage of speculation.
1 INTRODUCTION
Knowledge Discovery is an interdisciplinary area
focusing upon methodologies for identifying valid,
novel, potentially useful and meaningful patterns
from data, often based on underlying large data sets.
Our mathematical platform is aiming extraction and
analysis of knowledge from the mutual interaction
patterns, obtained by such network log data (Onnela,
2008). The mutual interaction pattern is described as
the adjacency matrix in the Markov process
approximation (Ozeki, 2010).
Brin and Page reported, in their first paper on
“Google”(Page, 1990), that it was a great surprise
the PageRank is obtained purely mechanically from
the pattern of mutual page links. That is the surprise
of discovery that the pattern is entangled with the
real world. The “Google” approximates a Web
surfer as a random walker in the Markov process and
combines the dominant eigenvector with the list of
coincidence as the PageRank .
The “Google”, however, uses only the dominant
eigenmode because the eigenvectors of higher-order
modes are not positive valued so that the probability
finding the Web surfer at a page cannot be defined
for the higher-order modes (Langville, 2006).
Here, we have proposed a mathematical platform
for analysing the network pattern in multi-modal
scheme (Ozeki, 2009). Each mode corresponds to a
substructure of the pattern. Various pattern
dependant behaviours can be analysed for
knowledge discovery.
In this paper, we would like to report a new
method for the diagnosis of various objectives, such
as security and activation, of a network system by a
“Point Stimulus Response”.
The “Point Stimulus Response” corresponds to
the impulse response of the network system, that is,
the state variation in the Markov transition with the
delta-function of initial state. We can evaluate the
system activity against the point stimulus.
It can be said that a way to find a point of
effective stimulus response or “tsubo” is one of the
key approaches of “Knowledge Discovery”.
In Japan, “Shiatsu” is a popular therapy by
pressing “shiatsu point” to enhance the body’s
226
Ozeki T., Kudo T. and Takeda Y..
MULTI-MODAL ANALYSIS OF COMPLEX NETWORK - Point Stimulus Response Depending on its Location in the Network.
DOI: 10.5220/0003090302260231
In Proceedings of the International Conference on Knowledge Discovery and Information Retrieval (KDIR-2010), pages 226-231
ISBN: 978-989-8425-28-7
Copyright
c
2010 SCITEPRESS (Science and Technology Publications, Lda.)

natural healing ability and prevent the progression of
disease. Shiatsu points are called “tsubo”, in
Japanese and their locations and effects are based on
understanding of modern anatomy and physiology.
The concept of “tsubo” is our stimulus point of the
network system.
The point stimulus has been used as a way of
reactivation of an old city (Horiike, 2002).
This report is believed as the first theoretical
approval of locating stimulus points of a network
system.
2 MATHEMATICAL PLATFORM
In this session, we would like to summarize our
mathematical platform for network system analysis,
briefly.
2.1 Adjacency Matrix
The adjacency matrix
ji
A
,
of a network can be used
as a Markov-transition matrix to simulate the
evolution of states:
nn
qAq )
ˆ
()
ˆ
(
1
⋅=
+
where
n
q)
ˆ
(
is
the probability amplitude vector of the state at the n
th
transition step. The probability amplitude is
normalized with respect to the Euclidean norm after
each transition step by application of
1
2
0
|( ) | 1
N
in
i
q
−
=
=
∑
,where
ni
q )(
is the
th
i component of
n
q)
ˆ
( . The probability
ni
p )(
of finding a random
walker at the node “
i “ is given by
2
|)(|)(
nini
qp =
.
The eigen-equation is
)()( m
i
m
m
i
A
φλφ
⋅=⋅
where
m
λ
is
the eigenvalue of mode “
m
” and
)(m
i
φ
is its
eigenvector; the eigenvectors form a complete
orthogonal basis under the assumption of a
symmetric adjacency matrix. This fact is the reason
of using the adjacency matrix as the transition
matrix in the Markov transition.
It should be noted that using a Markov process
normalized by the Euclidean norm makes it possible
to describe the network states in a multi-modal way.
Previously, in such systems as the Google search
engine (Langville, 2006) using a stochastic transition
matrix normalized by the 1-norm, higher order
modes cannot define the probability of finding a
random walker because the components of
eigenvectors are not always positive.
2.2 Non-linear Markov Transition
To examine multi-modal dynamics of the network,
we define a Markov transition with weak non-
linearity; a non-linear Markov process can be
formulated as follows: the transition coefficient from
node ”
j “ to node ”i” is affected by the probability
amplitude
nk
q )(
of node ”k” linked to node ”i”. Such
a non-linear Markov transition is given by
1, ,,
,
() () ()()
in ij jn ji ki jn kn
jjk
qAq AAqq
ν
+
=⋅+⋅⋅ ⋅
∑
∑
(1)
, where
ν
is a measure of the strength of the non-
linearity. Since the Markov property states that the
probability distribution for the system at the next
step depends only on the current state of the system,
the non-linear state transition given by equation (1)
indeed defines a Markov process. It is possible to
define higher-order non-linear interactions in a
similar way (Ozeki,2009). Since we have a complete
basis of orthogonal eigenvectors, the mode
amplitudes
1
()
0
() ()
N
m
mn in
i
i
aq
ϕ
−
=
=⋅
∑
can describe the
mode evolution of the system (Haken,1987).
2.3 Node, Mode and Network
Entropies
The entropy may be efficient measure of network
optimazation. We define three kinds of entropies
based on the Shanonn entropy (Shanonn,1948) using
the probability finding a random walker at each node.
The node entropy
i
NE
is defined by
22
()ln(())
mm
iii
m
NE
ϕϕ
=−
∑
that is the sum of the
Shanonn entropy -
22
)ln(()(
m
i
m
i
φφ
of node
i
over all
of mode m.The mode entropy
m
ME
is defined by
∑
−=
i
m
i
m
im
ME ))ln(()(
22
φφ
that is the sum of Shanonn
entropy of the mode
m
over all of node i. The
MULTI-MODAL ANALYSIS OF COMPLEX NETWORK - Point Stimulus Response Depending on its Location in the
Network
227
network entropy
GE
is defined by
im
im
GE NE NE==
∑∑
.
3 POINT STIMULUS
3.1 Formulation of “Point Stimulus
Response”
The point stimulus response is the impulse response
in the electronic circuit system: that is, the temporal
response stimulated by a delta-function provides the
network system characteristics. The point stimulus
response is defined by the temporal response in the
non-linear Markov transition for the positive point
stimulus;
),( piPPS
i
δ
=
, where node
""p
is a
location of stimulus. We found that the inverse or
negative delta function is more effective in some
network with particular symmetric nature. In a kind
of network having skew degeneracy (Ozeki,2010), a
negative point stimulus,
),( piNPS
i
δ
−=
is effective
to stimulated the mode competition among the skew
degenerate modes. In the following, for the first, the
positive point stimulus response is discussed by a
concrete network example and in later the negative
point stimulus response is discussed. The
stimulation of the mode competition between the
modes close to quasi-skew degeneracy is interesting
related to the potential activity or development of
nodes.
3.2 Diagnosis of Tokyo Railway System
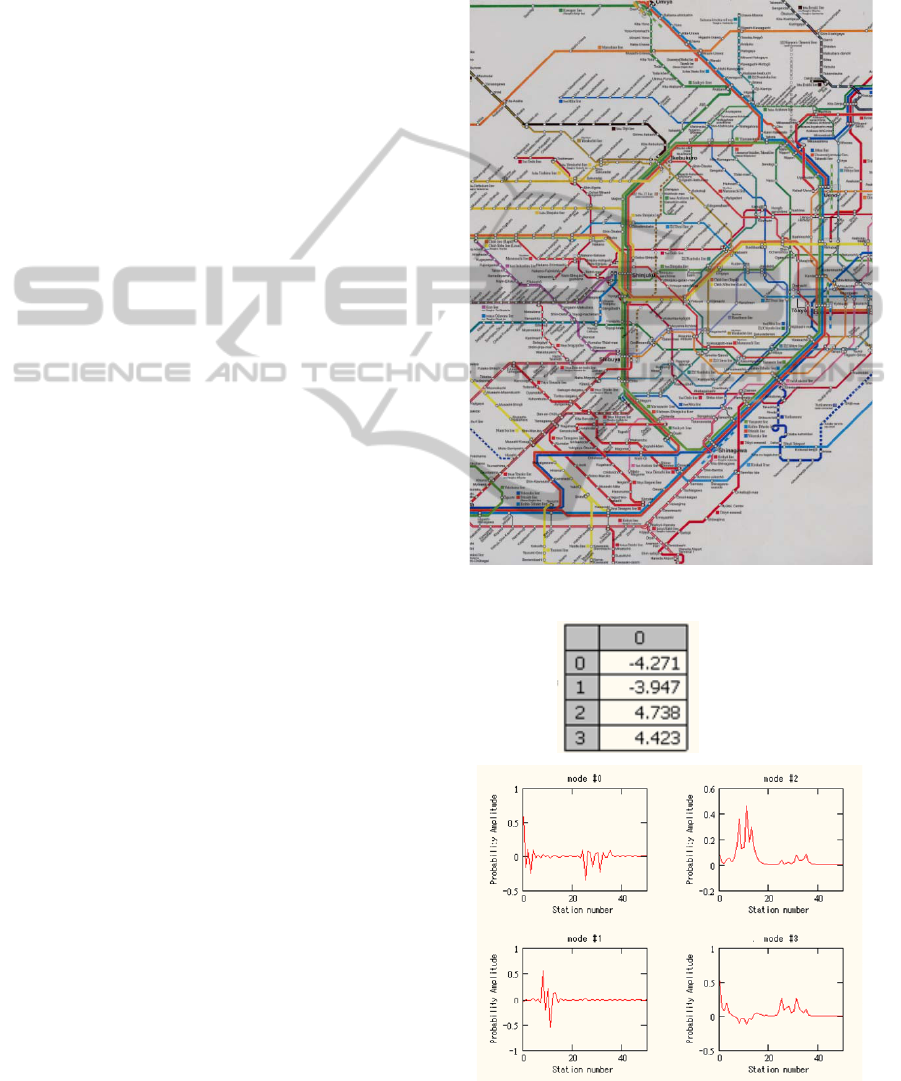
Fig.1 denotes the complexity of a central part of
Tokyo Railway System including subways. The
adjacency matrix is assumed to be symmetric and
the total number of stations (nodes) is truncated to
736 (Rail Map of Tokyo Area, 2004). A distorted
hexagonal in Fig.1 is “Yamanote Circular Line”
which includes several well-known stations such as
Tokyo, Akihabara, Ikebukuro, Shinjuku, Shibuya
and etc. Before the detail analysis of point stimulus
response, it seems better to summarize the mode
structure of the network. The list of eigenmode
naming and eigenvalue is shown the top of Fig.2.
The probability amplitude distributions of the
important four modes are shown in Fig.2. The
dominant mode with the largest positive eigenvalue
is named mode #2 of which probability amplitude is
positive. The mode # 0 has the largest negative
eigenvalue and its mode amplitude is similar with
that of mode #3, that is the mode with the second
largest positive eigenvalue. These mode relations are
important to understand the mode competition.
It is
our surprise that the probability distribution of the
Figure1: Tokyo Metropolitan Railway Network System.
Figure 2: Eigenmode naming, eigenvalue and eigenvectors.
KDIR 2010 - International Conference on Knowledge Discovery and Information Retrieval
228
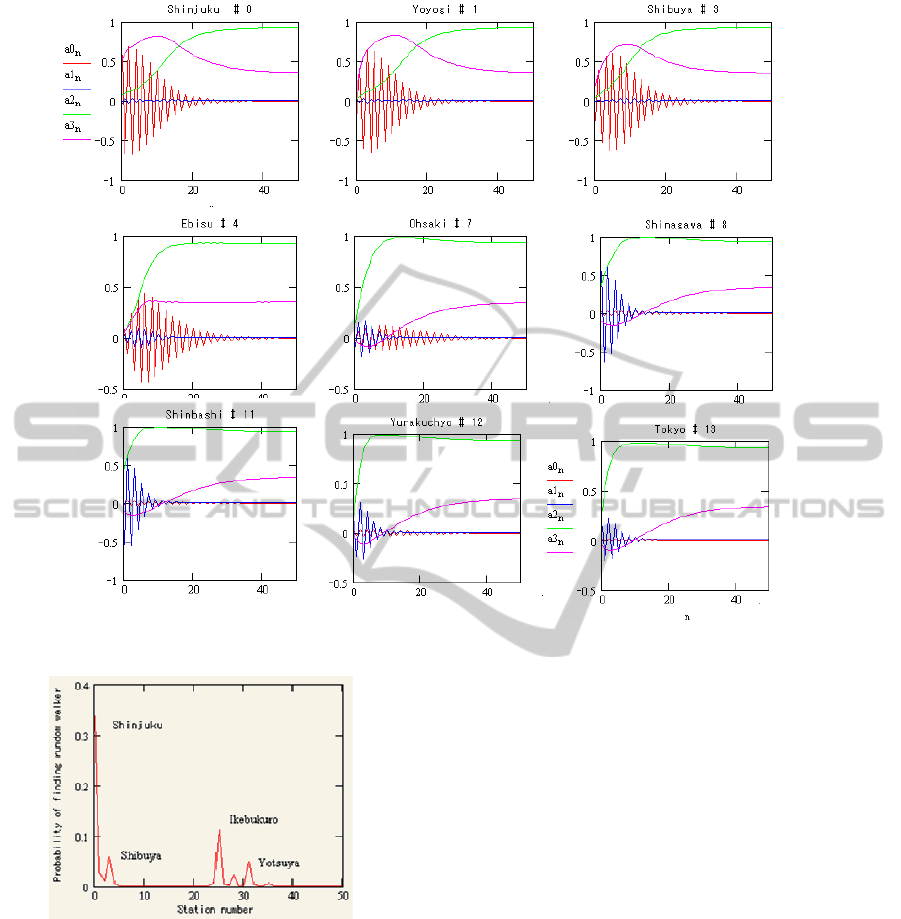
Figure 4: Location Dependence of Positive Point Stimulus Response.
Figure 3: Probability distribution of mode #0.
mode having the largest negative eigenvalue shown
in Fig.3 extract the world largest three stations from
viewpoint of number of passengers without any
passenger statistics. In Google-like matrix, the
dominant mode provides only the degree vectors.
3.3 Location-Dependent Positive
Point-Stimulus
We set the point stimulus on from Shinsjuku to
Tokyo, along the Yamanote-line in CCW. The point
stimulus responses of these stations calculated by the
non-linear Markov process are shown in panels of
Fig.4 with station name and code number. The
mode amplitude
nnnn
aaaa 3,2,1,0
correspond to the
mode #0,#1,#2 and #3, being shown in Fig.2. The
point stimulus responses of from Shinjuku #0 to
Ebisu #4 dominantly consist of damped oscillation
of mode #0 (red) and a quick build-up of mode #2
(green). The damped oscillation amplitudes decrease
toward Ebisu #4. On the other hand, in the point
stimulus responses of from Ohsaki#7 to Tokyo #13,
damped oscillation of the mode #1 denoted by blue,
becomes dominant, and the damped oscillation
amplitudes reach at the peak around Shinagawa #8
and Shinbashi #11.
3.4 Location-Dependent Negative
Point-Stimulus
Fig.5 denotes the negative point stimulus responses
For typical three stations: Shinjuku, Shibuya and
Tokyo. The bottom panels of Fig.5 show the
probability amplitude distribution
in
sp
,
finding a
random walker, calculated by the superposition of
MULTI-MODAL ANALYSIS OF COMPLEX NETWORK - Point Stimulus Response Depending on its Location in the
Network
229
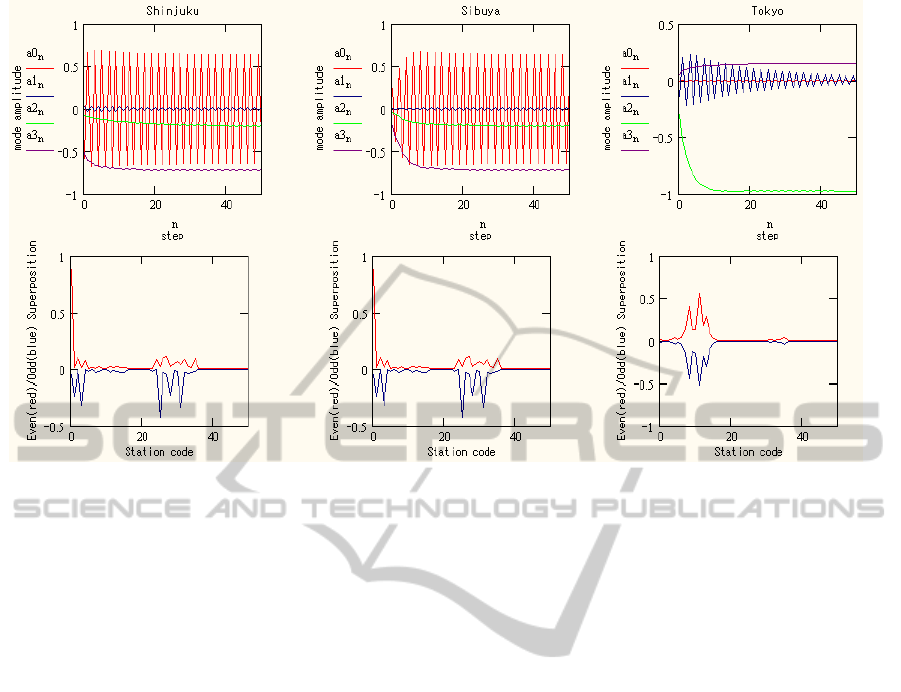
Figure 5: Location Dependant Point Stimulus Response.
modes using Eq.2. In the case of Shinjuku and
Shibuya, since the sustainable oscillation of mode #0
is observed, the probability distribution of finding
random walker also oscillates between the in-phase
superposition and the out-of-phase superposition,
just as shown in the bottom panels. The red line
denotes the in-phase superposition and the blue line
denotes the out-of-phase superposition. (Here, we
should note that the sign of out-of-phase
superposition is inverted for clear understanding.)
The distance between nodes included in red and blue
lines is only one link distance: For example,
Shinjuku (code #0) and Ikebukuro(code #25) in one-
link distance due to the Saikyo-line, so that the
random walker can transit between red/blue station-
groups within one step. In the case of Tokyo, the
superposition of modes of Eq.2 shows no temporal
variation after damped oscillation is vanished.
∑
⋅=
m
m
inmin
asp
φ
)(
,
(2)
3.5 Categorization of Point Stimulus
Response and Response Time
It is convenient to categorize the point stimulus
response into the following two: The point stimulus
response with the sustainable oscillation is named
“the infinite response point”. The point stimulus
response with the finite response is named “ the
finite response point”. The categorization of stations
within the Yamanote circular line is shown in the
bottom panels of Shinjuku and Shibuya, in Fig.5,
that is, the stations with larger probability amplitude,
such as Shinjuku, Yoyogi, Harajuku, Shibuya,
Ikebukuro, Shinohkubo and Yotsuya, are the
infinite response nodes. These are the stations within
one-link distance of Shinjuku and can be said as
satellite stations: The others are the finite response
nodes.
It should be noted that the build-up time of the
dominant mode #2 takes longer steps to reach the
stationary state due to the mode competition with
mode #0, in the case that the positive point stimulus
is applied to from Shinjuku to Ebisu, as shown
inFig.4. The response time of nodes in the network
is mainly determined by this mode competition. For
further study, the recovery time from the point
failure of the Tokyo Railway Network will be
analysed from these viewpoints.
4 POINT FAILURE OF
NETWORK SYSTEM
The point failure of the station in the Tokyo
Metropolitan Railway Network System is one of
concrete image of the point stimulus. We can
estimate the total suffered passengers as shown in
Fig.6 using the following;
KDIR 2010 - International Conference on Knowledge Discovery and Information Retrieval
230

∑
⋅⋅=
m
m
immi
MAstimulusS
φ
(3)
where
m
stimulus
is the projection of the positive
point stimulus
i
PPS
on the eigenvector
m
i
φ
. The total
number of suffered passengers denoted by red line is
rather independent of the location of point failure
compared with larger variation in the number of
passengers.
We feel that the number of suffered passenger
calculated seems rather larger than the reported
figures. Tokyo metropolitan railway system has a lot
of redundancy in it structure for reliable operation,
but we define the link topologically, that is, multiple
duplication of trucks between adjacent stations is
neglected. It is necessary to improve the accuracy of
the adjacency matrix expression.
Figure 6: Total number of Suffered Passengers.
5 CONCLUSIONS AND FUTURE
WORKS
We discuss on the multi-modal analysis method for
discovery of knowledge from pattern information.
We proposed a diagnosis tool of the point stimulus
response and demonstrated it in Tokyo Metropolitan
Railway Network system. The point stimulus is
effective to find interesting nodes to characterise the
system, such as the excitation sustainable oscillation.
It is not verified by physical data yet, but seems to
be a way of an approval of “Tsubo” in “shiatsu
therapy”.
As for future work, we would like to discuss on
the knowledge discovery based on pattern structure
embedded in data, automatically collected in the
network systems. It is believed that the adjacency
matrix obtained automatically, in such Facebook,
gives us interesting chances to analyse the social
substructures and their stability, using these new
knowledge discovery technology.
ACKNOWLEDGEMENTS
Author T.O. wishes to thank Dr.H.Kasai and
Dr.H.Horiike, architect, for their continuous
stimulus and advices.
REFERENCES
Barabasi, A L, (2002) “Linked”, Penguin Group, New
York
Haken, H, (1978) “Synergetics, An Introduction.
Nonequilibrium Phase Transitions and Self-
Organization in Physics, Chemistry and Biology”,
Springer, Berlin
Horiike, H.,(2002) private communication
Langville, A and Mayer, C, (2006), “Google’s PageRank
and Beyond”. Princeton University Press, Princeton
and Oxford.
Onnela, J.P.,Soramaki, J, Hyvonen, J, Szabo, G, Laser, D.,
Kaski,K., kertesz,J., and Barabasi,A.L.,
(2007),”Structure and Tie strengths in Mobile
Communication networks” PNAS:Vol 104 Issue 18,
June 2007, pp 7332-7336.
Ozeki, T, Kudo, T, (2009), Invited paper, IEICE Technical
Report, “A proposal of Network Evaluation Method
and Its Applications”,Vol 109. no.220, IN2009-65,
PN2009-24, pp13-21, 2009 Oct. at KDDI.
Ozeki, T., Takeda, Y.,Eguchi, N., and Kudo, T., (2010),
submitted to Nature.
Page, L., Brin, S, and Motwani, R., (1999) Stanford
InfoLab. Technical Report.
Rail Map of Tokyo Area (2004), Shoubunsha Publication,
Inc.,ISBN4-398-72008-1.
Shannon, C. E.(1948): “A Mathematical Theory of
Communications”, BSTJ vol.27,: pp.379-423,and pp.
623-656.
MULTI-MODAL ANALYSIS OF COMPLEX NETWORK - Point Stimulus Response Depending on its Location in the
Network
231
