
AUTOLSA: AUTOMATIC DIMENSION REDUCTION OF LSA FOR
SINGLE-DOCUMENT SUMMARIZATION
Haidi Badr
Electronics Researches Institute, Giza, Egypt
Nayer Wanas
Cairo Microsoft Innovation Lab, Cairo, Egypt
Magda Fayek
Department of Computer Engineeing, Cairo University, Giza, Egypt
Keywords:
LSA, Automatic dimension reduction ratio, Document-summarization.
Abstract:
The role of text summarization algorithms is increasing in many applications; especially in the domain of
information retrieval. In this work, we propose a generic single-document summarizer which is based on using
the Latent Semantic Analysis (LSA). Generally in LSA, determining the dimension reduction ratio is usually
performed experimentally which is data and document dependent. In this work, we propose a new approach to
determine the dimension reduction ratio, DRr, automatically to overcome the manual determination problems.
The proposed approach is tested using two benchmark datasets; namely DUC02 and LDC2008T19. The
experimental results illustrate that the dimension reduction ratio obtained automatically improves the quality
of the text summarization while providing a more optimal value for the DRr.
1 INTRODUCTION
Text Summarization is the process of taking one or
more information sources and presenting the most im-
portant content to a user in a condensed form. This
could be achieved in a manner sensitive to needs of
the user or application. While there are different types
of summarizers suggested in the literature, this work
is focused on automatic single-document generic and
extractive summaries.
Recently, Latent Semantic Analysis (LSA) has
been suggested as one of the promised approaches
used for text summarization(Yeh et al., 2005; Ding,
2005; Steinberger and Jezek, 2004; Steinberger and
Kristan, 2007; Gong and Liu, 2002). In this context,
LSA can be viewed as a way to overcome two major
challenges of text summarization, namely (i) sparse-
ness and (ii)high dimensionality. Eventually, the
LSA similarity is computed in a lower dimensional
space, in which second-order relations among terms
and texts are exploited. Moreover, it avoids using
humanly constructed dictionaries, knowledge bases,
semantic networks, grammars, syntactic parsers, or
morphologies. However, the conceptual representa-
tion obtained by LSA is unable to handle polysemy.
The problem of polysemy is related to common words
having potentially different meanings existing in dif-
ferent documents. In turn, words with different mean-
ing but co-occurring with the proper name may be
bound together in the semantic space even though
they do not have any relations with one another(Yeh
et al., 2005). Yeh et al. (Yeh et al., 2005) suggested
an approach for using the LSA with the Text Rela-
tionships Map (LSA+TRM) for summarization. The
combination between the LSA and the TRM leads to
an improvement in the summarization performance.
However, in the LSA+TRM, as in LSA in general,
determining the dimension reduction ratio is usually
performed experimentally, and in turn is data and doc-
ument dependent. In this work, we propose a new
approach to determine the dimension reduction ratio
automatically to overcome this problem.
444
Badr H., Wanas N. and Fayek M..
AUTOLSA: AUTOMATIC DIMENSION REDUCTION OF LSA FOR SINGLE-DOCUMENT SUMMARIZATION.
DOI: 10.5220/0003091904440448
In Proceedings of the International Conference on Knowledge Discovery and Information Retrieval (KDIR-2010), pages 444-448
ISBN: 978-989-8425-28-7
Copyright
c
2010 SCITEPRESS (Science and Technology Publications, Lda.)

2 LSA FOR SUMMARIZATION
Using the LSA for text summarization is performed
through four main steps, namely; (1) constructing the
word-by-sentence matrix, (2) applying the Singular
Value Decomposition (SVD), (3) dimension Reduc-
tion (DR), and finally (4) sentence selection for sum-
marization. In the following, we will shed more light
on each of these steps.
1. Constructing the Word-by-sentence Matrix. If
there are m terms and n sentences in the docu-
ment, then the word-by-sentence matrix A will be
m × n matrix. The element a
i j
in this matrix is de-
fined as: a
i j
= L
i j
× G
i j
, where a
i j
is the element
of word w
i
in sentence s
j
, L
i j
is the local weight
for term w
i
in sentence s
j
, and G
i j
is the global
weight for term w
i
in the whole document. The
weighting scheme suggested by the LSA+TRM
algorithm, thereon referred to as Original Weight-
ing Scheme (OWT), is given as follows
L
i j
= log(1 +
t
i j
n
j
), (1)
G
i j
= 1 − E
i
(2)
E
i
= −
1
logN
N
∑
j=1
t
i j
× logt
i j
, (3)
where t
i j
is the frequency of word w
i
in sentence
s
j
, n
j
is the number of words in sentence s
j
, E
i
is
the normalized entropy of word w
i
, and N is the
total number of sentences in the document. Stein-
berger et al. (Steinberger et al., 2007) studied the
influence of different weighting schemes on the
summarization performance. They observed that
the best performing local weight was the binary
weight and the best performing global weight was
the entropy weight as follows:
L
i j
=
(
1 if w
i
occurs in sentence s
j
0 Otherwise
(4)
G
i j
= 1 −
∑
j
P
i j
× logP
i j
logN
, (5)
where P
i j
= t
i j
/g
i
, g
i
is the total number of times that
term w
i
occurs in the whole document D. We refer to
this technique as the Modified Weighting Technique
(MWT). A comparative study between the two dif-
ferent weighting schemes is conducted to study the
effect on the summarization performance. The result
shows that the MWT gives its best performance with
the high dimension reduction as well as the low di-
mension reduction. We will focus on using the MWT,
since we implemented the LSA to get its benefits in
the dimension reduction phase.
1. Applying the SVD. The SVD of an m × n
matrix A is defined as: A = U ΣV
T
, where
U is m × n column-orthonormal matrix, Σ =
diag(σ
1
,σ
2
,...,σ
n
) is n × n diagonal matrix,
whose diagonal elements are non-negative singu-
lar values sorted in descending order and V is
n × n orthonormal matrix. The SVD decomposi-
tion can capture interrelationships among terms,
therefore that terms and sentences can be clus-
tered on a “semantic“ basis rather than on the ba-
sis of words only.
2. Dimension Reduction. After applying the SVD
decomposition, the dimensionality of the matri-
ces is reduced to the r most important dimensions.
The initial Dimension Reduction ratio (DRr) is
applied to the singular value matrix Σ. The DRr
reflects the number of LSA dimensions, or topics,
to be included. If few dimensions are selected,
the summary might lose important topics. How-
ever, selecting too many dimensions implies in-
cluding less important topics which act as a noise
and affect negatively the performance. Dimension
reduction can be useful, not only for reasons of
computational efficiency, but also because it can
improve the performance of the system. The DRr
in most cases is selected manually, which we refer
to as Manual Dimensionality Reduction (MDR).
3. Sentence Selection for Summarization. In this
step the summary is generated by selecting a
set of sentences from the original document.
The LSA+TRM uses the text relationships map
(TRM) for sentence selection through reconstruc-
tion the semantic matrix A
’
using the new reduced
dimensions. The similarity between each pairs of
sentences is calculated using the cosine similarity
between the semantic sentences representation. If
the similarity exceeds a certain threshold, Sim
th
,
this pair of sentences are semantically related and
are linked. The significance of a sentence is mea-
sured by counting the number of valid links for
each sentence. Yeh et al. (Yeh et al., 2005) use
Sim
th
= 1.5 × N to decide whether a link should
be considered as a valid semantic link. A global
bushy path is then established by arranging the k
bushiest sentences in the order that they appear
in the original document. Finally, a designated
number of sentences are selected from the global
bushy path to generate a summary.
Two main drawbacks of the LSA+TRM are:
1. Determining the DRr manually is data dependent,
and is conducted based on an experimental evalu-
ation of ratios from 0.1 × N to 0.9 × N. However,
datasets usually has different documents with dif-
AUTOLSA: AUTOMATIC DIMENSION REDUCTION OF LSA FOR SINGLE-DOCUMENT SUMMARIZATION
445
ferent structures that have different optimal ratios.
Therefore, the test should be performed for each
document to get the best ratio for each document
which is not applicable.
2. The TRM requires a threshold to check the valid-
ity of the link between two sentences to calculate
the significance of each sentence. Moreover, this
threshold is also data dependent.
The main contribution of this paper is to propose
a summarizer for tackling the drawbacks of the
LSA+TRM.
3 AUTOLSA: AUTOMATIC
DIMENSION REDUCTION FOR
LSA
The algorithm proposed in this work, AutoLSA, en-
hances the performance of text summarization us-
ing the LSA+TRM approach. We used two differ-
ent datasets in this experimental study, namely, (i)
DUC02 dataset
1
and (ii) LDC2008T19 dataset
2
. The
DUC02 dataset contains 250 documents and each
document attached with two different human sum-
maries. On the other hand we selected 300 documents
from the LDC2008T19 dataset attached with their as-
sociated human summaries. The Recall, Precision
and F
1
measure are used to judge the coverage of both
the manual and machine generated summaries. All
our experiments are done with Compression Ratios
(CR) of 25%,30% and 40% for both dataset. More-
over, we performed a 5-folds cross-validation across
the datasets. We divided each set to subsets of 50 doc-
uments selected randomly. In the following, we ex-
amine the results of the experiments performed using
these datasets as follows:
3.1 The Effect of the Weighting
Technique on the Performance
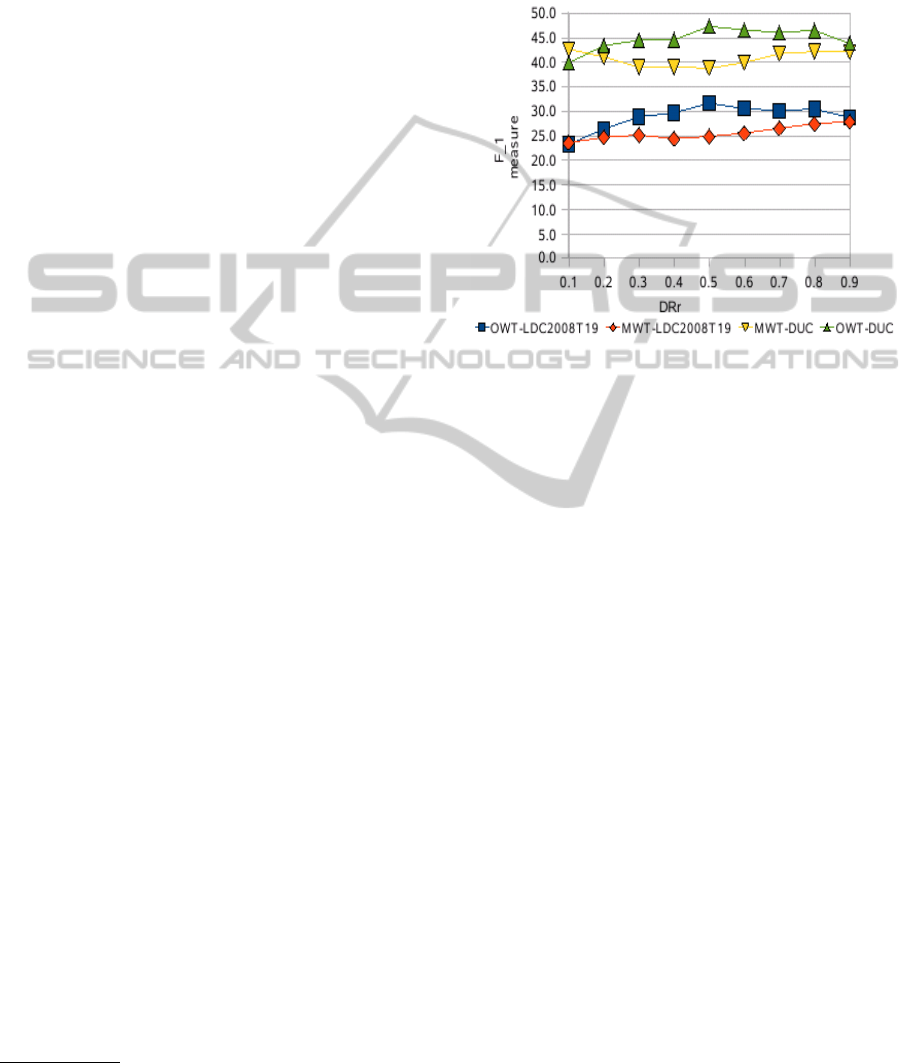
Figure 1 shows the performance of the MWT and
OWT using a CR of 40% for both the DUC02 and
LDC2008T19 dataset. It is worth noting that we
observe similar performance using other values for
CR, and these results have been omitted in favor of
space. The results illustrate that the MWT demon-
strates the best performance on extreme values when
applied to the DUC02 dataset (at DRr=0.1×N and
DRr =0.9×N). This is in contract to the performance
of OWT using different values of CR, which shows
1
http://duc.nist.gov.
2
http://www.ldc.upenn.edu.
the best performance at average DRrs, namely DRr
=0.5×N. While the performance of LDC2008T19
data using the OWT demonstrates the best perfor-
mance at average values of DRr (DRr =0.5×N), the
performance using the MWT is only better at high
values of DRr.
Figure 1: F
1
measure for the LDC2008T19 and DUC02
dataset using MWT and OWT at CR=40%.
3.2 Semantic Similarities Aggregation,
SSA, for Sentence Scoring
As mentioned previously, the LSA+TRM algorithm
manually selects a threshold, Sim
th
, to check the va-
lidity of the link between two sentences to calcu-
late the significance of the sentence. Instead of ob-
taining a threshold, we used the similarities aggrega-
tion between the semantic representation of the sen-
tence and all other sentences as indicating signifi-
cance for that sentence. Accordingly, we relax the
requirements of selecting a threshold. We compare
the semantic similarities aggregation (SSA) to the
performance of the LSA+TRM. For each sub-set we
have experimented with Sim
th
ranges from 1.5 × N to
0.0001 × N,and the optimal threshold value for this
sub-set is determined. The experiments show that,
the optimal Sim
th
differs from one sub-set to another.
AutoLSA achieves an F
1
measure of 37.2 and 36.0
on the DUC02 and LDC2008T19 respectively. Us-
ing the LSA+TRM achieves a performance of 33.1
for both data sets using a threshold Sim
th
of 0.005 and
0.001 for the DUC02 and LDC2008T19 datasets re-
spectively. These results show that using the SSA not
only relaxes the requirements to set a threshold for
sentence selection, but also contributes positively to
the overall performance.
KDIR 2010 - International Conference on Knowledge Discovery and Information Retrieval
446
3.3 Automatic Dimension Reduction
Ratio (ADRr)
Steinberger et al. (Steinberger et al., 2007) proposed
a method to calculate the DRr automatically by us-
ing the summarization ratio DRr = CR/100× N. Em-
pirical results show that this method is not efficient
across different datasets. Alternatively we propose
three methods for determining the ADRr namely;(1)
1-dimension only, (2) 1-or-2 dimensions and (3) log
of accumulated concepts.
1. First Dimension Only (FDO): The first dimension
of the matrix Σ is selected.
2. First Two Dimensions Only (FTDO): The sec-
ond dimension is retained only if the Accumu-
lated Concepts of the second dimension (ACon
2
)
exceeds a threshold C
AC
. In this study we have
experimented in this study with the value of C
AC
set at 0.3-0.6. Selecting values of C
AC
less than
0.3 implies that the summary covers a very lim-
ited amount of information, while when it is larger
than 0.6, only one dimension is selected.
3. Log of the Accumulated concept (LAC): In this
method we define the importance of certain di-
mension based on the gain accumulated by each
concept. The dimension i is important if
log(X
i
) > C
ADR
, (6)
where X
i
=
ACon
i
i
, ACon
i
is the accumulated con-
cept that captured at dimension i and C
ADR
is a
constant. In this study we investigated the perfor-
mance of the algorithm using different values for
C
ADR
ranging from 1.3 to 1.6. Lower values of
C
ADR
reflect the limitation of the amount of infor-
mation accepted for the summarization, while val-
ues larger than 1.6 limits the selection to the first
dimension and causes a saturation in the results.
Table 1 illustrates the average F
1
performance using
different values for C
AC
and C
ADR
with CR=40% on
the five-fold cross validation. It is worth noting that
the standard variation of the results ranged from 1.1
to 3.0. Experimental results indicate that the optimal
value of C
AC
and C
ADR
are 0.6 and 1.5 respectively.
Finally, selecting the first dimension alone has
demonstrated the Recall/Precision/F
1
measure val-
ues of 51.5 ± 1.1/38.2 ± .4/43.04 ± 1.3and 59.1 ±
3.4/20.6 ± 2.2/28.6 ± 2.6 for the DUC02 and
LDC2008T19 datasets respectively @CR=40%.
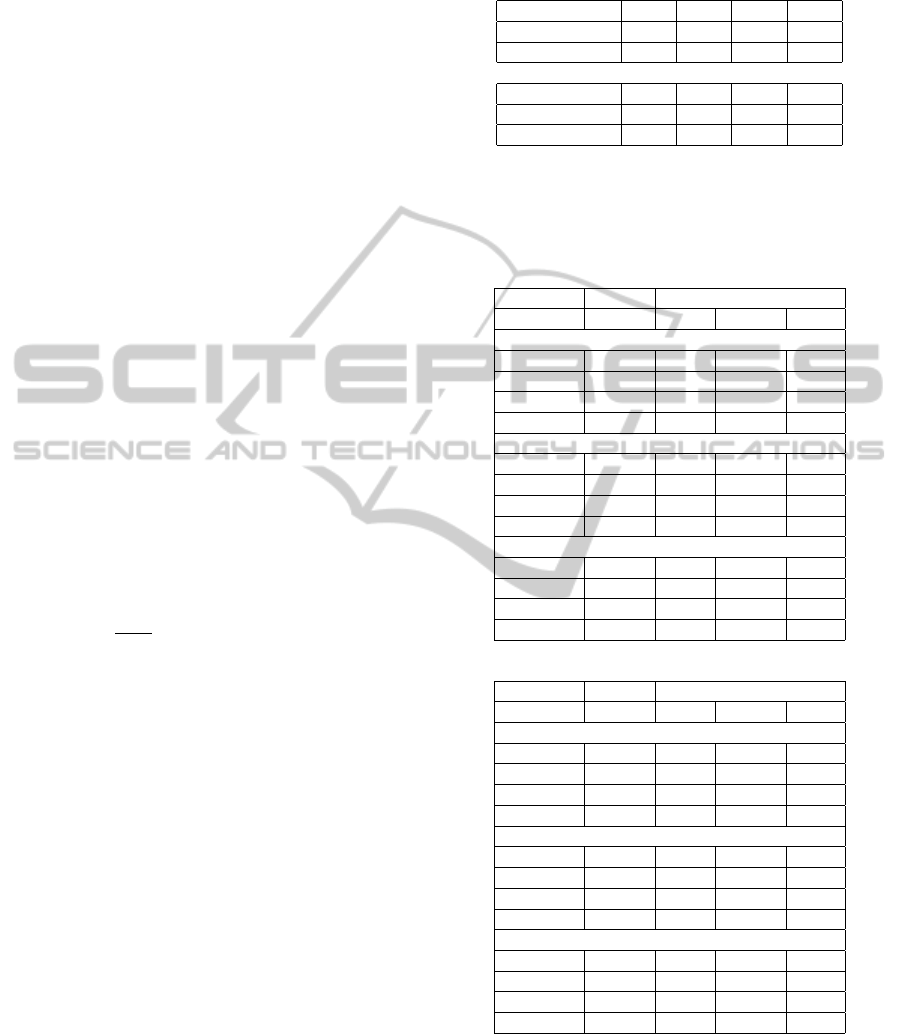
3.4 Overall Performance
Table 2 summarizes the average recall, Precision and
F
1
measure using the best DRr value for the three
Table 1: F
1
measure for different values of (a)C
AC
and (b)
C
ADR
@ CR=40% for DUC02 and LDC2008T19 dataset.
C
AC
0.3 0.4 0.5 0.6
DUC02 41.6 43.5 44.2 44.3
LDC2008T19 27.5 28.7 28.6 28.7
(a)
C
ADR
1.3 1.4 1.5 1.6
DUC02 43.2 44.3 44.4 44.4
LDC2008T19 28.2 28.2 28.9 28.9
(b)
Table 2: Recall, Precision and F
1
measure for the (i) MDRr,
(ii) FDO, ( (iii) FTDO with C
AC
= 0.6 and (iv) LAC using
C
ADR
= 1.5 for (a) DUC02 dataset and (b) LDC2008T19 at
different values for CR.
MDRr ADRr,
FDO FTDO LAC
CR=25%
DRr 0.90 0.05 0.05 0.05
Recall 30.9 32.3 32.4 32.3
Precision 39.9 41.5 41.6 41.5
F
1
32.8 34.3 34.3 34.3
CR=30%
DRr 0.9 0.05 0.05 0.05
Recall 32.6 40.4 39.9 39.9
Precision 36.4 42.2 43.5 43.5
F
1
32.8 39.0 39.3 39.3
CR=40%
DRr 0.90 0.05 0.05 0.05
Recall 43.4 48.7 49.3 49.6
Precision 37.8 41.5 41.9 41.8
F
1
39.5 43.8 44.3 44.4
(a)
MDRr ADRr,
FDO FTDO LAC
CR=25%
DRr 0.90 0.04 0.05 0.05
Recall 41.3 41.0 41.0 41.0
Precision 23.0 22.6 22.6 22.6
F
1
28.4 28.0 28.0 28.0
CR=30%
DRr 0.90 0.04 0.04 0.04
Recall 45.9 47.6 47.4 47.6
Precision 22.2 22.6 22.2 22.6
F
1
27.7 28.2 28.1 28.3
CR=40%
DRr 0.90 0.04 0.05 0.04
Recall 57.0 59.1 59.3 59.4
Precision 20.2 20.6 20.7 20.9
F
1
27.8 28.6 28.7 28.9
(b)
ADRr methods and the MDRr. We selected the best
parameters for each method. It is worth noting that
the standard deviation across the five folds cross vali-
dation was limited to the range from 1.0 − 3.7 for all
the values.
AUTOLSA: AUTOMATIC DIMENSION REDUCTION OF LSA FOR SINGLE-DOCUMENT SUMMARIZATION
447

We note that for the DUC02 dataset both the LAC
and the FTDO criteria demonstrate performance bet-
ter that the optimal MDRr. It is also notable that at
low CR, all the methods select only the first dimen-
sion and hence produce similar results. Moreover the
Recall and F
1
measures improve with the increase of
CR, as opposed to the Precision which decreases in
this case. In addition, the differential improvement
over the MDRr increases with the higher CR. A sim-
ilar performance can be seen on the LDC2008T19
dataset, where the relative difference is smaller com-
pared to the DUC02 dataset. The Log of the Accu-
mulated concepts is slightly better than the other ap-
proaches and produces improved results compared to
the MDRr with a huge reduction in the DRr.
We selected the best parameters for each method.
4 CONCLUSIONS
In this paper, we have presented the AutoLSA for au-
tomatically determining the optimal Automatic Di-
mension Reduction (ADR) ratio. The suggested
approaches produce computationally efficient ADR,
while improving the overall performance. This is
supported by an empirical evaluation conducted on
benchmark datasets from DUC02 and LDC2008T19.
The performance on both datasets illustrate the im-
provement in performance using AutoLSA com-
pared to LSA+TRM with Manual selection of DRr,
(MDRr).
REFERENCES
Ding, C. (2005). A probabilistic model for latent seman-
tic indexing. The American Society for Information
Science and Technology, 56:597–608.
Gong, Y. and Liu, X. (2002). Generic text summarization
using relevance measure and latent semantic analy-
sis. In 24th annual international ACM SIGIR con-
ference on Research and development in information
retrieval.
Steinberger, J. and Jezek, K. (2004). Text summarization
and singular value decomposition. Springer-Verlag,
LNCS, 2457:245–254.
Steinberger, J. and Kristan, M. (2007). Lsa-based multi-
document summarization. In 8th International Work-
shop on Systems and Control.
Steinberger, J., Poesio, M., Kabadjov, M., and Jezek, K.
(2007). Two uses of anaphora resolution in summa-
rization. Information Processing and Management,
43:1663–1680.
Yeh, J., Ke, H., Yang, W., and Meng, I. (2005). Text sum-
marization using a trainable summarizer and latent se-
mantic analysis. Information Processing and Manage-
ment on An Asian digital libraries perspective, 41:75–
95.
KDIR 2010 - International Conference on Knowledge Discovery and Information Retrieval
448
