
COMPLEXITY MEASUREMENT OF PRODUCT MODELS
Stephan Große Austing and Axel Hahn
Department of Computing Science, University of Oldenburg, Oldenburg, Germany
Keywords: Graph, Measurement, Ontology, Complexity.
Abstract: Complexity management in product development is a challenging task. Modelling the relations in and
between partial models from different domains in an integrated semantic product model is a step towards
complexity awareness. However it still lacks the quantitative measurement of the overall complexity which
can be used to compare product models and control development progress. In this paper we present an
approach to evaluate the impact of relations on the overall complexity which results into a complexity
measure. The approach is based on a regression model created from a RDF/OWL graph.
1 INTRODUCTION
Developing new products is a critical task for every
company in the globalized market. Shortening
product lifecycles and customer demands put a high
pressure on the project managers. However these
projects still often fail or cannot meet their
expectations (G. Stevens & Burley 1997) (Cooper
2001, S.9). One of the most frequently named
reasons for these failures is the complexity of the
project (Lebcir 2006) which is not limited to large
scale projects (Wallance u. a. 2004). The well-
known canon “You can’t control what you can’t
measure” (DeMarco 2004) applies to the aspect of
complexity as well. There have been many
approaches to make complexity measureable (Bashir
& Thomson 1999)(Kearney u. a. 1986). However
most of these approaches are limited to one of the
previously named aspects and their specific models
cannot be adapted to the manifold sources of
complexity projects can have.
An integrated product model connects data
meaningfully from different perspectives of a
product development (Hahn u. a. 2008). By making
progress and performance measurable project
controlling in new product development projects can
be greatly improved. The complexity of the designed
product model is a key indicator. In this paper we
propose a generic approach for the analysis of
product models which quantifies the complexity of
design objects and the overall product model. A
concrete measure is derived from an individually
chosen comparable reference product model. The
measure is then defined relative to the reference.
2 COMPLEXITY IN PRODUCT
MODELS
Product development involves people from different
domains, each contributing with their own view on
the product. E.g. project managers, engineers,
programmers and usability experts use their own
models and the more sophisticated a product is the
more views on the product must be considered. E.g.
a car is not only modelled in a part structure but also
in specialised models such as car electronic model or
pedestrian collusion simulation. These partial
models make up the overall product model that
contains all information on the future product.
Because the partial models are heavily
interconnected the integrated product model is a
complex system of systems. Product Lifecycle
Management (PLM) tools use an extended product
structure model as meta model for partial models
including partial models from other lifecycle phases
e.g. maintenance statistics. Ontologies have been
considered as basis for PLM models (Mostefai &
Bouras 2006) (Borsato u. a. 2010). Recently a W3C
incubator group for product modelling using
semantics was founded (Böhms u. a. 2009).
Another viewpoint is the domain of systems
engineering that deals with the methods necessary
for developing and implementing complex systems
(R. Stevens 1998). A popular approach in this area
404
Große Austing S. and Hahn A..
COMPLEXITY MEASUREMENT OF PRODUCT MODELS.
DOI: 10.5220/0003097404040407
In Proceedings of the International Conference on Knowledge Engineering and Ontology Development (KEOD-2010), pages 404-407
ISBN: 978-989-8425-29-4
Copyright
c
2010 SCITEPRESS (Science and Technology Publications, Lda.)

to overcome the complexity of product models is the
use of correlation matrices in and between different
domain models. Well-known cross-domain
examples are the correlation matrices of the Quality
Function Deployment method by (Akao 1994) and
the additional matrices by (King 1989) that connect
domains such as marketing, product structure and
process. The design structure matrix (DSM)
(Steward 1981) is primarily used for in-domain
dependency analysis and optimization but can also
be extended to multiple-domain matrices to capture
correlations between domains (Danilovic &
Browning 2007) (Lindemann u. a. 2008). However
DSM matrices are designed as qualitative and not as
quantitative model which limits quantitative
measurements (Kreimeyer u. a. 2008).
The matrices can also be viewed as equivalent
graphs and thus have similarities to ontology graph
based product modelling. These models use
ontologies to model the concepts and relations of a
partial model and corresponding graphs as model
instances. E.g. ontology mappings are used by
(Tudorache 2006) for consistency checks between
partial models.
3 APPROACH
The main goal of the presented approach is to
provide a basis for project controlling by providing a
reliable key figure. An important aspect of this
requirement is the flexibility of providing an
adaptable framework that can be tailored to
individual project environments rather than a fixed
measure. Thus the measure must be suitable for
arbitrary partial models. Additionally the
measurement process should be automatable. This
will not divert the developers from their work and
the figures can be included in regular or real-time
reports and quality assurance.
Complexity is quantified in terms of effort to
address the management of time and resources in
project controlling. This implies that complexity is
not a negative property of product models but a
quantification of product models in terms of
development output. This output figure should have
a graspable unit rather than be an abstract value to
make the impact on the development process clear.
E.g. a product model should be quantified by the
average time needed to create it.
The subject of the measurement is the integrated
product model. The statements in this model
represent the knowledge gained about the future
product. A simple measure to quantify this model is
to count the statements. However the problem is that
the statements are differently meaningful. It is
necessary to assess their impact on the overall
complexity. This can only be done on the semantic
level of the partial models. Thus the complexity
measure must consider the graph data level as well
as the ontology layers of the partial models.
Based on these requirements the basic idea of this
approach is to statistically analyse a comparable
reference product model to define a relative measure
for comparable products. E.g. the reference model
can be a co1e most helpful for the reader.
1. The procedure as the user sees it.
2. Implementation details of prototype.
3. Abstract graph discussion.
3.1 Create an Integrated
Product Model
The first step is to create the reference product
model that is used to calibrate the measure. The
framework provides transformations from several
native formats (Java, STEP, VHDL and MS
Project). Other small partial models such as
stakeholders can be modeled using OWL editors and
imported directly. The partial models still need to be
connected to create an integrated semantic product
model. This is done using automatic or manual
mappings tools. The parsing and mapping of partial
models is illustrated in Figure 1.
Figure 1: Step 1 - Create the semantic product model.
The framework is implemented as an Eclipse RCP
application that provides a Jena based domain
independent core component for the management of
layered and interconnected RDF models. The native
domains models are added to the framework as
plugins which define the domain ontology (t-box)
and parsers. By choosing a suitable set of plugins the
framework can be adapted to different engineering
domains. The set of relevant models actually used is
an individual choice and should be based on project
manager experiences.
The resulting semantic product model is in context
of measurement calibration threated as a single
graph G = (V, E) consisting of a set of nodes V and a
set of labelled directed edges E. The nodes are
COMPLEXITY MEASUREMENT OF PRODUCT MODELS
405
defined by the models RDF resources and the edges
by the statements. RDF collections and n-ary
relations modelled using anonymous nodes must be
transformed into single statements.
3.2 Annotate Artifact Complexity
As discussed in the previous section complexity is
regarded as an output value. This value must be
known for the artifacts in the reference product. E.g.
program modules or classes can be rated by their
authors or if available by cost records in working
hours or in dollar or euro units. The value type and
unit is arbitrary but should respond to a graspable
development input value that the designer can best
relate to design elements.
Internally a union copy of the semantic product
models partial models is created and some design
element classes are defined to be subclasses of the
class Artifact. The instances of those classes are
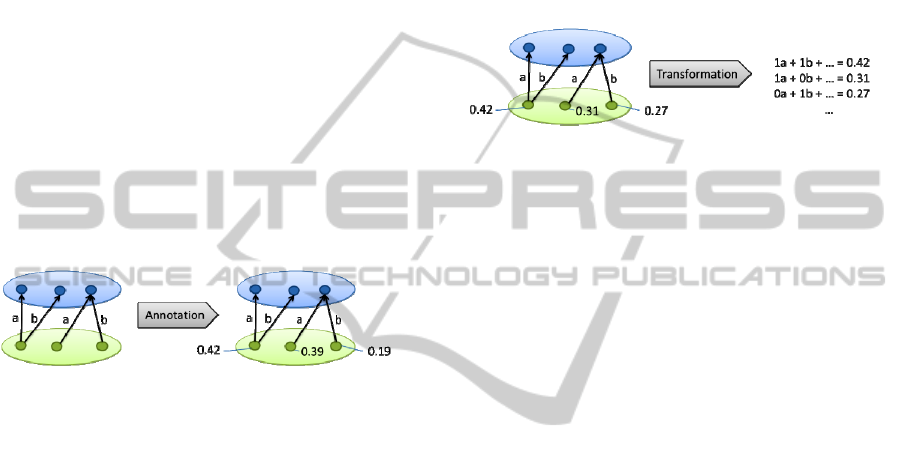
annotated with complexity values (see Figure 2).
Figure 2: Step 2 - Annotate artifact complexity.
The class Artifact defines a subset A V of the
nodes in the graph. In the following the annotated
complexity value is described as function c(a) ,
a
A.
3.3 Transform Weighting Model into
System of Linear Equations
In this step the annotated graph is used to derive the
impact of different property types on the artifacts
complexity and thus to define a measure. The
framework provides a wizard to perform this step
automatically.
The wizard performs a regression analysis on the
annotated semantic product model. The analysis is
based on the assumption that statement complexity
values are additive and that the sum of all
complexities of statements of an artifact is the
artifact’s complexity. The basic idea is that under
this assumption a system of linear equations can be
defined with statements complexities as variables on
the left hand and artifact complexities on right hand.
Thus the model takes the following form:
1
1,…,
(1)
Each of artifacts in the weighting model is
represented by an equation with
- the defined
complexity value of the artifact and
1
…
- the set
of known property types. The value
is given by
the number of values for the property type for
artifact. This transformation into a system of linear
equations is illustrated in Figure 3. The wizard
solves the linear equation system using a linear
solver from the Apache Commons mathematics
library.
Figure 3: Step 3 - Transformation into system of linear
equations.
The analysis model created by the wizard represents
a multiple linear regression in terms of multivariate
statistical analysis. The model consist of a vector of
observations
1
on the response variable
complexity and a data matrix on the p
explanatory variables property value occurrences.
The explanatory variables are also called regressors.
The model can be written shortly as matrix formula
(2)
where variable is the unexplained error. Using the
least-square method the best-fitting prediction vector
is searched that minimizes the residuals. The
residuals are the difference vector between the actual
observation vector and the predicted vector
. The vector
represents the calibrated
measure as it can be used against other data matrices
from other semantic product models where the
complexity values are unknown. The sum of the
predicted artifact complexities is according to our
notion of complexity the complexity of the semantic
product model. The coefficient of determination can
be used as quality indicator for the derived measure.
However the results still have to be checked for
plausibility and validated.
The complexity of an artifact in the semantic
product may not only depend on the adjacent
vertices or properties. E.g. the complexity of an
artifact can depend on the type of requirement
(functional or non-functional) the property
implements points to. In other domains a cycle path
may have a significant impact on complexity, e.g. a
property controls. The approach can be extended by
a generalization of the regressors used in the
regression model. Other artifact measures f(a) ,
KEOD 2010 - International Conference on Knowledge Engineering and Ontology Development
406

a
A can be considered. Regressors can generated
from the domain schema ontologies like the property
value occurrences regressors are derived from the
set of known properties.
4 SUMMARY
This paper proposed a complexity analysis for
semantic product models. The structure of semantic
product models as a layered graph-based
representation of the design partial models was
explained. The proposed complexity measure is a
relative measure to a reference semantic product
model. A concrete measure is derived from the
reference model using a regression analysis. The
analysis is based on the knowledge about the
properties in the domain ontologies.
The approach has been tested with source code
and product structure models. Further research
includes larger models to test the scalability of the
approach. It seems likely that this approach can also
be applied to other properties such as maintainability
or quality. However these properties do not have
exact the same characteristics as the underlying
notion of complexity. Thus we do not have any
evidence yet and current work focuses on refinement
of the method and improving the support through the
framework.
REFERENCES
Akao, Y., 1994. Development history of quality function
deployment. QFD, the customer-driven approach to
quality planning and development”; Tokio, p. 339–
351.
Bashir, H.A. & Thomson, V., 1999. Metrics for design
projects: a review. Design Studies, 20(3), p. 263-277.
Böhms, M. et. al, 2009. Product Modelling using Semantic
Web Technologies, W3C. Available at:
http://www.w3.org/2005/Incubator/w3pm/XGR-
w3pm-20091008/.
Borsato, M. et. al., 2010. An ontology building approach
for knowledge sharing in product lifecycle
management. International Journal of Business and
Systems Research, 4(3), p. 278–292.
Cooper, R.G., 2001. Winning at New Products:
Accelerating the Process from Idea to Launch, 3. Ed.
Basic Books.
Danilovic, M. & Browning, T.R., 2007. Managing
complex product development projects with design
structure matrices and domain mapping matrices. Int.
J.of Project Management, 25(3), p. 300–314.
DeMarco, T., 2004. Was man nicht messen kann... ...kann
man nicht kontrollieren., Mitp-Verlag.
Hahn, A., Austing, S.G. & Strickmann, J., 2008. Ontology
based metrics – applying business intelligence on
PLM. Int. J of Product Lifecycle Management, 3(4), p.
308 - 318.
Kearney, J.P. u. a., 1986. Software complexity
measurement. Commun. ACM, 29(11), 1044-1050.
King, B., 1989. Better designs in half the time:
Implementing QFD quality function deployment in
America, GOAL/QPC.
Kreimeyer, M., Daniilidis, C. & Lindemann, U., 2008. A
Framework to Classify Process Improvement Projects.
In Proc. of the 10th Int. Design Conference. Glasgow:
The Design Society, p. 951-958.
Lebcir, M.R., 2006. A Framework for Project Complexity
in New Product Development (NPD) Projects.
Business School Working Papers UHBS.
Lindemann, U., Maurer, M. & Braun, T., 2008. Structural
Complexity Management: An Approach for the Field
of Product Design illustrated edition., Springer,
Berlin.
Mostefai, S. & Bouras, A., 2006. What ontologies for
PLM: a critical
analysis. In Proc.: 12th Int. Conference on Concurrent
Enterprising. p. 423-430.
Stevens, G. & Burley, J., 1997. 3,000 Raw Ideas = 1
Commercial Success! Research Technology
Management, 40(3), p. 16-27.
Stevens, R., 1998. Systems engineering: coping with
complexity, Prentice Hall PTR.
Steward, D., 1981. The design structure matrix: a method
for managing the design of complex systems. IEEE
Trans. on Engineering Management, 28(3), p. 71–74.
Tudorache, T., 2006. Employing Ontologies for an
Improved Development Process in Collaborative
Engineering. Technische Universität Berlin.
Wallance, L., Keil, M. & Rai, A., 2004. Understanding
software project risk: a cluster analysis. Information &
Management, 42(1), p. 115-125.
COMPLEXITY MEASUREMENT OF PRODUCT MODELS
407
