
FEATURE SELECTION FOR THE INSTRUMENTED TIMED UP
AND GO IN PARKINSON’S DISEASE
L. Palmerini, L. Rocchi, S. Mellone, L. Chiari
Biomedical Engineering Unit,DEIS, University of Bologna, Viale Risorgimento 2, Bologna, Italy
F.Valzania
Department of Neuroscience, University of Modena and Reggio Emilia, via Pietro Giardini 1355, Baggiovara (MO), Italy
Keywords: Feature Selection, Parkinson’s Disease, Accelerometer.
Abstract: The Timed Up and Go (TUG) is a widely used clinical test to assess mobility and fall risk in Parkinson’s
disease (PD). The traditional outcome of this test is its duration. Since this single measure cannot provide
insight on subtle differences in test performances, we considered an instrumented TUG (iTUG). The aim
was to find, by means of a feature selection, the best set of quantitative measures that would allow an
objective evaluation of gait function in PD. We instrumented the TUG using a triaxial accelerometer.
Twenty early-mild PD and twenty age-matched control subjects performed normal and dual task TUG trials.
Several temporal, coordination and smoothness measures were extracted from the acceleration signals; a
wrapper feature selection was implemented for different classifiers with an exhaustive search for subsets
from 1 to 3 features. A leave-one-out cross validation (LOOCV) was implemented both for the feature
selection and for the evaluation of the classifier, resulting in a nested LOOCV. The resulting selected
features permit to obtain a good accuracy (7.5% of misclassification rate) in the classification of PD.
Interestingly the traditional TUG duration was not selected in any of the best subsets.
1 INTRODUCTION
The Timed Up and Go (TUG) is a widely used
clinical test to assess balance, mobility and fall risk
in Parkinson’s disease (PD). The traditional outcome
of this test is its duration, measured by a stopwatch.
Since this single measure cannot provide insight on
subtle differences in test performances, instrumented
Timed Up and Go tests (iTUG) have been recently
proposed (Weiss et al., 2010; Zampieri et al., 2010).
These studies demonstrated the potential of using
inertial sensors to quantify TUG performance. As
stated in (Zampieri et al., 2010), quantitative
evaluation is especially important for early stages of
PD when balance and gait problems are not
clinically evident but may be detected by
instrumented analysis. The aim of this study was to
find, by means of a feature selection process, the
best set of quantitative measures that would allow an
objective evaluation of gait function in PD and could
be considered as possible early biomarkers of the
disease. Feature selection has recently been used in
the field of Parkinson’s disease to quantify the
performance of a PD subject (Brewer, Pradhan,
Carvell, & Delitto, 2009); in the mentioned study the
quantitative data came from force/torque sensors.
2 METHODS
We examined twenty early-mild PD subjects OFF
medication (Hoehn & Yahr ≤ 3, 62±7 years old, 12
males and 8 females) and twenty healthy age-
matched control subjects (CTRL, 64±6 years old, 7
males and 13 females). The OFF condition in PD
subjects was obtained by a levodopa washout of at
least 18 hours and a dopamine agonist washout of at
least 36 hours. Subjects wore a tri-axial
accelerometer, McRoberts© Dynaport Micromod,
on the lower back at L5 level. They performed three
TUG trials (single task, ST) and three TUG trials
with a concurrent cognitive task (dual task, DT),
95
Palmerini L., Rocchi L., Mellone S., Chiari L. and Valzania F..
FEATURE SELECTION FOR THE INSTRUMENTED TIMED UP AND GO IN PARKINSON’S DISEASE.
DOI: 10.5220/0003100400950099
In Proceedings of the International Conference on Knowledge Discovery and Information Retrieval (KDIR-2010), pages 95-99
ISBN: 978-989-8425-28-7
Copyright
c
2010 SCITEPRESS (Science and Technology Publications, Lda.)
which consisted in counting audibly backwards from
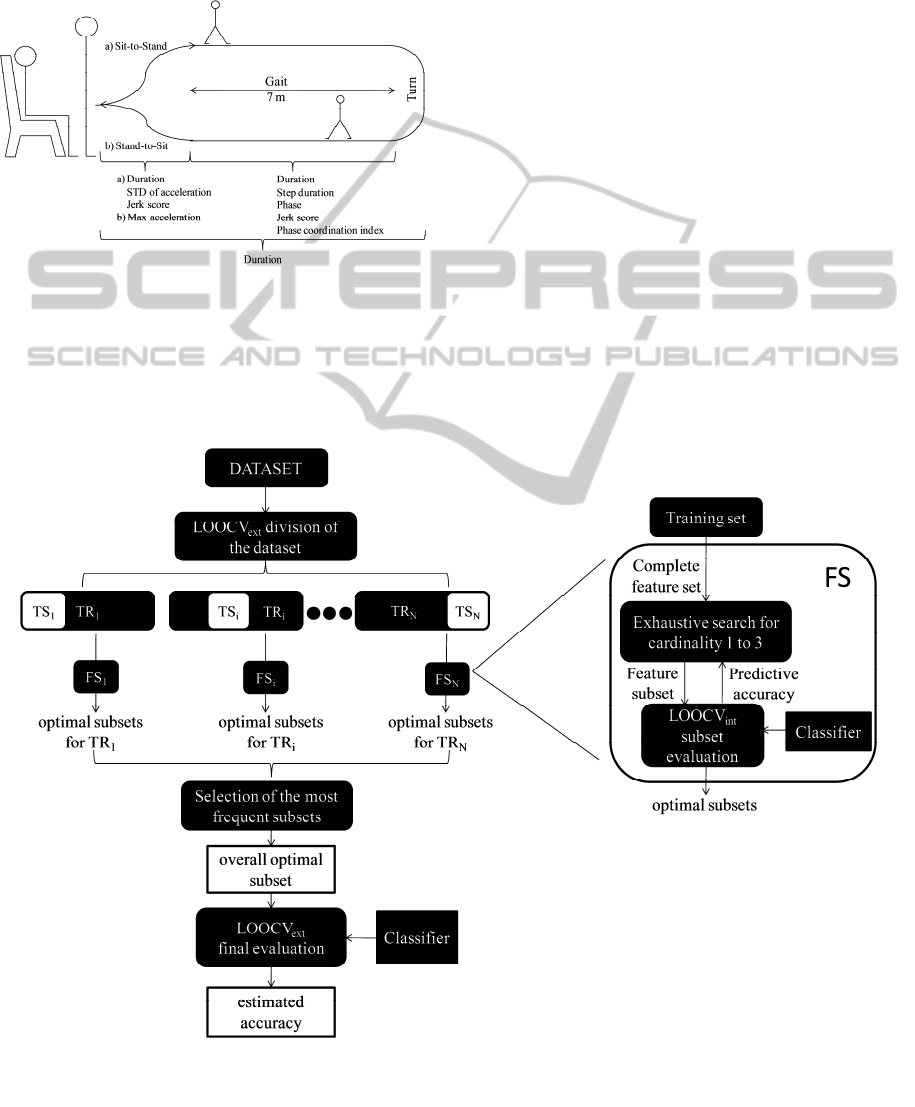
100 by 3s. The TUG trial consisted of rising from a
chair, walking 7m at preferred speed, turning
around, returning and sitting down again. A
schematic representation of the task is shown in
figure 1.
Figure 1: Timed Up and Go Test and extracted parameters.
Several temporal (including total duration of the
test), coordination and smoothness measures were
extracted from the acceleration signals in different
sections of the TUG. In figure 1 the main measures
are reported.
Considering the gait section, each stride (from
one heel strike to the consecutive heel strike of the
same leg) defines one gait cycle. The phase is
determined by the ratio between the duration of the
first step of the gait cycle and the entire duration of
the gait cycle: a factor of 360 is used to transform
the variable into degrees (360 degrees would
correspond to the entire gait cycle). (Plotnik, Giladi,
& Hausdorff, 2007). Among the other measures,
phase coordination index measures the symmetry of
gait (Plotnik et al., 2007) and jerk score (for both sit-
to-stand and gait sections) can be seen as an index of
movement smoothness.
In the gait section, jerk score and step duration
were computed for each step; for the following
analysis their averages across all the steps were
considered, together with measures of variability
between different steps (standard deviation, STD,
and coefficient of variation, CV). Similarly, phase
was computed for each gait cycle but only its
average and variability measures were considered.
Jerk score (for both sit-to-stand and gait
sections), STD, and max value of acceleration, were
computed along two orthogonal axes of the
Figure 2: Feature selection procedure.
KDIR 2010 - International Conference on Knowledge Discovery and Information Retrieval
96

accelerometer: the first aligned with the direction of
gait progression and coincident with the
biomechanical anteroposterior (AP) axis of the
body; the second in the left/right direction and
coincident with the biomechanical mediolateral
(ML) axis of the body.
For each measure, both in ST and in DT, we
computed the mean value across the three repeated
trials for the following analyses.
To select, from all the available features (56
measures extracted from the signals, 28 for ST and
28 for DT), the subset which has the best
discriminative ability, a “wrapper” feature selection
(Kohavi & John, 1997) was implemented; the
objective function was the predictive accuracy of a
given classifier on the training set. We used the
following classifiers: linear and quadratic
discriminant analysis (LDA and QDA, respectively),
Mahalanobis classifier (MC), logistic regression
(LR), K-nearest neighbours (KNN, K=1) and linear
support vector machines (SVM). An exhaustive
search among subsets of cardinality from one to
three was implemented; the limit of three was
chosen to permit a clinical interpretation of the result
(it would be difficult to associate too many features
with different aspects of the disease). Subsets of
different cardinalities were considered separately.
The adopted procedure is similar to the one
proposed by Brewer et al. (2009) where an
exhaustive search of subsets of three features was
performed. Still, in the present study, feature
selection bias was also considered because the
available features (56) are more than the available
data (40 subjects).
Since feature selection is part of the tuning
design of the classifier, it needs to be performed on
the training set, in order to avoid the aforementioned
feature selection bias in the final evaluation of the
accuracy of the classifier (Simon, Radmacher,
Dobbin, & McShane, 2003). The most common
solution to this problem is to use a nested cross
validation procedure (Kohavi and John, 1997): the
internal feature selection step is repeated for each
training set resulting from the external cross
validation. In this study, because of the small sample
size (40), a leave-one-out cross validation (LOOCV)
was implemented both for the feature selection steps
and for the final evaluation of the classifier.
As it can be seen in figure 2, the external cross
validation used for estimation of the accuracy of the
classifier (LOOCV
ext
) splits the dataset in 40
different training and testing sets (TR
i
,TS
i
1≤i≤40);
for each TR
i
, a different feature selection step was
performed (FS
i
, 1≤i≤40). The objective function
(predictive accuracy) of each feature selection was
evaluated by an internal LOOCV (LOOCV
int
). After
each FS
i
, a list of optimal subsets of features was
generated: there was generally more than one subset
with the same highest LOOCV
int
accuracy (more
than one optimal subset). In the nested procedure TS
i
should be classified from the classifier built with a
single subset chosen by FS
i
; in this study, since more
than one optimal subset was found, it was not
possible to make a unique choice. Moreover
different FS
i
led to different lists of optimal subsets.
So we decided to extract the subset which was
selected as optimal more frequently over all the FS
i
(overall optimal subset, see figure 2). The number of
times a certain subset was selected as optimal
(selection times) can be seen as an index of how that
subset is robust to changes in the training set, and
therefore to selection bias. Eventually, the accuracy
of the classifier (misclassification rate, MR) was
computed by LOOCV
ext
for the overall optimal
subset (see figure 2).
3 RESULTS AND DISCUSSION
In table 1 the results of the feature selection
procedure for subsets of 3 measures are reported; the
estimated accuracy is presented together with the
selection times (the number of times a subset was
selected as optimal among the 40 different feature
selection procedures). Subsets of 3 measures were
preferred since subsets of lower cardinality led to
higher misclassification rates. It can be seen that a
good misclassification rate could be achieved (7.5%-
10%) by all the classifiers. As discussed in section 2,
estimates of misclassification rates of subsets with
higher selection times should be considered as more
reliable, regarding selection bias, with respect to
estimates with lower selection times. Therefore
subsets with higher selection times should be
preferred.
Considering the overall optimal subsets from all
the classifiers, the procedure always selected a
measure related with the sit-to-stand and one or two
measures related with the gait phase. In four subsets
there is also a measure extracted during stand-to-sit.
It should also be remarked that every subset
presented in table 1 is made of both single and dual
task related measures.
These measures improve the discrimination
power between CTRL and PD with respect to the
traditional TUG duration (the best misclassification
rate that can be obtained by using this single
measure with the reported classifiers, in ST or in
FEATURE SELECTION FOR THE INSTRUMENTED TIMED UP AND GO IN PARKINSON'S DISEASE
97

DT, is 35%), which interestingly was not selected in
any of the overall optimal subsets. Moreover TUG
duration alone was not significantly different
between the two groups (as in Weiss et al., 2010 and
Zampieri et al., 2010) and therefore it could not
discriminate between CTRL and early-mild PD.
Instead, considering various quantitative measures
related to different parts of the TUG (see table 1),
allowed us to obtain good accuracy in the
classification of PD subjects. This accuracy would
not have been obtained without feature selection;
considering all the features altogether, the number of
features is higher than the number of samples. In this
case LDA, QDA and MC cannot be used because it
is not possible to estimate the covariance matrix;
similarly, in LR the model is overparameterized and
some coefficients of the logistic model are not
identifiable. So the only classifiers that can be used
without feature selection are KNN and SVM which,
using all the features, have a MR of 52% and 20%,
respectively; this reflects the importance of
performing feature selection in this kind of datasets.
Furthermore it has to be noted that even if our
relatively small sample size limits the power of our
data mining perspective a nested cross validation
was applied to limit the possible feature selection
bias. Since it was not possible to follow the typical
nested procedure (because several different
combinations of features were selected as optimal), a
value was derived which can be seen as an index of
the reliability of the estimation of the
misclassification rate.
4 CONCLUSIONS
The main result achieved by this work is that a set of
few quantitative measures, derived from a clinical
test for gait evaluation, can discriminate with a good
accuracy between PD and CTRL subjects.
Further experiments should be made on new
subjects to have an independent data set and validate
these findings; in particular, the selected optimal
measures could be tested on PD subjects in an earlier
stage of their disease in order to check if they could
also be used as early biomarkers of PD. On the other
hand it should be investigated whether the presented
measures remain valid and maintain their superiority
over TUG duration for later stages of the disease. In
fact, even if the presented subsets are optimal for
classifying early-mild PD, there is no guarantee that
they would be optimal to monitor the disease
progression or to detect changes in gait patterns after
Table 1: Results of the feature selection procedure.
Classifier Overall optimal subsets Task
Selection
times /40
MR
STD of AP acceleration during Sit-to-Stand single task
LDA Max AP acceleration during Stand-to-Sit dual task 32 7.5%
STD of the phase during gait dual task
STD of ML acceleration during Sit-to-Stand single task
QDA Max AP acceleration during Stand-to-Sit single task 25 7.5%
CV of the step duration during gait dual task
Jerk score of AP acceleration during Sit-to-Stand single task
LR Jerk score of ML acceleration during gait single task 28 7.5%
STD of the step duration during gait dual task
Jerk score of AP acceleration during Sit-to-Stand single task
KNN Jerk score of AP acceleration during gait dual task 36 7.5%
CV of the jerk score of ML acceleration during gait dual task
Jerk score of AP acceleration during Sit-to-Stand single task
MC Jerk score of ML acceleration during gait single task 32 10%
max AP acceleration during Stand-to-Sit dual task
Jerk score of ML acceleration during Sit-to-Stand single task
SVM CV of the jerk score of ML acceleration during gait single task 25 7.5%
max AP acceleration during Stand-to-Sit dual task
KDIR 2010 - International Conference on Knowledge Discovery and Information Retrieval
98

a particular medical treatment; in this context, the
next step will be a follow-up of the study with the
same subjects.
Another future goal will be to assess if the TUG
carried out under DT can add discriminative power
with respect to the ST alone (as suggested by this
study), since this would have important implications
on the experimental design.
ACKNOWLEDGEMENTS
The research leading to these results has received
funding from Regione Emilia-Romagna, High
Technology Network initiative (AER-TECH -
“Automation, Electronics and Bioengineering:
Technologies for Manufacturing and People”).
REFERENCES
Brewer, B. R., Pradhan, S., Carvell, G., & Delitto, A.
(2009). Feature selection for classification based on
fine motor signs of Parkinson's disease. Proceedings
from IEEE EMBS ‘09: 31
st
Annual International
Conference of the IEEE Engineering in Medicine and
Biology Society. doi:10.1109/IEMBS.2009.5333129
Kohavi, R., & John, G. H. (1997). Wrappers for Feature
Subset Selection. Artificial Intelligence, 97(1-2), 273-
324. doi:10.1016/S0004-3702(97)00043-X
Plotnik, M., Giladi, N., & Hausdorff, J. M. (2007). A new
measure for quantifying the bilateral coordination of
human gait: effects of aging and Parkinson’s disease.
Experimental Brain Research, 181(4), 561-570. doi:
10.1007/s00221-007-0955-7
Simon, R., Radmacher, M. D., Dobbin, K., & McShane, L.
M. (2003). Journal of the National Cancer Institute,
95(1), 14-18. doi:10.1093/jnci/95.1.14
Weiss, A., Herman, T., Plotnik, M., Brozgol, M., Maidan,
I., Giladi, N., ... Hausdorff, J. M. (2010). Can an
accelerometer enhance the utility of the Timed Up &
Go Test when evaluating patients with Parkinson’s
disease? Medical Engineering & Physics, 32(2), 119-
125. doi:10.1016/j.medengphy.2009.10.015
Zampieri, C., Salarian, A., Carlson-Kuhta, P., Aminian,
K., Nutt, J. G., & Horak, F. B. (2009). The
instrumented timed up and go test: potential outcome
measure for disease modifying therapies in Parkinson's
disease. Journal of Neurology, Neurosurgery &
Psychiatry,
81(2), 171-176. doi:10.1136/jnnp.2009.173740
FEATURE SELECTION FOR THE INSTRUMENTED TIMED UP AND GO IN PARKINSON'S DISEASE
99
