
A GEOGRAPHIC INFORMATION SYSTEM (GIS) TO DEFINE
INDICATORS FOR DEVELOPMENT AND PLANNING
IN JORDAN
Balqies Sadoun
1
and Bassam Saleh
2
1
Department of Architectural Engineering, Philadelphia University
Jordan and on Sabbatical Leave from the Department of Surveying and Geomatics Engineering
Al-Balqa’ Applied University, Salt, Jordan
2
Department of Surveying and Geomatics Engineering, Al-Balqa’ Applied University, Salt, Jordan
Keywords: Geographic Information System (GIS), Data Management, Spatial Information and Analysis, Statistical
Analysis, Decision Making, City and Regional Planning.
Abstract: The computerization and the creation of a digital data base is a must for the employment of many of the
state of the art tools in the Optimal Planning process. This is easy made using Geographic Information
System (GIS). GIS is an effective modern planning technique which gives the power to create maps,
integrate information, visualize and solve problems, present future ideas and develop valuable solutions in
basically no time while relating information to a geographic component. The planning challenges today are
mainly due to overpopulation, pollution, deforestation and immigration, which definitely have a geographic
dimension. The Departments of General Statistics/Census in all countries are considered the main source of
data for governmental and private agencies. In this work, we are using a Geographic Information System
(GIS) to create a database system for Jordan (a developing country) to be used for optimal planning
purposes. The created GIS for the country by governorates (12 Governorates) cover all aspects of life
including social, economical, resources, among others. All the departments’ data in addition to a large
quantity of field data that we gathered are utilized to create GIS system. Results of many GIS analysis
techniques are presented for demonstration purposes. Different kinds of data will allow concerned people to
have proper planning, and development according to existing realities, and can aid in deciding on priorities
of such plans. The digitizing of the data is a step will be a great step forward towards optimal and well
informed decision making process in the country.
1 INTRODUCTION
Planning is a comprehensive tool to an enormous
data to pick patterns, define relations and present the
results to help in better and optimal decision making
in virtually no time and cost. Planning the future of a
country or planning everyday life (such as starting a
new business, or finding the best soil for growing
vegetables, or the best route to a location, etc.), has a
geographical dimension and always related to a map.
Thus, GIS role is vital such a process as it has the
potential to offer the optimal solution.
GIS is a simulation methodology of all past,
present and future situations at a minimal cost
compared to other planning tools. It is a computer-
based technology and methodology for collecting,
managing, analyzing, modeling, and presenting
geographic data for never-ending applications. It
consists of a data base, map information and
computer link to allow viewing, inquiring,
interpreting, and visualizing data in many ways that
reveal relationships, patterns, and trends in the form
of maps, reports, and charts (Burrough, 1986),
(Chrisman, 1999), (Ducker, 1979), (Star and Estes,
1990), (Andronache et al., 2006). Ducker (Ducker,
1979) defined GIS as the management of the data to
retrieve new related data for ad hoc queries and
analysis. Chrisman (Chrisman, 1999) considers GIS
to play a role in the society as people measure and
represent geographic phenomena, then transform
these representations into other form while
interacting with social structures. GIS changed the
heart of planning and informed decision making
32
Sadoun B. and Saleh B. (2010).
A GEOGRAPHIC INFORMATION SYSTEM (GIS) TO DEFINE INDICATORS FOR DEVELOPMENT AND PLANNING IN JORDAN.
In Proceedings of the International Conference on e-Business, pages 32-38
DOI: 10.5220/0003105000320038
Copyright
c
SciTePress
especially in the world of emergencies and life
saving process. During Catharine storm in the USA,
GIS (created for transportation purposes) was the
only way to locate people during the hurricane when
all other methods failed (Andronache et al., 2006). It
helped in saving the lives of thousands of citizens
and opened the eyes to the benefits of GIS
technology. GIS and related technology will help
analyze large datasets, allowing a better
understanding of terrestrial processes and human
activities to improve economic vitality,
environmental quality, and response to emergencies
as well as, finding the way to a supermarket. Today,
GIS is a multibillion-dollar industry employing
hundreds of thousands of people (planners,
engineers, economists, etc.) and used extensively in
all aspects of planning.
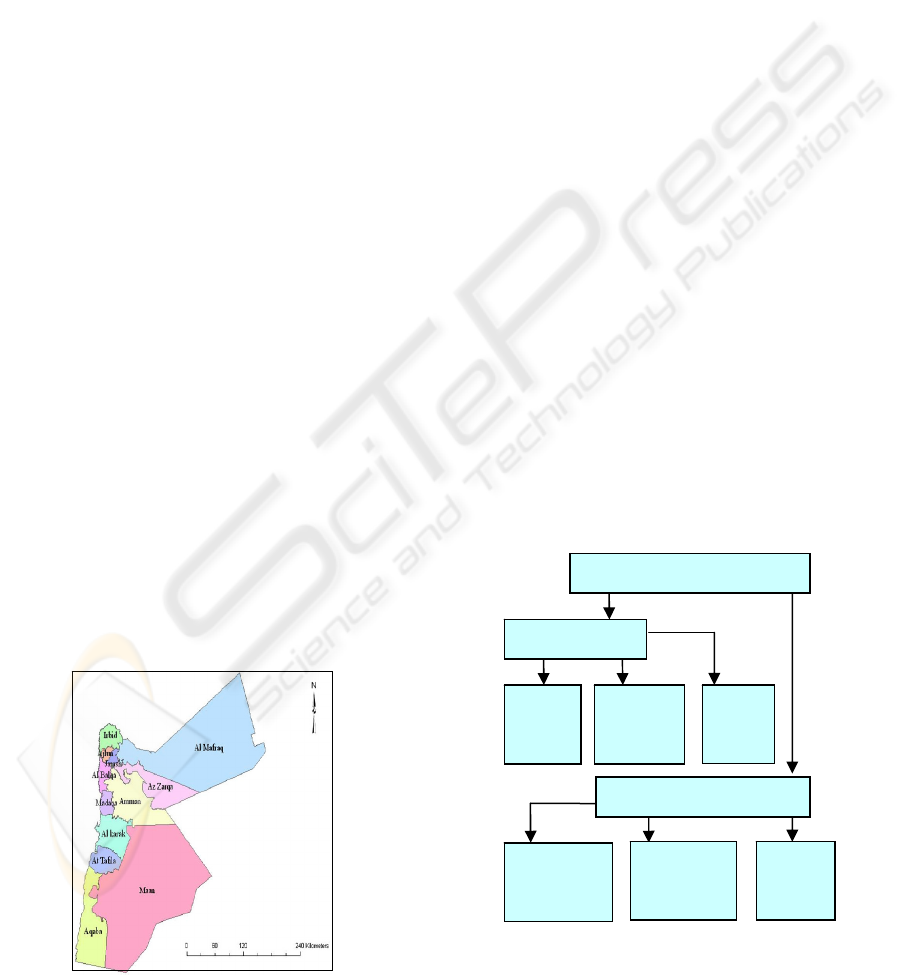
Jordan is a Middle Eastern country located in
Southwest Asia. Administratively, it is divided into
12 governorates: Ajlun, Amman, Aqaba, Al-Balqa,
Irbid, Jerash, Al-Karak, Ma'an, Madaba, Al-Mafraq,
Tafilah, Az Zarqa (Fig.1). The department of
General Statistics in Jordan categorizes its data
according to governorates. GIS is used in this work
to create a digital data to reflect the different nature
of each governorate, its resources, population, etc.
The created digital data for the country will allow all
kinds of analysis by governorate to clarify and
reflect their strong and weak points, needs. This will
help in defining indicators for development and
planning. ArcGIS software is used in our work for
capturing, organizing, analyzing, mapping, and
presenting spatial information.
Our main Objectives are to: (a) create a global
digital data for the country by governorate, (b) allow
the usage of endless capabilities of GIS analysis and
(c) offer the possibilities of web posting and e-
government utilization.
Figure 1: Jordan Governorates.
2 METHODOLOGY
GIS Data Model: GIS systems handle two types of
data, raster and vector data. Raster data from
scanned or remotely sensed images are poor at
representing points, lines and areas, but good at
surfaces. Vector data model uses points stored by
their real coordinates, sequence of these points build
lines and areas. The spatial data we used in building
our GIS includes: Jordan Map (scale 1:1,000,000)
and a Spot Satellite Image for Jordan. Global
Positioning System (GPS) is used to collect the
coordinates of important points to enrich our GIS
such as: Universities (8 points), Hotels (58 points),
Hospitals (29 points), Police Stations (44 points),
Water Companies (11 points), Civil Status and
Passport department (11 points), Municipalities (12
points), Airports (3 points). All points were taken
according to Google Earth Map.
Attribute data give more information about features
in tabular form. Attribute Statistical Data for Jordan
for the years (1990 - 2005) were used to create the
GIS database. All kinds of data such as: population
count, population density, urban population, rural
population, population by gender, number of births,
deaths, marriages, and divorces, crimes, rain fall,
water supply for domestic purposes, fuel
distribution, number of new telephone subscribers,
pharma- cies, registered engineers, post office mail
boxes, post offices, road accidents, hotels, registered
lawyers, charitable societies, bookshops, hospitals,
health centers, dental clinics, schools etc. Available
and field collected data were included in the work.
Figure 2: Collected data flowchart.
Collected data
Spatial data
Maps
Spot
Satellite
Image
Points
by GPS
Statistical
book of
Jordan
Field
data
Available
data
Attribute data
A GEOGRAPHIC INFORMATION SYSTEM (GIS) TO DEFINE INDICATORS FOR DEVELOPMENT AND
PLANNING IN JORDAN
33
Data Processing: spatial and attribute data, maps
and images were processed as follows: (a) scanning
the map of Jordan to convert it to digital format, (b)
defining the coordinate system; (Universal
Transverse Mercator: UTM) and the Ellipsoid, (c)
registering the scanned map (image) in the
coordinate system using ground control points
(points of known coordinates), and (d) creating the
layers by digitizing the map (Fig.3).
Many layers were created using GIS. The output
layers included: Jordan by Governorate map, cities,
sea, water companies, Police stations,
Municipalities, Hotels, airports, border stations,
Civil status and passport departments, roads
networks, universities, Governorate buildings, etc.
3 ANALYSIS AND RESULTS
GIS analysis is finding geographic patterns in the
database and the relationships between features. The
analysis methods can be very simple such as making
a map (Fig.1) or more complex, involving models
that imitate the reality of the situation, or by
combining many data layers. The tabular data allows
different analysis techniques such as classification,
buffering and statistical analysis. The analysis
achieved is in clear presentations and real interaction
with the needed information.
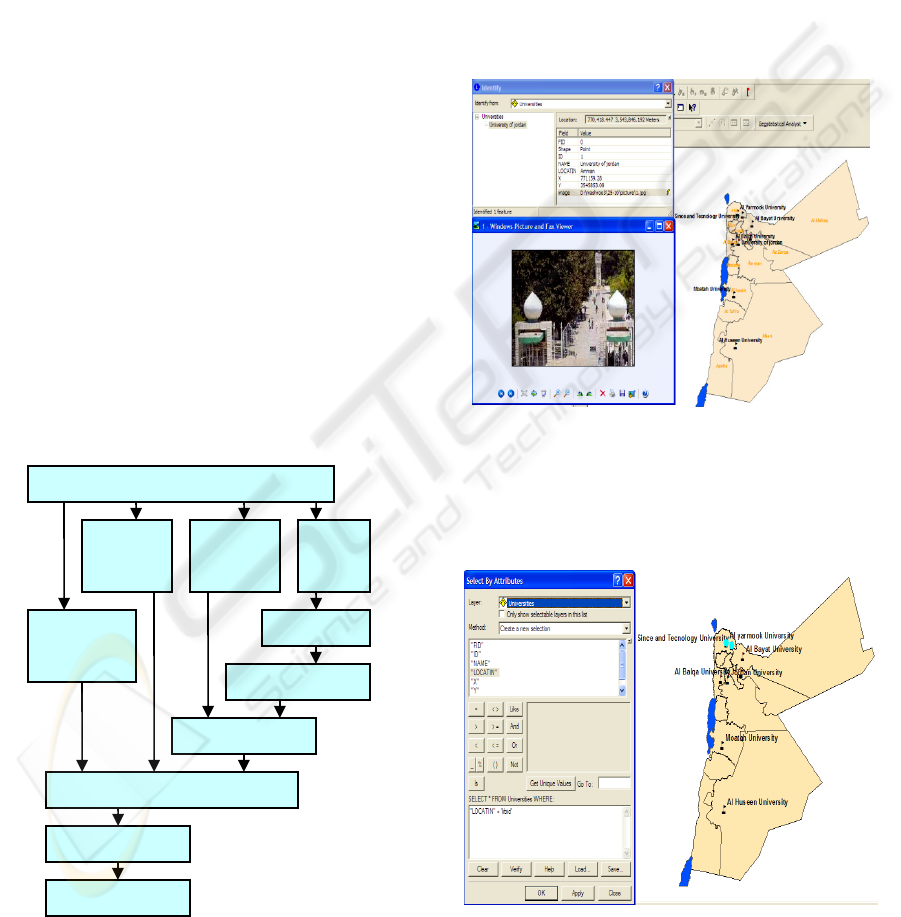
Figure 3: The Methodology.
Spatial Analysis: Queries offer a method of data
retrieval from the data base, or on a new data
produced as a result of the data analysis. There are
many methods of querying Data, which include:
Identify, Find, Hyperlink, Query data by attribute,
Query data by location.
Identify is the fastest tool for getting information
about features by clicking on the feature, then all
attribute data will appear in a tabular from. Find data
is used to locate the position of such feature on the
map in different layers upon the need, for example,
to locate an airport or university on the map.
Hyperlink data Hyperlink is a tool to obtain more
information attached to features such as Photo or
text (Fig.4).
Figure 4: Hyperlink; the University of Jordan.
Query data by attribute. The features could be
selected using the Standard Query Language (SQL),
such as: Querying about the location of Universities
in the northern city of Irbid (Fig.5).
Figure 5: Universities in Irbid.
Data In
p
ut
GPS
points
Attribute
data
Spot
Image
Paper
map
Scannin
g
Georeferencing
Di
g
itizin
g
Creatin
g
La
y
ers
Anal
y
sis
Thematic maps
ICE-B 2010 - International Conference on e-Business
34
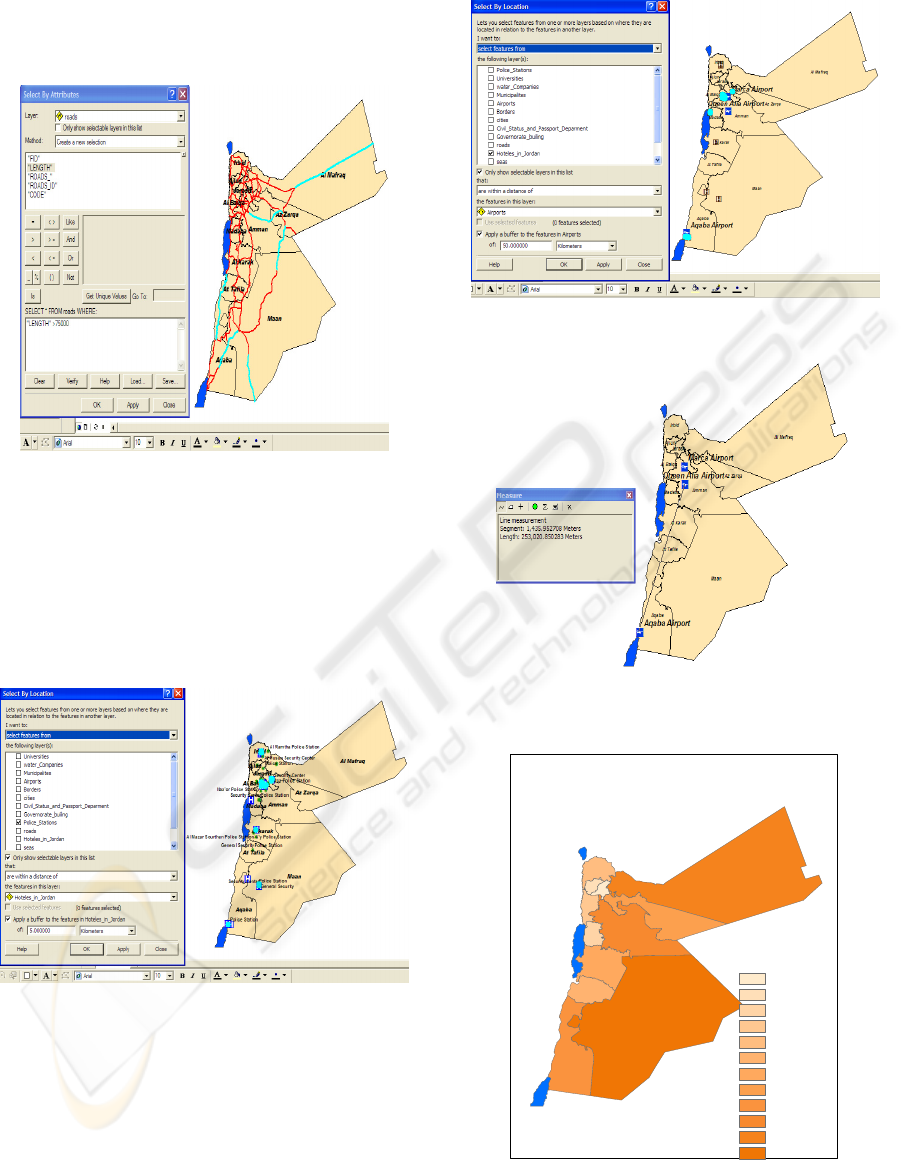
Figure 6 presents another type of queries such as
Querying about the Highways in Jordan which are
more than 75Km long.
Figure 6: Highways more than 75Km long in Jordan.
Query data by location Selecting features by location
is a function that lets you select features from one or
more layers based on where they are located in
relation to the features in another layer such as: how
many "Police station" within (5km) from the Hotels
(Fig.7)? Hotels within (50km) from the Airports
(Fig.8)? and so on.
Figure 7: Police Stations within 5km from hotels.
Connectivity Analysis is done between points, lines,
and polygons in terms of distance such as: travel
time, optimum paths etc. Using the distance tool, we
can measure the distance between any two features
on the map. Figure 9 for example shows the distance
between Queen Alia airport and Aqaba airport.
Figure 8: Hotels within 50 km from the Airports.
Figure 9: The distance between Queen Alia and Aqaba
Airports.
Figure 10: The Jordanian Governorates Areas in km2.
Maan
Al Mafraq
Aqaba
Amman
Az Zarqa
Al karak
Irbid
At Tafila
Madaba
Al Bal qa
Ajlun
Jarash
Legend
jordan
Area
410
411 - 420
421 - 940
941 - 1119
1120 - 1572
1573 - 2209
2210 - 3495
3496 - 4761
4762 - 6900
6901 - 7579
7580 - 26541
26542 - 32832
A GEOGRAPHIC INFORMATION SYSTEM (GIS) TO DEFINE INDICATORS FOR DEVELOPMENT AND
PLANNING IN JORDAN
35
The Arc GIS software enables the conversion of a
shape file into a feature class, which includes the
area as an attribute file. Then, these areas could be
used in statistical and spatial analysis. Figure 10
presents the areas of the governorates in km2 using
classification technique.
Statistical Analysis entails the representation of the
numerical data of the layers into graphical forms; a
lot of mathematical functions are used to help in
making engineering decisions.
Classification is used when we need to symbolize
quantities, or want to see where attribute values lie
in relation to one another on a continuous scale.
Classification is an easy way for comparison in
order to find or clarify any change in a situation or
setting. It could reflect more than a result according
to what is included in the classification process.
Examples are many in city planning and in
monitoring the results of the planning process in
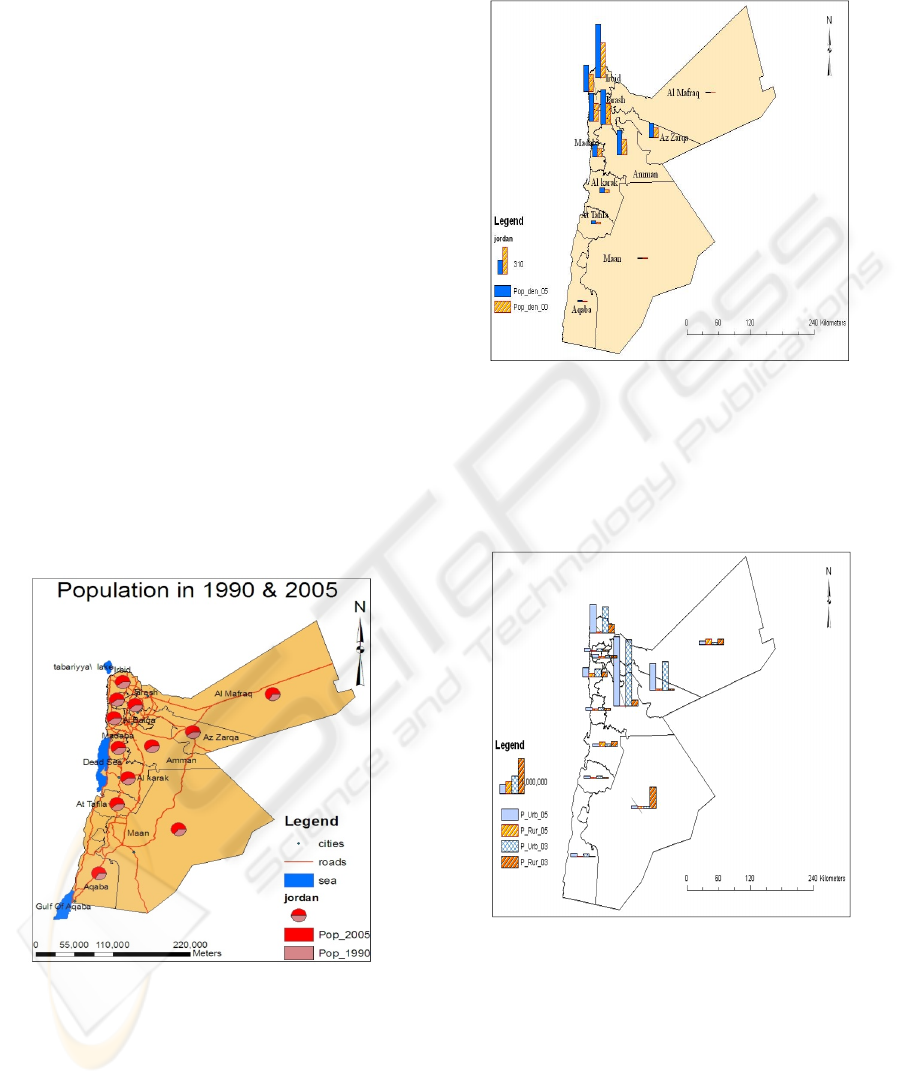
general. Figure 11 presents a comparison of the
Population (number) for the years of 1990 & 2005 in
a pie form. Figure 11 shows an increase in the
population in all governorates. The pie plot is good
only to show if there is an increase or decrease in
each governorate, but it doesn't show the value of
this increase in comparison between governorates as
when using the histogram plot (Fig. 12).
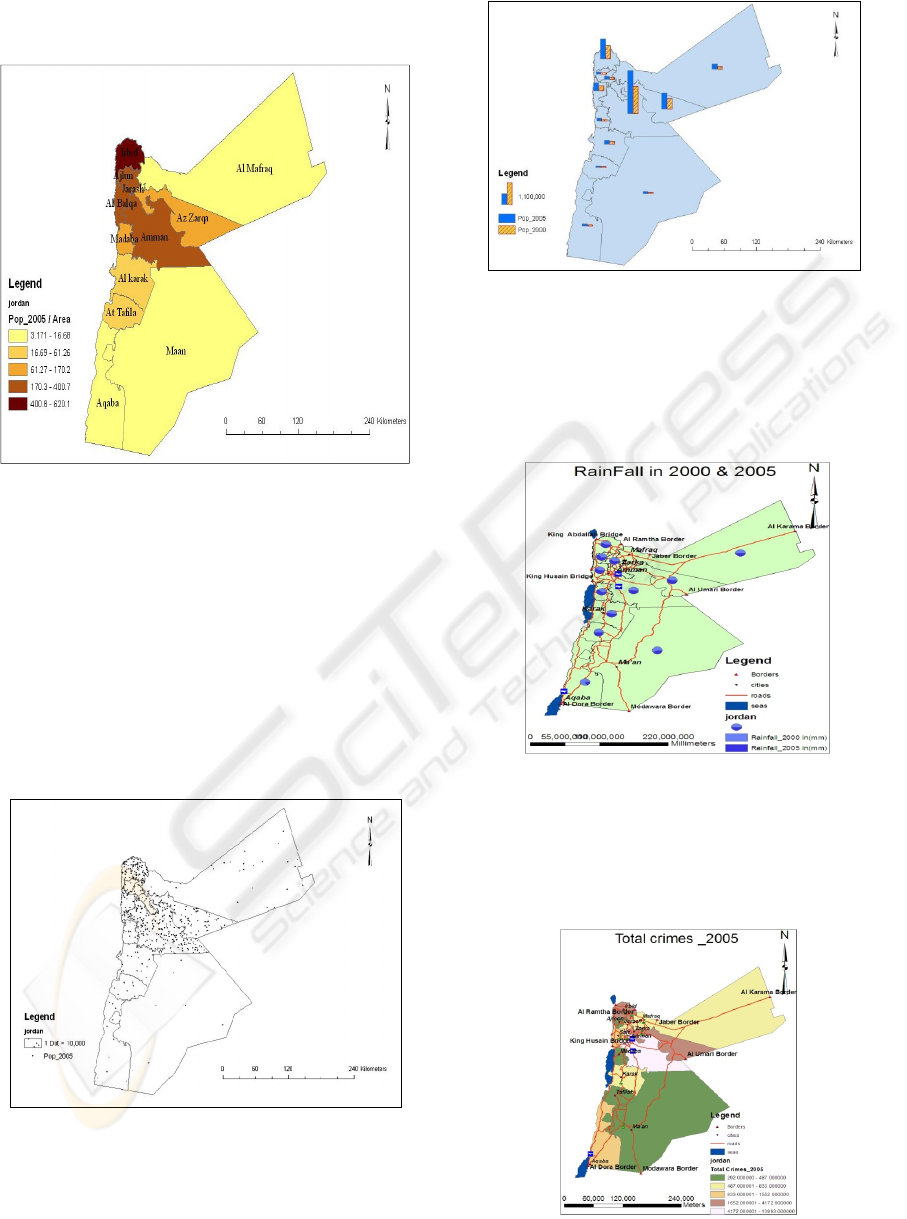
Figure 11: Population by governorate in the years 1990 &
2005.
Classification of population density for the years
2000 and 2005 (Fig.12) shows that Irbid
Governorate has the most population density. Mean
while, in Figure 13, we compare the population for
the same years 2000 and 2005 and the results reflect
that Amman has the largest population and not Irbid
governorate.
Figure 12: Population density by governorate in the years
2000 & 2005.
From a closer look to the population (number) by
Rural and urban for the years 2005 and 2003, we can
see clearly that the urban population in Jordan (blue
color) is more important than the rural one.
Figure 13: Population in 2005 & 2003 of the Urban and
Rural.
Figure 13 shows that in year 2005 the rural po-
pulation decreased alertly in the Maan governorate
(2005). This may be explained as the incline in the
agricultural area in the desert due to the lack of rain
and water in general. In a previous study that we
conducted using remote sensing, we found out the
same results in Maan area. Another Classification
ICE-B 2010 - International Conference on e-Business
36
method of population density in 2005 could be used
to clarify other relations.
Figure 14: Population density (2005).
Figure 14 shows that the governorate of Irbid has the
most population density in the country as it is the
mainly agricultural governorate with the most rural
population. The second in line is Amman, AlBalqa,
Ajlun and Jerash as they all contain big cities and
the least populated are the desert governorates with
the least population density and resources. In this
classification method we used the colors to join the
governorates which have the same density. Another
mode of presentation is the population density using
dot representation (Fig.15).
Figure 15: Population density in year 2005).
Figure 16: Population by gender in year 2005.
Figure 16 presents the Population in year 2005 by
gender, 17 and 18 present other examples to be used
in environmental (e.g, rain fall) and emergency
analysis and planning. Endless possibilities and
outcomes are offered using the created GIS system.
Figure 17: Rainfall in the years 2000 & 2005.
In Figure 18, we see that the highest General number
of Crimes in 2005 is in the big cities. Again we can
better understand reality of the statistics if we used
percentages (crime/pop) or a histograms repre-
sentation.
Figure 18: Numbers of General Crimes in year 2005.
A GEOGRAPHIC INFORMATION SYSTEM (GIS) TO DEFINE INDICATORS FOR DEVELOPMENT AND
PLANNING IN JORDAN
37

4 CONCLUSIONS
To conclude, a GIS system is created for The
Department of General Statistics in Jordan for all
purposes especially in optimal and informed
decision making and planning. The created digital
database is easy to use. We can manipulate, maintain
and update info effectively. In addition the data is
presented in an easy to understand and act upon it.
Finally, the ability of international information
sharing through a web-site creation, collaborative
environment and e-government development is
possible with such a system.
REFERENCES
P. A. Burrough, “Principles of Geographical Information
Systems for Land Resources Assessment". Clarendon
Press, Oxford, 1986.
N. R. Chrisman, “What Does 'GIS' Mean?” Transactions
in GIS, Vol. 3, No. 2, pp. 175-186, 1999.
K. J. Ducker, “Land Resource Information Systems: A
Review of Fifteen Years Experience". Geo-Processing,
Vol. 1, pp. 105-28, 1979.
J. Star and J. Estes, “Geographic Information Systems: An
Introduction". Prentice Hall, Englewood Cliffs New
Jersey, 1990.
C. Andronache, R. Hon, B. Mento, and R. Dalgin,”
"Mapping Hurricane Katrina with GIS", Proceedings
of the 2006 ESRI International User Conference
Proceedings, 2006. http://gis.esri.com/library/
proc06/papers/papers/pap_2320.pdf.
ICE-B 2010 - International Conference on e-Business
38
