
AN MOEA-BASED METHOD TO TUNE EA PARAMETERS
ON MULTIPLE OBJECTIVE FUNCTIONS
S. K. Smit, A. E. Eiben and Z. Szl´avik
Department of Computer Science, VU University Amsterdam, de Boelelaan 1081, Amsterdam, The Netherlands
Keywords:
Parameters, Evolutionary algorithms, Multi-function tuning, Parameter tuning.
Abstract:
In this paper, we demonstrate the benefits of using a multi-objective approach when tuning the parameters of
an Evolutionary Algorithm. To overcome the specific challenges that arise when using a meta-algorithm for
parameter tuning on multiple functions, we introduce a new algorithm called the Multi-Function Evolutionary
Tuning Algorithm (M-FETA) that is able to approximate the parameter Pareto front effectively. The results of
the experiments illustrate how the approximated Parameter Pareto front can be used to gain insights, identify
‘generalists’, and study the robustness of the algorithm to be tuned.
1 INTRODUCTION
In recent years there has been a growing interest
in automated parameter tuning methods in Evolu-
tionary Computing (EC). New tuning algorithms,
such as SPO (Bartz-Beielstein et al., 2005; Bartz-
Beielstein and Markon, 2004; Bartz-Beielstein et al.,
2004), REVAC (Nannen and Eiben, 2006; Smit and
Eiben, 2009), and Meta-ES (Yuan and Gallagher,
2007), have been developed and shown their success.
Their ability of fine-graining the search in the most
promising areas of the parameter space makes them
suited for users only in need for good parameter val-
ues. Traditional methods, as Design of Experiments
(DoE), often require huge computational efforts, te-
dious manual testing or a combination of both, and
are therefore less suited for such ‘lazy’ users. This
paper is concerned with a generalization of these kind
of tuning algorithms from tuning an Evolutionary Al-
gorithm (EA) on a single objective function, to tuning
an EA on a set of objective functions. In standard EC
terms, we are interested in robust parameter values
that make the EA that uses them a ‘generalist’, rather
than a ‘specialist’.
Identifying robust parameter values for a given
test suite is a non-trivial problem. A straightforward
approach is to define a preference vector containing
a weight for each function in the test suite and apply
a tuning algorithm to maximize the weighted average
of performances. In other words, a linear combina-
tion of the performances is maximized as a single-
objective optimization problem. However, as shown
in (Smit and Eiben, 2010), this approach runs into cer-
tain problems if the test suite contains fitness func-
tions with different levels of difficulty (and most test
suites do). In particular, the tuner will favor parameter
values driven by performance on the hard test func-
tions, thus introducing a bias that is not intuitive for
a common user. Alternatives to this simple approach
can be sought by looking at the multi-function tun-
ing problem as a multi-objective optimization prob-
lem. This view is quite natural: each fitness function
in the test suite corresponds to one objective. To be
precise, the EA performance on a test function is an
objective function to be maximized, hence a test suite
of M fitness functions induces a multi-objective opti-
mization problem with M objectives.
Making the step to the field of multi-objective op-
timization implies that we can benefit from the whole
body of knowledge of this field (Deb, 2001). In
particular, instead of reinventing the wheel, we can
adopt the common techniques from multi-objective
optimization algorithms, adjust it to the specific cir-
cumstances of tuning EA parameters and investigate
whether and to what extent it can be used as a multi-
function tuner. Notice, that this question about ap-
plicability is not as trivial as it may seem, because
tuning brings forward specific challenges. Firstly, the
stochastic nature of EAs to be tuned causes inherently
noisy measurements on the objectives. Secondly, the
large amount of tests required for a good result im-
plies impractical computational efforts.
When selecting a multi-objective optimization al-
gorithm we have two preferences. First, we have a
261
K. Smit S., E. Eiben A. and Szlávik Z..
AN MOEA-BASED METHOD TO TUNE EA PARAMETERS ON MULTIPLE OBJECTIVE FUNCTIONS.
DOI: 10.5220/0003106202610268
In Proceedings of the International Conference on Evolutionary Computation (ICEC-2010), pages 261-268
ISBN: 978-989-8425-31-7
Copyright
c
2010 SCITEPRESS (Science and Technology Publications, Lda.)

preference for an evolutionary method, based on the
large number of successful multi-objective evolution-
ary algorithms in the literature (Deb et al., 2002; Zit-
zler et al., 2001). Second, we want to have an algo-
rithm that produces the Pareto front of non-dominated
points in the search space (here: the space of parame-
ter vectors of the EA to be tuned). This preference is
motivated by the advantages this approach offers, e.g.,
it allows us to investigate interactions between fitness
functions, parameter values, and the evolutionary al-
gorithm. Furthermore, it allows us to identify various
‘generalists’ rather than a single one, as well as to an-
alyze the robustness of an EA.
The main contributions of this paper can be listed
as follows.
• We introduce a multi-function tuning algorithm
called M-FETA based on a Multi-Objective Evo-
lutionary Algorithm (MOEA) approach that is
able to cope the two principal challenges men-
tioned above.
• We demonstrate the benefits of using an approxi-
mated Pareto front by tuning an EA on the Sphere
and Rastrigin functions.
1
Namely, the parameter
Pareto front allows us to investigate interactions
between fitness functions, parameter values, and
the evolutionary algorithm. Furthermore, it allows
to identify different kinds of ‘generalists’ rather
than a single one, as well as to analyze the robust-
ness of an EA.
2 PARAMETERS, TUNERS, AND
UTILITY LANDSCAPES
In general, one can distinguish three layers in param-
eter tuning: the application layer, the algorithm layer,
and the design or tuning layer. The whole scheme can
be divided into two optimization problems. The lower
part of this three-tier hierarchy consists of a problem
on the application layer (e.g., the traveling salesman
problem) and an EA (e.g., a genetic algorithm) on the
algorithm layer trying to find an optimal solution for
this problem. Simply put, the EA is iteratively gen-
erating candidate solutions (e.g., permutations of city
names) seeking one with maximal quality. The upper
part of the hierarchy contains a tuning method that
is trying to find optimal parameter values for the EA
on the algorithm layer. Similarly to the lower part,
1
A test suite of 2 functions is certainly not large
(enough), but here we are mainly interested in a proof-of-
concept and demonstrating the new technology, rather than
real tuning on an ‘interesting’ test suite.
the tuning method is iteratively generating parame-
ter vectors seeking one with maximal quality, where
the quality of a given parameter vector ¯p is based on
the performance of the EA using the values of it. To
avoid confusion we use distinct terms to designate the
quality function of these two optimization problems.
Conform the usual EC terminology we use the term
fitness for the quality of candidate solutions on the
lower level, and the term utility to denote the quality
of EA parameter vectors.
In simplest case, the utility of a parameter vec-
tor ¯p is the performance of the EA using the values
of ¯p on a given test function F. Tuning an EA (by
whichever performance metric) on one single func-
tion F delivers a specialist, that is, an EA that is very
good in solving F with no claims or indications re-
garding its performance on other problems. This can
be a satisfactory result if one is only interested in solv-
ing that given problem. However, algorithm design-
ers in general, and evolutionary computing experts in
particular, are often interested in so called ‘robust pa-
rameter values’, that is, in parameter values that make
an EA using them work well on many problems. To
this end, test suites consisting of many test functions
are used to evaluate algorithms and to support claims
that a given algorithm is good on a ‘wide range of
problems’. This approach raises serious methodol-
ogy issues as discussed in (Eiben and Jelasity, 2002),
and may also be in conflict with theoretical results, cf.
(Wolpert and Macready, 1997), all depending on how
the claims are formulated. In this paper we do not
elaborate on these issues, but take a pragmatic stance
instead: We are after a method that is able to find pa-
rameter vectors that work well on a given set of test
functions.
3 MULTI-FUNCTION
EVOLUTIONARY TUNING
ALGORITHM
The Multi-Function Evolutionary Tuning Algorithm
(M-FETA) is, in essence, a Multi-Objective Evolu-
tionary Algorithm with a particular technique of as-
sessing the quality of candidate solutions. This tech-
nique is designed for being used within a parameter
tuner for EAs. In such applications candidate solu-
tions are EA parameter vectors whose quality is de-
fined by the performance of the EA on a collection
of functions F = { f
1
, . . . , f
M
}. By the stochastic na-
ture of EAs, this performance is a noisy observable.
In tuning terms, this means that the utility of a pa-
rameter vector ¯x can only be estimated. The usual
ICEC 2010 - International Conference on Evolutionary Computation
262

way of improving these estimates is to repeat the mea-
surements(Hughes, 2001; University and Fieldsend,
2005; Eskandari and Geiger, 2009; Deb and Gupta,
2005), that is, to do more EA runs using ¯x, but this is
clearly an expensive way of gaining more confidence.
The main idea behind our technique is to do just one
run with each parameter vector ¯x and to improve the
confidence by looking at the utilities of similar param-
eter vectors in our archive, assessed before.
2
To this end, we use the concept of neighborhoods,
as proposed in (Branke, 1998). The neighborhood N
¯x
of the parameter vector ¯x is defined as the k individu-
als from the archive with the smallest Euclidean dis-
tance to ¯x. These neighbors are used to ‘confirm’ the
utility of ¯x. In contrast to (Branke, 1998), we apply a
t-test with a confidence level of (1−M · α) in to com-
pare two parameter vectors ¯x and ¯y. In order to evalu-
ate their dominance, the 2· k data points showing the
EA performance of these parameter vectors in N
¯x
and
N
¯y
, respectively, are tested for a significant difference
in performance on each of the functions. To be pre-
cise, we say that certain parameter vector ¯x dominates
parameter vector ¯y if, and only if:
3
1. ∃ f ∈ F such that the performance of the EA on f
based on the data belonging to N
¯x
is significantly
better than the performance based on the data
belonging to N
¯y
,
and
2. ∀g ∈ F(g 6= f) the performance of the EA on g
for vectors in N
¯y
is not significantly better than
the performance for vectors in N
¯x
.
Based on dominance, we can rank parameter vec-
tors in many ways. Here we have choose for the com-
putationally least extensive measure, namely the rank
r
¯x
of ¯x is defined as the number of vectors that dom-
inate ¯x divided by 2 · k and then rounded down. This
measure ensures that vectors with a similar number of
dominating points receive the same rank.
Now we use ranking to compare and order param-
eter vectors. We consider a certain parameter vector ¯x
better than a parameter vector ¯y if, and only if:
1. ¯x has a lower rank than ¯y, or
2. ¯x and ¯y have the same rank, but ¯x is more isolated
than ¯y
2
In fact, we rely on a form of the strong causality prin-
ciple, stating that small changes to a parameter vector cause
only small changes in its utility.
3
This definition is less strict than in (Eskandari and
Geiger, 2009)
where ¯x is more isolated than ¯y iff, it is farther away
from its neighbors than ¯y:
∑
¯z∈N
¯x
d(¯x, ¯z) >
∑
¯z∈N
¯y
d(¯y, ¯z)
There are two important properties of this system
from the perspective of sampling new parameter vec-
tors for being tested. The first property is an inher-
ent bias towards preferring isolated vectors as par-
ents in M-FETA. This bias comes from the fact that
if the neighbors of a certain vector are too far, then
the standard-deviation of EA performance results in
N
¯x
is large. Large standard-deviations cause a t-test to
indicate ‘no significant difference’, which then lowers
the number of dominating vectors, and therefore de-
creases the rank. This, in turn, increases probability
of being selected for reproduction.
The second property is true (or at least assumed)
in the majority of reproductive systems and can be
popularized as “the apple does not fall far from its
tree”. In technical terms, this means that child vec-
tors of ¯x are likely to be close to ¯x. In the end,
this decreases the distances in its neighborhood, and
therefore sharpens the estimate of its utility. On the
other hand, if a certain vector with a high standard-
deviation already performs significantly worse than
other vectors, then no effort is invested into re-
evaluating it, an effect similar to racing (Maron and
Moore, 1997). This makes that the algorithm only
spends time on refining estimates and investigating
new points in promising areas, thus limiting the com-
putational efforts.
4 PARAMETER PARETO
FRONTS
The parameter Pareto set is formed by all parameter
vectors that are non-dominated, i.e., for which there is
no other parameter vector that performs significantly
better on one of the test functions, and at least as good
on the other functions. Each vector in the Pareto set
can therefore be seen as ‘robust’, but they all repre-
sent a different trade-off regarding the performance
on different test functions. Which is the most prefer-
able point on this front, is subject to particular user
preferences, for example:
1. The one with a maximum performance if all ob-
jectives have equal weights.
2. The one with the best performance on problem F
1
while maintaining a given level of minimum per-
formance on F
2
.
AN MOEA-BASED METHOD TO TUNE EA PARAMETERS ON MULTIPLE OBJECTIVE FUNCTIONS
263

0 0.25 0.5 0.75 1
0
0.25
0.5
0.75
1
A
B
Figure 1: The parameter Pareto fronts of a robust and a not robust algorithm.
In principle, single-function tuning could be used
(with some tweaks) to solve both of these example
cases. However, a multi-function approach using a
parameter Pareto front has additional advantages be-
cause of the various non-dominated options it offers.
For instance, in the first case one could discover that
by just a slight shift in preferences one can reach a
much better performance on F
1
without losing too
much performance on F
2
. Similarly for the second
case, an inspection of the Pareto front can disclose
that slight decrease in the performance threshold for
F
2
can yield a great increase in performance on F
1
.
Furthermore, parameter Pareto fronts can also be
used for the evaluation of algorithms. To this end, one
needs to consider the whole Pareto front that exhibits
information on the algorithm itself. (While one point
on the Pareto front only says something about the pa-
rameter vector it belongs to.) Figure 1 illustrates this
matter by showing the imaginary Pareto fronts of two
algorithms A and B. The x and y axes correspond to
test functions F
1
and F
2
, respectively, and we assume
that EA performance on both test functions is to be
maximized. Each dot in the graph belongs to a pa-
rameter vector ¯p with the obvious convention: the po-
sition hx
¯p
, y
¯p
i shows the performance of the given al-
gorithm (A or B) using ¯p on F
1
and F
2
. The graphs
in Figure 1 show very different Pareto fronts. While
both reach an equal performance level on both func-
tions, for algorithm A, increasing performance on F
1
is only possible at the cost of decreasing performance
on F
2
and vice versa. For B this is not the case, or
at least to a much lesser extent. For B it is possi-
ble to choose a single parameter vector (on the ‘knee’
point) that yields near optimal performance on both
test functions, while for algorithm A this is not pos-
sible. Therefore, one could say that algorithm B is
more robust than algorithm A.
5 EXPERIMENTAL SETUP
As described earlier, the experimental setup consist
of a three layer architecture. On the application layer,
we have chosen two widely used 10 dimensional test-
functions to be solved, namely: Sphere and Rastri-
gin. For the Rastrigin function, the Evolutionary Al-
gorithm is allowed for 8.000 evaluations, and on the
Sphere function 4.000.
On the algorithm layer, we have chosen a simple
genetic algorithm using N-point crossover, bitflip mu-
tation, k-tournament parent selection, and determinis-
tic survivor selection. This GA requires 6 parameters
to be defined as described in Table 1. The allowed
values for most of the parameters are defined by ei-
ther the population size or genome length (150). Be-
cause the test-functions require 10 dimensional real-
valued strings as input, a 15-bit Gray coding is used to
transform the binary string of length 150, into a real-
valued string of length 10. For population size, we
have chosen a maximum value of 200, which we be-
lieve is large enough for this genome size and allowed
number of evaluations.
Table 1: Parameters to be tuned, and their ranges.
Parameter Min Max
Population size 2 200
Generation Gap 1 Population Size
Mutation probability 0 1
# crossover points 1 149
Crossover probability 0 1
Tournament size 1 Population Size
On the design layer, M-FETA is used for tuning
the parameters of the Evolutionary Algorithm. The
M-FETA-parameter values used in these experiments
can be found in Table 2.
ICEC 2010 - International Conference on Evolutionary Computation
264

Table 2: M-FETA Parameters.
Population Size 500
Neighborhood Size 30
Significance level (α) 0.05
Crossover Probability 1.0
Mutation Probability 0.2
Mutation Size 0.01· (Parameter-Max - Parameter-Min)
Tournament Size 100
Elitism 490
Maximum number of vectors tested 15.000
6 RESULTS
In this section we present and discuss the results of
our experiment. Figure 2 shows the Pareto set based
on saved utility valuesof the two used functions as de-
termined by M-FETA (the values have been recorded
when M-FETA was terminated). The utility values
shown in Figure 2 were clustered into four clusters
using the expectation maximization (EM) algorithm
(Dempster et al., 1977) based on their utility values.
Points in the top left and bottom right corners,
clusters D and A, show the specialists, i.e. the pa-
rameter vectors that perform very well on one of the
functions, but much worse on the other. We can ob-
serve, for example, in the bottom right corner (Cluster
A), that, in order to gain even a little on the Sphere
function, one will concede significantly on the utility
value of the Rastrigin function. A similar trend can
be observed in the top left corner of Figure 2 (Cluster
D), which shows that to gain on the Rastrigin function
the utility values for the Sphere function will likely to
decrease greatly.
The approximated Pareto front also allows to for a
visual identification of a ‘generalist’. However, from
Figure 2 we can see that there is not a single ‘gener-
alist’ parameter vector for the two functions consid-
ered. If there was only a single best generalist, the
shape of the line determined by the points in Figure 2
would resemble a concave line. However, we may
notice that there are two ‘knee-points’ in the line (no-
tice them in Clusters B and C), which indicate two
‘pseudo-generalists’.
In Figure 2, we also show the performance of two
vectors G
1
,G
2
that are indicated as ‘generalist’ by
two different single-objective approaches. G
1
is de-
termined by optimizing on the equally weighted aver-
age performance (MBF) over the two functions used.
However, we can intuitively conclude that G
1
is not
a true generalist, as it is in the cluster that contains
specialists on the Rastrigin function.
As the ranges of the two optimized functions’ util-
ity values can differ significantly, taking the average
of the MBF values can introduce a bias towards one of
the functions. To overcome this problem, a weighted
average of the MBF values is used for optimization.
The weights are determined as follows. By tuning on
the two functions separately, we can record the cor-
responding best parameter vectors and utility values.
These utility values will determine the upper bounds
for the corresponding functions. Then, the best pa-
rameter vector on function F
i
is used to obtain the
utility on F
j
, and this utility will serve as the lower
bound for F
j
. The upper and lower bounds determine
a range for each of our functions, and these ranges are
used as weights in the single-objective function. The
performance of the vector obtained by this method is
shown in Figure 2 as G
2
.
In addition to G
1
and G
2
in the approximated
Pareto front, by observation, we can identify G
3
(at
the second knee-point) as well, thus finding a new
‘pseudo-generalist’. By plotting the Pareto front, we
are also better able to choose ‘where we want to be’,
i.e. it is possible to justify a weight choice by visu-
ally confirming a parameter vector’s usefulness, and
to place a utility value pair in context of other points.
In Section 4 we stated that the parameter Pareto
front can be used to compare the robustness of algo-
rithms as well. Although these experiments are exe-
cuted using only a single algorithm, and our test suite
is quite small, there are some indications we can de-
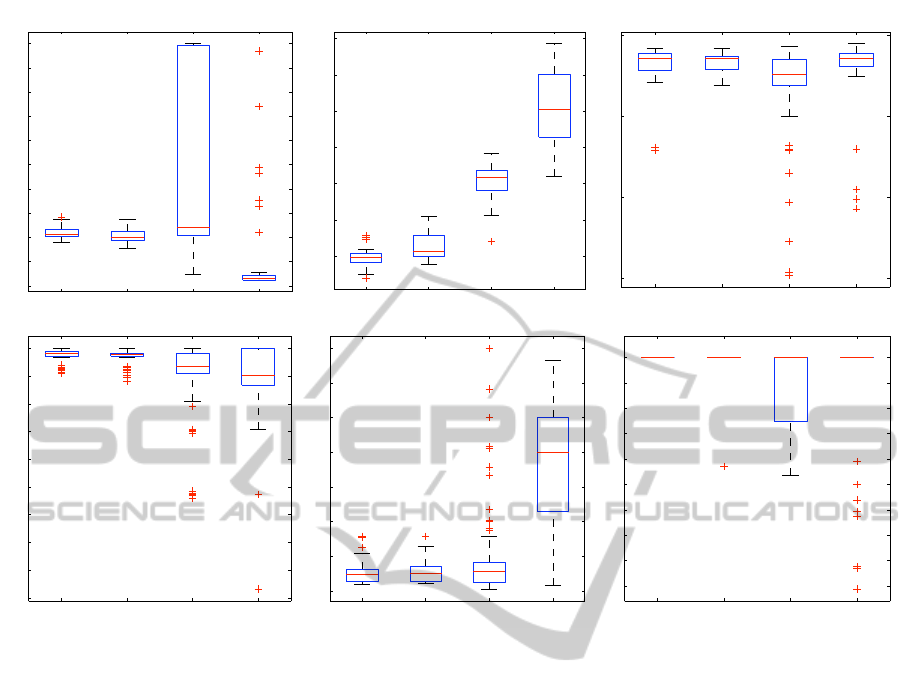
duce for the robustness of the algorithm. Figure 3
shows box plots of parameter vector values corre-
sponding to the clusters identified above. An indi-
cation of the robustness of the simple GA, can be ob-
tained as follows. For all parameters except the mu-
tation rate, a single parameter value can be found that
is part of all four clusters. This is either because the
values need to be in the same range (such as for tour-
nament size), or because this parameter is not relevant
for reaching a good performance (such as the genera-
tion gap on the Rastrigin function). This indicates that
we can define a value for these parameters that are op-
timal for both of the functions, except for the mutation
rate, which does not have such a value that works on
AN MOEA-BASED METHOD TO TUNE EA PARAMETERS ON MULTIPLE OBJECTIVE FUNCTIONS
265

!!"
!!
!!"
!#
!!"
!$
!!"
!%
!!"
!&
!!"
!'
!!%
!!$
!!#
!!!
!!"
!(
!)
!*
!'
!&
+,-./-0123,45246784/249:;,-,4!48
!
+,-./-0123,45246784/24<1=>-5?524!48
#
4
4
@AB=>,-4C
@AB=>,-4@
@AB=>,-47
@AB=>,-4D
E
#
E
$
E
!
Figure 2: The Parameter Pareto Front of a Simple GA on Sphere and Rastrigin.
both. In the end, we can conclude that the Simple GA
is quite robust, because only the mutation rate needs
to be changed when applied to different preferences
or functions.
With respect to the parameter values themselves,
some interesting conclusions can be drawn. It ap-
pears that the population size always needs to be quite
small, namely around 40. The variation and selec-
tion operators also show unconventional values. The
crossover rate need to be almost equal to 1 as usual,
but the number of crossover points is very high. The
same holds for mutation rate, as the commonly used
convention leads to
1
150
= 0.0067. To compensate for
these rough variation operators, a very high selection
pressure is applied, as can be seen by the small gen-
eration gap, and an almost deterministic parent selec-
tion.
To summarize, the multi-objective approach al-
lows for identifying specialist, and various ‘pseudo’
or ‘global’ generalists, rather than a single vector.
Furthermore, such an approach gives insight into the
interactions between the performances on the func-
tions of a certain test-suite and can give indications
about the robustness of the tuned algorithm that could
not have been gained using a single-objective ap-
proach.
7 CONCLUSIONS
In this paper we have introduced an algorithm called
M-FETA designed for multi-function tuning. This al-
gorithm is applicable for any number of test-functions
and can cope with noisy measurements of utility,
without requiring a large amount of tests to approx-
imate the parameter Pareto front.
By approximating the parameter Pareto front us-
ing M-FETA, we have been able to investigate inter-
actions between fitness functions, parameter values,
and the evolutionary algorithm. By inspecting the
Pareto front, the trade-off between good performance
on either of the test functions was clearly visible. This
enables EA practitioners to find a balanced EA setup
reflecting their actual preferences.
We have also been able to identify different ‘gen-
eralists’. The shape of the Pareto front exhibited mul-
tiple knee-points that indicated ‘pseudo-generalists’.
This delivered valuable information, as only one of
them would be discovered by using a simple multi-
function tuning by averaging approach.
Last, but not least, we obtained insights into the
robustness of an EA as well. To be specific, cluster-
ing the parameter vectors in the Pareto front and ana-
lyzing value distribution for each parameter (the box
plots in Figure 3) we could draw conclusions on the
robustness of the EA parameters.
Although the experiments in this paper are limited
with respect to the number of test-functions, it proofs
the concept that multi-function tuning is not only pos-
ICEC 2010 - International Conference on Evolutionary Computation
266
A B C D
0
20
40
60
80
100
120
140
160
180
200
Population size
A B C D
0.01
0.015
0.02
0.025
0.03
0.035
0.04
Mutation rate
A B C D
0
50
100
150
Number of crossover points
A B C D
0.1
0.2
0.3
0.4
0.5
0.6
0.7
0.8
0.9
1
Crossover rate
A B C D
0
0.1
0.2
0.3
0.4
0.5
0.6
0.7
Generation gap (norm.)
A B C D
0.1
0.2
0.3
0.4
0.5
0.6
0.7
0.8
0.9
1
Tournament size (norm.)
Figure 3: Parameters Value Ranges in each of the clusters.
sible, but also provides unique insights that could not
have been gained by means of single-objective tuning
algorithms. More importantly, it can be used for ac-
quiring ‘generalist’ parameter values that work well
on a given test-suite and also fit the preferences of the
user. In the near future, we will apply M-FETA to
larger test-suites, and more advanced algorithms, to
obtain robust EA’s and gain insights into interactions
between parameters, EA’s and test-functions.
REFERENCES
(2005). Proceedings of the 2005 IEEE Congress on Evolu-
tionary Computation, Edinburgh, UK. IEEE Press.
Bartz-Beielstein, T., Lasarczyk, C., and Preuss, M. (2005).
Sequential parameter optimization. In (CEC, 2005),
pages 773–780 Vol.1.
Bartz-Beielstein, T. and Markon, S. (2004). Tuning search
algorithms for real-world applications: A regression
tree based approach. Technical Report of the Col-
laborative Research Centre 531 Computational Intel-
ligence CI-172/04, University of Dortmund.
Bartz-Beielstein, T., Parsopoulos, K., and Vrahatis, M.
(2004). Analysis of Particle Swarm Optimization Us-
ing Computational Statistics. In Chalkis, editor, Pro-
ceedings of the International Conference of Numerical
Analysis and Applied Mathematics (ICNAAM 2004),
pages 34–37.
Branke, J. (1998). Creating robust solutions by means of
evolutionary algorithms. In PPSN V: Proceedings of
the 5th International Conference on Parallel Problem
Solving from Nature, pages 119–128, London, UK.
Springer-Verlag.
Deb, K. (2001). Multi-Objective Optimization using Evolu-
tionary Algorithms. Wiley-Interscience Series in Sys-
tems and Optimization. John Wiley & Sons, Chich-
ester.
Deb, K. and Gupta, H. (2005). Searching for robust pareto-
optimal solutions in multi-objective optimization. In
EMO, pages 150–164.
Deb, K., Pratap, A., Agarwal, S., and Meyarivan, T. (2002).
A fast and elitist multiobjective genetic algorithm :
Nsga-ii. Evolutionary Computation, IEEE Transac-
tions on, 6(2):182–197.
Dempster, A., Laird, N., and Rubin, D. (1977). Maxi-
mum likelihood from incomplete data via the EM al-
gorithm. Royal Statistical Society B, 39:1–38.
Eiben, A. and Jelasity, M. (2002). A Critical Note on Exper-
imental Research Methodology in EC. In Proceedings
of the 2002 IEEE Congress on Evolutionary Compu-
tation (CEC 2002), pages 582–587. IEEE Press.
AN MOEA-BASED METHOD TO TUNE EA PARAMETERS ON MULTIPLE OBJECTIVE FUNCTIONS
267

Eskandari, H. and Geiger, C. D. (2009). Evolutionary
multiobjective optimization in noisy problem environ-
ments. Journal of Heuristics, 15(6):559–595.
Hughes, E. (2001). Evolutionary multi-objective ranking
with uncertainty and noise. In EMO ’01: Proceed-
ings of the First International Conference on Evolu-
tionary Multi-Criterion Optimization, pages 329–343,
London, UK. Springer-Verlag.
Maron, O. and Moore, A. (1997). The racing algorithm:
Model selection for lazy learners. In Artificial Intelli-
gence Review, volume 11, pages 193–225.
Nannen, V. and Eiben, A. (2006). A method for parame-
ter calibration and relevance estimation in evolution-
ary algorithms. In Keijzer, M., editor, Proceedings
of the Genetic and Evolutionary Computation Confer-
ence (GECCO-2006), pages 183–190. Morgan Kauf-
mann, San Francisco.
Smit, S. and Eiben, A. (2009). Comparing parameter tuning
methods for evolutionary algorithms. In Proceedings
of the 2009 IEEE Congress on Evolutionary Compu-
tation, pages 399–406, Trondheim. IEEE Press.
Smit, S. and Eiben, A. (2010). Parameter tuning of
evolutionary algorithms: Generalist vs. specialist.
In EvoApplications 2010, Part I, pages 542–551.
Springer.
University, J. F. and Fieldsend, J. E. (2005). Multi-objective
optimisation in the presence of uncertainty. In (CEC,
2005), pages 476–483.
Wolpert, D. H. and Macready, W. G. (1997). No free lunch
theorems for optimization. IEEE Transaction on Evo-
lutionary Computation, 1(1):67–82.
Yuan, B. and Gallagher, M. (2007). Combining Meta-EAs
and Racing for Difficult EA Parameter Tuning Tasks.
In Lobo, F., Lima, C., and Michalewicz, Z., editors,
Parameter Setting in Evolutionary Algorithms, pages
121–142. Springer.
Zitzler, E., Laumanns, M., and Thiele, L. (2001). Spea2:
Improving the strength pareto evolutionary algorithm.
Technical Report 103, Gloriastrasse 35, CH-8092
Zurich, Switzerland.
ICEC 2010 - International Conference on Evolutionary Computation
268
