
USING UNIFORM CROSSOVER TO REFINE SIMULATED
ANNEALING SOLUTIONS FOR AUTOMATIC DESIGN
OF SPATIAL LAYOUTS
Fadratul Hafinaz Hassan
1, 2
and Allan Tucker
1
1
Department of Information System & Computing, Brunel University West London,U.K.
2
School of Computer Science, University Science of Malaysia ,Penang, Malaysia
Keywords: Genetic algorithm, Simulated annealing, Hill-climbing, Cellular automata, Pedestrian simulation, Spatial
layout.
Abstract: The ease of movement of people inside a public space is highly impacted by the public space layout itself.
For example, the flow of a large number of people should be smooth in a well designed public space such as
a stadium or hospital. In extreme cases, people might crush to death during emergency evacuations in
poorly designed spaces. It is vital that design takes into account the smooth flow of pedestrians. In this
paper we describe an initial exploration in using models of pedestrian flow combined with heuristic search
to assist in the automatic design for spatial layout. A two-way pedestrian flow system is simulated and
heuristic search techniques (genetic algorithm, simulated annealing and hill climbing) are used to find
feasible spatial layouts based upon the generated statistics with promising results.
1 INTRODUCTION
Pedestrian flow is an integral part of spatial layout
design. The spatial layout of public space has an
enormous impact upon the ease with which people
can move. There are a number of projects that have
used pedestrian simulation to test pedestrian routes
for airport terminal floor plans, stadium plans,
shopping malls, and galleries (Batty et al., 2003,
Dijkstra and Timmermans, 2002, Pan et al., 2006,
Smedresman, 2006, Zhu et al., 2008). Based on the
previous works, a computer simulation of pedestrian
movement was identified as a useful method to help
designers to understand the relation between spatial
layout and human behaviour. It is vital that spatial
layout design takes into account the smooth flow of
pedestrians which will demonstrate how appropriate
traffic control can effectively address congestion and
safety issue. Pedestrian flow is going to be simulated
by using the concept of cellular automata (CA). This
approach is taken because CA presents a simple
local rule describing the behaviour of each
automaton that can create an approximation of actual
individual behaviour (Dijkstra and Timmermans,
2002). Evolutionary algorithm search method is
preferred for this study because of its principle of
artificial selection: the process involves randomly
mutating a large number of individuals, ranking
them, selecting the best, and iterating over and over
again. According to Smedresman, 2006, they are
particularly adept at sifting through large search
space as in floor plan design domain to find
solutions that may not intuitively present
themselves.
Spatial layout is one of the most challenging
phases of architectural design, and this type of
problem is an NP-hard class which belongs to a
complex combination optimization (Charman et al.,
1994, Honda and Mizoguchi, 1995). In other words,
algorithm for solving this problem needs a very long
running time and a great storage space when the
scale of the problem is large. For solving
combinatorial optimization problem, effective
methods include genetic algorithm, simulated
annealing and hill climbing.
In this paper, we compare simulated annealing
(SA) and hill climbing (HC) with updates that
involve simple genetic algorithm (GA) operators in
order to find solutions to a room layout. This
involves walls/obstacles randomly distributed in a
10-by-10 grid with two types of pedestrian moving
inside the space: one moving from left-to-right and
373
Hassan F. and Tucker A..
USING UNIFORM CROSSOVER TO REFINE SIMULATED ANNEALING SOLUTIONS FOR AUTOMATIC DESIGN OF SPATIAL LAYOUTS .
DOI: 10.5220/0003113503730379
In Proceedings of the International Conference on Evolutionary Computation (ICEC-2010), pages 373-379
ISBN: 978-989-8425-31-7
Copyright
c
2010 SCITEPRESS (Science and Technology Publications, Lda.)

another one moving right-to-left based upon the
cellular automata model of Yue et al., 2007. The
aim of the experiments is to compare and understand
how fast and effective the algorithms can generate
(not simply refine as in Smedresman, 2006)
automatic solutions to the spatial layout problem by
using statistics generated from cellular automata
pedestrian simulations.
2 METHODOLOGY
The experiments involve applying simulated
annealing (SA), hill climbing (HC) and a form of
repeated SA that is updated with genetic algorithm
(GA) operator (SA-GAO) to solve the spatial layout
problem. It is not feasible to have a full GA
implementation due to the very complex fitness
function involving several pedestrian simulations.
The methods analysed in this paper have been run
using a pedestrian movement model developed by
Yue et al., 2007. They proposed two pedestrian
movement models on a square lattice for small
system based on cellular automata (CA), i.e. two-
way pedestrian flow and four-way pedestrian flow.
They introduced a technique to simplify tactically
the process into the interaction of four dynamic
parameters, which can reflect the pedestrian
judgment on the surrounding conditions and decide
the pedestrian's choice of action such as moving
ahead, stopping to wait, position exchange, lane
switching, back stepping, etc. In this paper, the two-
way pedestrian flow system is simulated and studied
using the Dynamic Parameters Model from Yue et
al., 2007 to consider direction split and pedestrians’
walking preference.
In this model, pedestrian choose to wait or move
according to the corresponding transition payoff
based on four parameters:
Direction-parameter indicates the cell’s degree
of approximation to the pedestrian destination;
Empty-parameter indicates whether the cell is
occupied or empty;
Forward-parameter describes the proportion of
empty cells in the field ahead of his or her target
position;
Category-parameter describes the proportion of
the number of empty cells and pedestrians
homogenous with the subject in his or her direction
of destination in the field around his or her target
position.
2.1 Hill Climb and Simulated
Annealing
The pseudocode for our implementation of this
approach is listed in Figure 1.
Figure 1: Pseudo-code for the Hill Climb and Simulated
Annealing.
In order to set this as a HC, the starting
temperature is set to zero. Note that the fitness here
Input: Number of iterations, iteration,
and a random starting layout, startrep,
starting temperature, temperature
oldrep = startrep;
Apply 10 pedestrian simulations to
generate statistics, stats
fit = fitness(stats)
bestfit = fit
for loop = 1:iteration
rep=oldrep;
Apply move operator to rep
Apply 10 pedestrian simulations to
stats
newfit = fitness(stats);
dscore = newfit-fit
if ((bestfit < newfit) OR
(rand(0,1) <e
(dscore/temperature)
)
bestfit = newfit
oldrep = rep;
else
rep = oldrep;
end if
temperature = temperature*0.9
end for
Output: rep
ICEC 2010 - International Conference on Evolutionary Computation
374
uses the statistics generated from 10 repeated runs of
the CA pedestrian simulation. This is done to ensure
that one simulation does not result in a ‘lucky’
fitness score for one layout based upon the starting
positions of the pedestrians.
2.2 Move Operator
The move operator, shown in Figure 2, takes into
account the size of the simulation grid and randomly
moves one object a fraction of this distance
(determined by the parameter changedegree). The
result of the move is then checked to see if the new
coordinates are within the bounds of the grid and do
not result in the object overlapping with others. The
operator is defined fully in Figure 2, where
unidrnd(min,max) is a uniform discrete random
number generator with limits of min and max.
Figure 2: Pseudo-code for Move Operator.
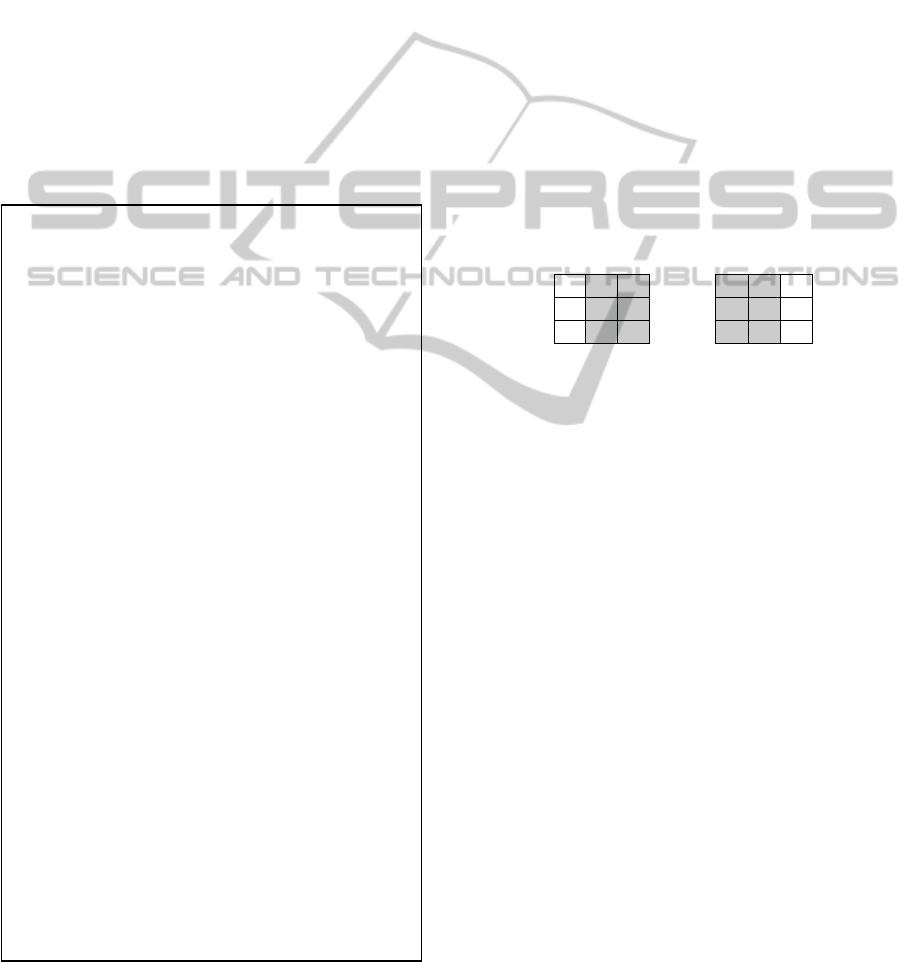
2.3 Fitness Function
The fitness function is calculated based on the
statistics that are generated using the pedestrian
simulation. The statistics take the form of a 3x3
matrix, leftstats, representing the sum of decisions
for left-moving pedestrians and a similar decision
matrix for right-moving pedestrians, rightstats.
Therefore, the middle cell in each grid represents
how many times the pedestrians decided to stay in
the same cell as last time. As we wish to encourage
free flow we wish to increase the fitness for layouts
that results in many cases of left moving pedestrians
moving left and right moving pedestrians moving
right, whilst penalising the fitness of any decisions
where the left-moving pedestrians move right and
vice-versa. For example, consider the two stats
matrices for left and right pedestrians. It is clear that
the leftstats reflect a ‘good’ result as the pedestrians
have generally moved in the desired direction more
often whereas for rightstats this is not the case.
3 1 1 3 3 2
5 3 0 2 2 2
3 2 2 2 3 1
leftstats rightstats
Figure 3: Left and Right statistics – describe as 3x3
matrix.
In general, we wish to maximise the first column
in leftstats and the third column in rightstats whilst
minimising the other statistics (shaded in the
example, Figure 3). Therefore, we use the following
fitness function:
rightfitness = sum (rightstats(3,1:3))-sum(rightstats(1,1:3)
leftfitness = sum (leftstats(1,1:3))-sum(leftstats(3,1:3)
fitness = rightfitness + leftfitness
Higher fitnesses should reflect simulations
whereby pedestrians have moved in the direction
that they wish more often.
2.4 SA Genetic Algorithm Operators
We extend our work by using GA-style operators. A
full GA implementation is not feasible due to the
very complex fitness function involving several
pedestrian simulations. Therefore, we extend our
work by using GA-style operators on the results of
multiple starts of SA. The initial ‘parents’ are
selected from the best (selection are made based on
more consistent fitnesses value with a good final
layout which is 9.000 or above) solutions generated
Input: Size of simulation grid, W, size
of object, sizobj, current x-coordinate,
oldx, current y-coordinate, oldy
Set the degree of change to make based
upon a fraction of the grid size:
changedegree=W/2;
Choose a random object in the grid, i
[oldx,oldy] = current x and y
coordinates of object i
xchange = unidrnd(-changedegree/2,
changedegree/2)
ychange = unidrnd(-changedegree/2,
changedegree/2)
if ( (oldy+ychange) and (oldx + xchange)
is within grid boundary AND new object
position does not overlap another object
taking into account sizobj)
newx=oldx+xchange;
newy=oldy+ychange;
end if
Move object i to position [newx, newy]
Output: newx, newy
USING UNIFORM CROSSOVER TO REFINE SIMULATED ANNEALING SOLUTIONS FOR AUTOMATIC DESIGN
OF SPATIAL LAYOUTS
375
from a number of SA experiments. We
experimented with different style of combination for
two ‘parents’ that more or less act like uniform
crossover. In the crossover operation, two new
children are formed by exchanging the genetic
information between two ‘parent’ chromosomes.
Multipoint crossover defines crossover points as
places between loci where an individual can be split.
Uniform crossover generalizes this scheme to make
every locus a potential crossover point. A crossover
mask, the same length as the individual structure is
created at random and the parity of the bits in the
mask indicate which parent will supply the offspring
with which bits.
Consider the following two parents with 10
binary variables each:
Parent1 1 1 1 1 1 1 1 1 1 1
Parent2 2 2 2 2 2 2 2 2 2 2
For each variable, the parent who contributes its
variable to the children is chosen randomly with
equal probability. Here, children 1 is produced by
taking the bit from parent 1 if the corresponding
mask bit is 1 or the bit from parent 2 if the
corresponding mask bit is 2. Children 2 is created
using the inverse of the mask, usually.
Mapping 1 2 1 1 2 2 2 1 1 2
After crossover the new individuals are created:
Children1 1 2 1 1 2 2 2 1 1 2
Children2 2 1 2 2 1 1 1 2 2 1
3 RESULTS
The experiments involved running HC, SA and SA-
GAO on the problem of trying to arrange 10 pre-
defined objects in a 10x10 grid with 5 ‘left’
pedestrians and 5 ‘right’ pedestrians. Each algorithm
was run 10 times and the learning curves were
inspected. The final fitnesses and quality of the
layouts were then investigated. Finally, some
inspection of sample simulations on the final layouts
was carried out to look for interesting
characteristics.
3.1 Summary Statistics
Table 1: Summary statistics of final fitness.
Method Min. Max. Mean Std. Dev.
SA1 3.846 9.790 7.615 1.854
SA2 4.786 9.938 8.085 1.477
HC 6.992 9.276 8.586 0.724
Table 1 shows the minimum, maximum and mean
values for the final fitness of each algorithm over ten
experiments, where SA1 represent SA with initial
temperature of 1.0 and SA2 represents a temperature
of 0.2. The statistical values of HC show the
robustness of the solutions with the standard
deviation of 0.724. The standard deviation is
relatively low, which indicates that HC is among the
most consistent approach in finding a good solution
(the mean is also higher). However, the maximum
value is less than SA2 indicating that the SA can
sometimes escape some of the local optima.
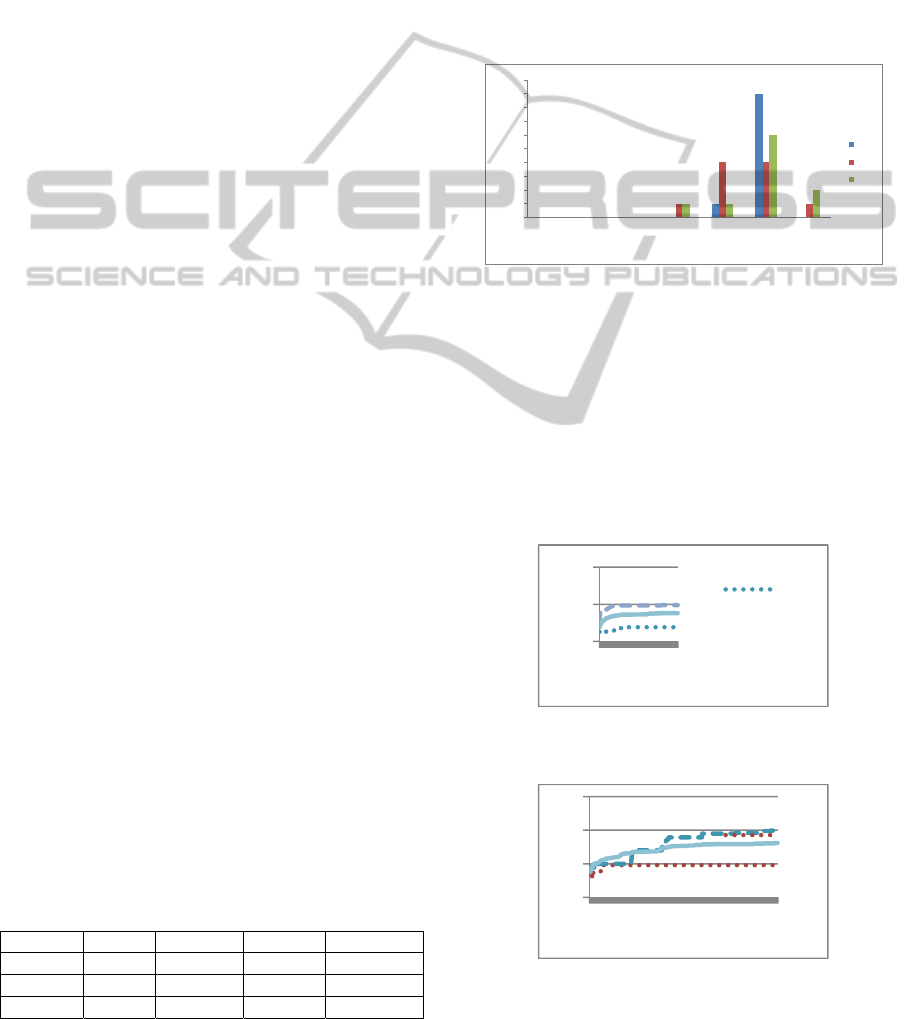
Figure 4: Distribution of Final Fitness for each Search
Method.
Figure 4 shows the final fitness distribution for
each search method. From Table 1 and this figure, it
is clear that the distribution of the fitnesess for the
SA algorithms for both temperatures is spread more
than for the HC. SA is sometimes empirically better
at avoiding local minima than hill-climbing though
HC is the most consistent approach based on Table
1.
Figure 5: Max, Min and Mean learning curves for SA
temperature = 1.0.
Figure 6: Max, Min and Mean learning curves for SA
temperature = 0.2.
0
1
2
3
4
5
6
7
8
9
10
"< 0" "0‐2" "2‐4" "4‐6" "6‐8" "8‐10" "10‐12"
Fitness
Frequency
HC
SA1
SA2
0
10
20
1 168335
SA
1
mi
n.
0
5
10
15
1
64
127
190
253
316
379
442
SA
2
mi
n.
ICEC 2010 - International Conference on Evolutionary Computation
376
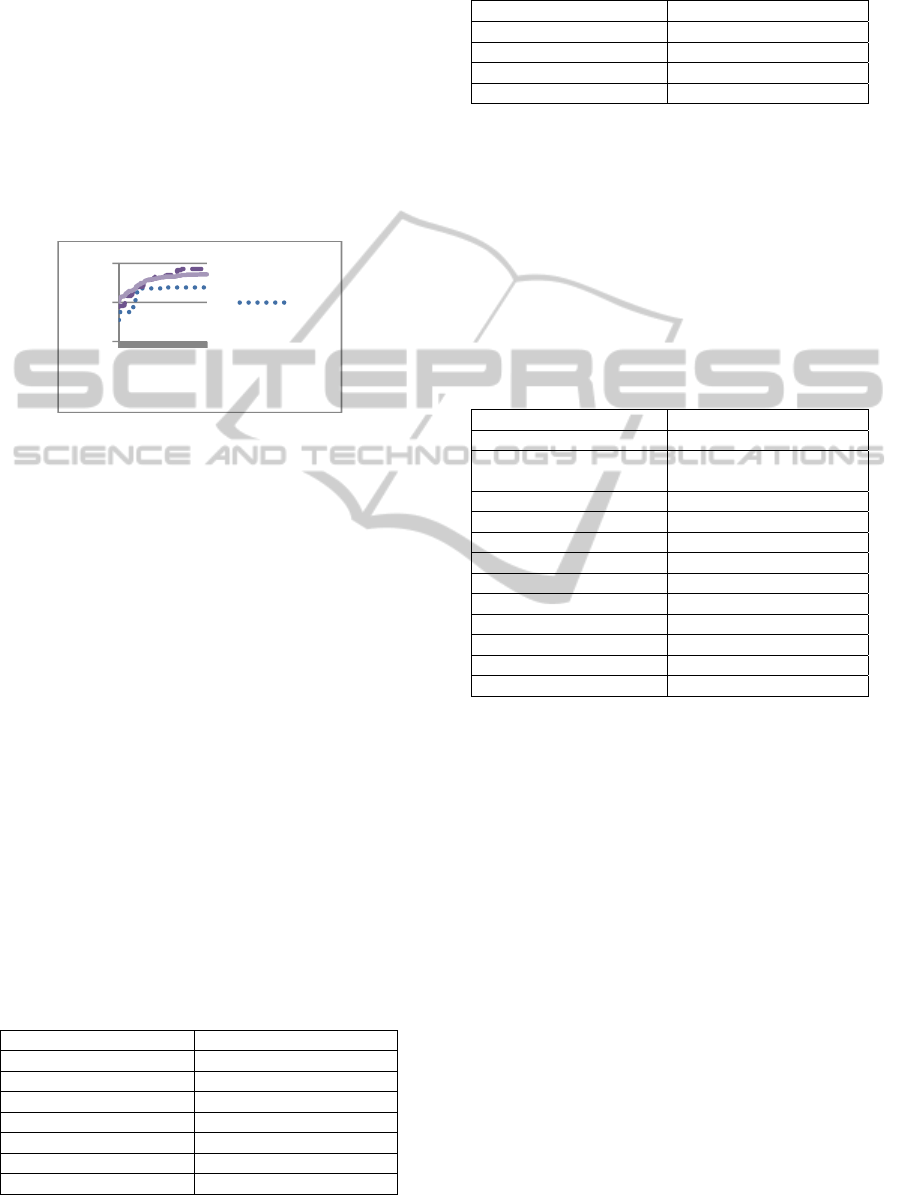
The graphs in Figures 5 and 6 show the best,
worst and mean learning curves for the SA
algorithm over 10 reruns with two initial starting
temperatures. The total iteration for every learning
curve is 500 iterations. These curves characterise the
typical SA with noisy search at high temperatures in
the early phases followed by smoother learning in
the later stages. It seems the higher starting
temperatures result in more diverse final fitnesses.
This could be due to the fact that the fitness
landscape is very noisy and difficult to negotiate,
resulting in many local optima.
Figure 7: Max, Min and Mean learning curves for HC.
However, the HC curves in Figure 7 show far
less variations in final fitness that is surprising.
Despite the mean final fitness of HC being better
than SA, it is clear that the SA does indeed escape
sub-optimal local peaks in the fitness on some
occasions with the maximum final fitness being
higher than HC. Clearly this is likely to be due to
HC techniques exploiting the best available solution
for possible improvement but neglecting exploring a
large portion of the search space (Michalewicz &
Fogel, 2000). Additionally, the higher starting
temperature for SA seems to result in better
solutions but at the expense of greater variance in
the final fitness.
We then expanded our work to SA-GAO. Four
different mappings were run and each was run 10
times. Seven ‘parents’ were selected from the
consistent resulting solutions of previous SA
experiments where each of their fitness values is
9.000 or above. The highest ‘parent’ fitness is
10.048 as shows in Table 2.
Table 2: Selected ‘parents’ and their fitness value for SA-
GAO experiments.
Parents Fitness
Parent1 9.382
Parent2 10.048
Parent3 9.010
Parent4 9.124
Parent5 9.780
Parent6 9.438
Parent7 9.414
Table 3: ‘Children’ with highest fitness values generated
from SA-GAO of four different combinations.
Mapping Max. Fitness
1122211222 10.434
1112221112 10.460
1112111211 10.398
1212121212 9.672
Table 3 shows different mappings of uniform
crossover and the highest fitness value of the
children for each combination. The fitnesses of the
‘children’ scored better compared to the ‘parents’
highest fitness value. This implies that recombining
the best of the SA solutions can indeed improve the
overall layout without having to implement a full
GA which would not be feasible for such an
expensive fitness function.
Table 4: ‘Children’ with highest fitness values generated
from SA-GAO of one hundred random combinations.
Mapping Max. Fitness
2122112111 9.642
2212221212 Child1: 9.714,
Child2: 9.476
1211122122 9.178
2121221121 9.846
2121122212 9.322
2221121212 9.092
2212211112 9.656
2122112111 9.466
1121111221 9.046
2122211111 9.200
2122222111 9.378
1222211122 9.112
We next tried to experiment with one hundred
random combination of mappings. The highest
fitness of the children is 9.846 as shown in Table 4
generated from ‘2121221121’ mapping. Note that
mapping ‘2212221212’ generates both ‘child1’ and
‘child2’ with good fitness (higher than 9.000). This
result shows that it may be necessary to run quite a
large number of recombination of parents to ensure
improved fitness. It may also imply that further
mutations are required to fine-tune these new
solutions.
3.2 Exploring the Final Layouts
We now explore some of the characteristics of the
final layouts discovered by the algorithms. The
blue/down arrows in figure 8 (a)-(e) represent the
final positions of wall layout; 500 iterations using
SA, HC and SA-GAO algorithm. Meanwhile, the
black and pink arrows represented left and right
pedestrians moving in each ways. From Figure 8 (a)
0
5
10
1
168
335
HC
mi
n
USING UNIFORM CROSSOVER TO REFINE SIMULATED ANNEALING SOLUTIONS FOR AUTOMATIC DESIGN
OF SPATIAL LAYOUTS
377
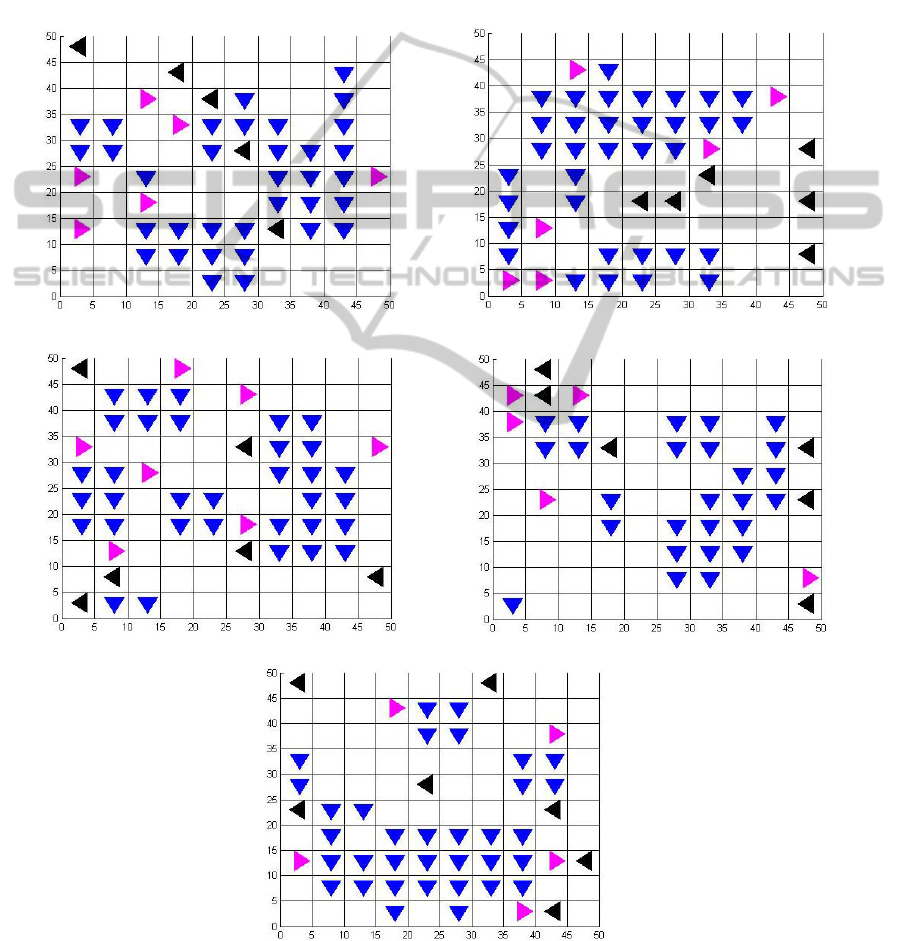
and (b), we can see clearly that the bad layouts are
generated from the series of lowest fitness. The
higher the fitness, the better the layout as in Figure 8
(c), (d) and (e). Notice in 8 (a) (the lowest fitness for
SA with starting temperature of 0.2) the large wall
created by the objects on the right were blocking any
left-right movement. It may be that more complex
operators are required to escape from this point. The
lowest scoring HC in Figure 8 (b) features a long
wide corridor in the centre which results in an
“almost dead end” at the left. Notice the completed
“corridor” in Figure 8 (c) from left to right with a
width of 1 cell allowing free flow of both left and
right pedestrians. Also note the alternative routes.
Figure 8 (d) shows the highest scoring layout of HC
with the existence of single cell corridors allowing
some free flowing movements. Finally, notice in the
Figure 8 (e) for the highest fitness of SA-GAO that
there are two “corridors” at the top and bottom of
the final layout.
(a) SA (temperature = 0.2) Final layout with lowest fitness of 4.786. (b) HC final layout with lowest fitness of 6.992.
(c) SA (temperature = 0.2) Final layout with highest fitness of 9.938. (d) HC final layout with highest fitness of 9.276.
(e) SA-GAO final layout with highest fitness of 10.460.
Figure 8: (a)-(e). SA, HC and SA-GAO final layouts.
ICEC 2010 - International Conference on Evolutionary Computation
378

4 CONCLUSIONS
In this paper we explored using pedestrian flow
simulations combined with heuristic search to assist
in the automatic design for spatial layout planning.
Using pedestrian simulations, the activity of crowds
can be used to study the consequences of different
spatial layouts.
Based on the results that have been observed in
this paper, we have demonstrated that simple
heuristic searches appear to deal with the NP-hard
spatial layout design problem to some degree, at
least on the very much simplified problem addressed
here. Both SA and HC are able to automatically find
adequate solutions to this problem when
incorporated with the pedestrian simulator.
Moreover, the solution is further improved when we
paired ‘parents’ and apply a GA style operator using
our method SA-GAO. Whilst it is not guaranteed
that the optimal solution will be found, this does not
mean that useful and unexpected designs cannot be
learnt using these types of approaches. Indeed, the
real positive outcome of the experiments here is that
we found certain characteristics that may not have
been immediately expected. We have found several
key results:
The highest fitnesses produced useful layouts,
passageways (diagonal or horizontal) and clustered
objects. These demonstrably show smoother flow
when running the simulations and exploring the
statistics of movement;
SA has more variations in final fitness. Whilst
HC cannot ‘escape’ local optima, SA does
sometimes manage to do this with better final
solutions. In general, the distribution of final
fitnesses is higher for SA though more adventurous
solutions are explored;
SA-GAO generated better solutions compared
to SA solutions: the SA-GAO children show higher
fitnesses than their parents. This implies that
solutions with lower fitnesses may still offer useful
information and when these are recombined in a
constructive way, they generate better overall
layouts than if no recombination is used.
We feel that approaches that combine heuristic
search with simulation should offer the ability to
find novel design solutions in more complex design
layouts with larger spaces, more objects, different
constraints and different pedestrian goals. In general,
we found that SA-GAO treats combinations of two
existing solutions as being ‘near’, making the
‘children’ share the properties of their parents, so
that a child of two good solutions is more probably
good than a random solution as in HC and SA.
Future work will involve extending our work by
make use of real world data to validate the
discovered layouts. We have access to large amounts
of pedestrian flow data in existing public buildings
and private offices. We will use the data to further
test our algorithms on layouts discovered from more
complex real-world spaces.
REFERENCES
Batty, M., Desyllas, J. & Duxbury, E. 2003, The discrete
dynamics of small-scale spatial events: agent-based
models of mobility in carnivals and street parades,
International Journal of Geographical Information
Science, vol. 17, no. 7, pp. 673-697.
Charman, P., Cermics, I. & Antipolis, S. 1994, A
constraint-based approach for the generation of floor
plans, Tools with Artificial Intelligence, 1994.
Proceedings., Sixth International Conference on, pp.
555.
Dijkstra, J. & Timmermans, H. 2002, Towards a multi-
agent model for visualizing simulated user behavior to
support the assessment of design performance,
Automation in Construction, vol. 11, no. 2, pp. 135-
145.
Honda, K. & Mizoguchi, F. 1995, Constraint-based
approach for automatic spatial layout planning,
Artificial Intelligence for Applications, 1995.
Proceedings., 11th Conference on, pp. 38.
Michalewicz, Z. & Fogel, D. B. 2000, How to solve it :
modern heuristics, Springer, Berlin; New York.
Pan, X., Han, C. S., Dauber, K. & Law, K. H. 2006,
Human and social behavior in computational modeling
and analysis of egress, Automation in Construction,
vol. 15, no. 4, pp. 448-461.
Smedresman, G. 2006, Crowd Simulations and
Evolutionary Algorithms in Floor Plan Design, Yale
University.
Yue, H., Hao, H., Chen, X. & Shao, C. 2007, Simulation
of pedestrian flow on square lattice based on cellular
automata model, Physica A: Statistical Mechanics and
its Applications, vol. 384, no. 2, pp. 567-588.
Zhu, N., Wang, J. & Shi, J. 2008, Application of
Pedestrian Simulation in Olympic Games, Journal of
Transportation Systems Engineering and Information
Technology, vol. 8, no. 6, pp. 85-90.
USING UNIFORM CROSSOVER TO REFINE SIMULATED ANNEALING SOLUTIONS FOR AUTOMATIC DESIGN
OF SPATIAL LAYOUTS
379
