
Modeling Sensor Knowledge of a National Hydrologic
Information System
Martin Molina and Javier Sanchez-Soriano
Department of Artificial Intelligence, Technical University of Madrid
Campus de Montegacedo S/N, 28660 Boadilla del Monte, Madrid, Spain
Abstract. In this paper we describe our experience in modeling and using sen-
sor knowledge of a national hydrologic information system in Spain. We devel-
oped a web application called VSAIH supported by a knowledge-based system
to analyze sensor data and to generate explanations that help users to make de-
cisions based on hydrologic behavior. In the paper, we describe the characteris-
tics of the infrastructure of hydrologic sensors and the representation we used to
model sensor knowledge to provide support to the VSAIH application. We also
describe
semi-automatic procedures that we applied to construct the final
model.
1 Introduction
SAIH is an information system based on an infrastructure of sensor devices and tele-
communications networks in the main river basins of Spain (SAIH is the Spanish
acronym for Automatic System Information in Hydrology). The main goal of the
SAIH system is to help to know in real time the state of the rivers. Currently, the most
important basins in Spain (Ebro, Tajo, Júcar, etc.) have installed this infrastructure
fully operational.
The SAIH information system is a good example of a system that includes a geo-
graphically distributed sensor network that records valuable data for different types of
goals (natural disasters, climate change, water management, energy production, etc.)
and actors (local governments, scientists, etc.). The current initiatives about sensor
web for globally distributed data acquisition [2] and semantic sensor web [9] may
provide solutions to improve the capabilities of sharing and analyzing sensor data as
well as potential interoperability between systems. This is especially important in the
hydrologic domain where there is specialized knowledge about the diverse physical
phenomena that is distributed among different local institutions.
In this paper we present our experience in modeling and using sensor knowledge
for the case of the SAIH information system. We developed the VSAIH application
that interprets and analyzes sensor data to provide explanations to help to make deci-
sions to different types of user. In the paper, we describe the SAIH Information Sys-
tem with the different types of sensors. We describe the VSAIH application that in-
terprets and explains sensor data according to different communicative goals. We also
describe the representation we used to model sensor knowledge and the semi-
automatic procedures that we applied to construct the model.
Molina M. and Sanchez-Soriano J..
Modeling Sensor Knowledge of a National Hydrologic Information System.
DOI: 10.5220/0003114500230031
In Proceedings of the International Workshop on Semantic Sensor Web (SSW-2010), pages 23-31
ISBN: 978-989-8425-33-1
Copyright
c
2010 SCITEPRESS (Science and Technology Publications, Lda.)
2 The SAIH Information System
The SAIH National Program (Spanish acronym for Automatic System Information in
Hydrology) was initiated in Spain at the end of the eighties [3]. The goal of this pro-
gram was to install sensor devices and telecommunications networks in the main river
basins to get on real time in control centers hydrologic information about the state of
the rivers. Currently, the most important basins in Spain (Ebro, Tajo, Júcar, etc.) in-
clude this infrastructure.
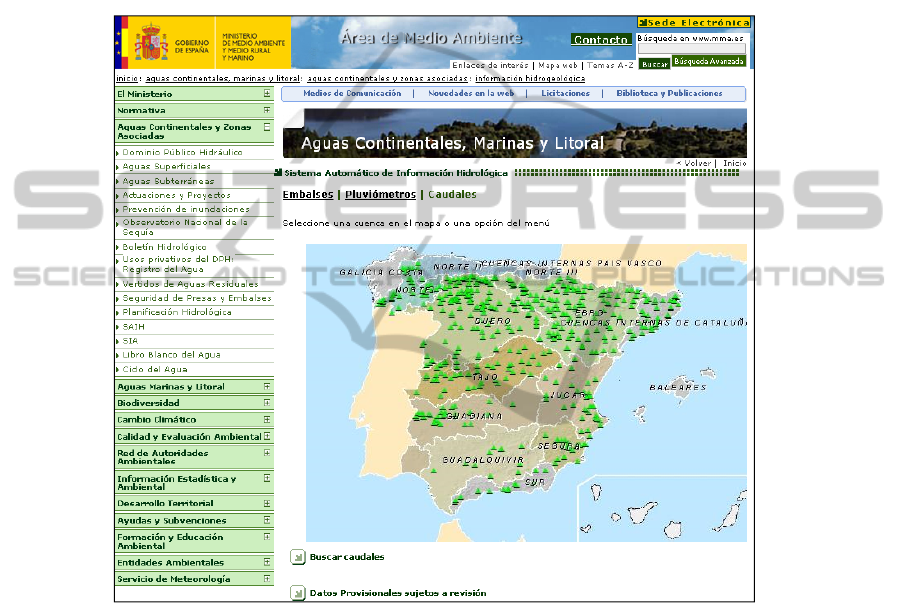
Fig. 1. Web application provided by the Spanish Ministry of Environment about hydrologic
data from the SAIH system at national level. This screen shows the geographical locations in
Spain where a user can consult real time data about water flows in rivers.
The SAIH system includes different types of sensors such as pluviometers that
record information such as rainfall at certain locations, sensors for water levels, and
sensors for flow discharge in reservoirs and flows in certain river channels. There are
nine SAIH control centers in Spain, one for each main basin (Ebro, Tajo, Júcar, Segu-
ra, etc.). Using the SAIH system, information is recorded periodically and sent to the
control centers (e.g, every hour, 30 minutes or 15 minutes).
Control centers process and store the data in local databases. In addition, the Min-
istry of Environment of Spain coordinates and integrates recorded data the informa
24
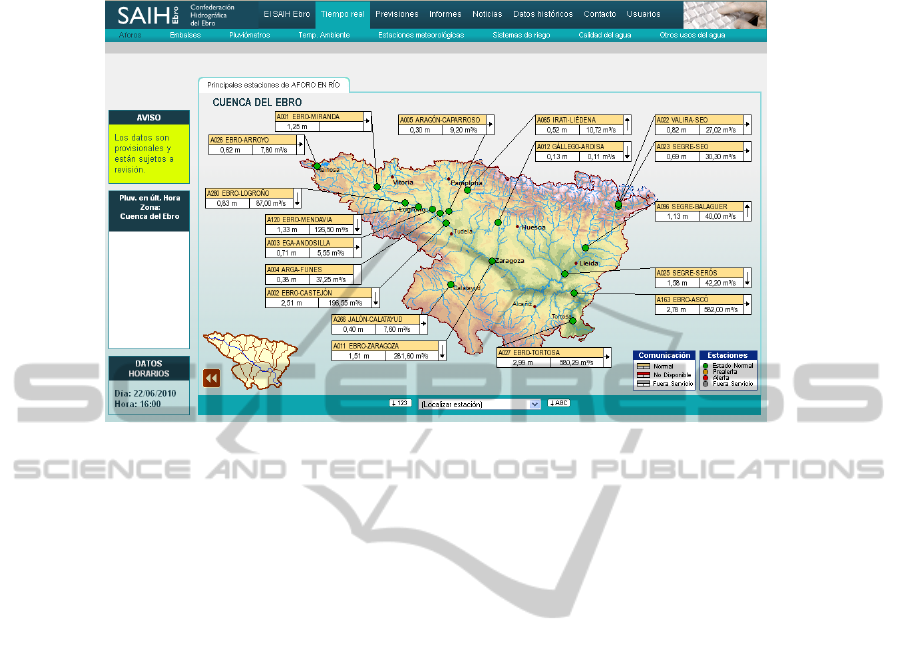
Fig. 2. Web application provided by the Ebro basin (Confederación Hidrográfica del Ebro)
about hydrologic data from the SAIH system. This screen shows the geographical locations in
the Ebro basin where a user can consult real time data about water flows and water levels in
rivers.
tion in a global database. Part of this information is accessible through web applica-
tions (see figures 1 and 2).
Figure 3 summarizes the number of sensors installed in different river basins. The
characteristics of the sensors are the following:
• Pluviometer (P): It is a device responsible for measuring the precipitation of rain
at the point of the basin in which it is located. The units are millimeters per hour.
These are the majority of SAIH sensors and represent nearly 55% of the total set
of sensors.
• Flow sensor (Q): A flow station is a device located on the riverbed to measure
its flow. It is measured in cubic meters per second.
• Level station (N, C): A level station is a device located at a reservoir or a river. A
level sensor measures the water level of the river or the dam on which it is lo-
cated. It is measured in meters with respect to sea level.
• Volume station (Y): A volume station is located at the dam of a reservoir to
measure the volume of water stored in it. For practical reasons, this is considered
as a sensor but actually it is deduced locally from the level of the reservoir. It is
measured in hectometers.
In many cases, sensors of different types share location and communications as
well as other functions (water and air quality, etc). Reservoirs usually have pluviome-
ters and level sensor beside others. Riverbeds usually have pluviometers together with
flow sensor or level sensor. The SAIH infrastructure also includes specific telecom-
munication devices (radio emitter-receiver systems, optical fiber networks, etc.) that
establish the communication between the sensors and the control center of the basin.
25

Basin
Sensor type
Total
P Q Y N C
Ebro Basin 247 148 60 60 0 515
Tajo Basin 191 57 45 48 44 385
Guadalquivir Basin 126 11 62 62 0 261
Guadiana Basin 183 33 12 20 0 248
Júcar Basin 124 38 23 23 0 208
Norte Basin 81 45 21 21 0 168
Sur Basin 99 0 12 12 15 138
Segura Basin 64 27 15 15 0 121
Cataluña Basin 56 40 12 12 0 120
Total 1171 399 262 273 59 2164
Fig. 3. Summary of available sensors in the SAIH system.
3 The VSAIH Application
VSAIH is a web application supported by a knowledge-based system [7] for generat-
ing multimedia descriptions that summarize the behavior of hydrologic networks
controlled by the SAIH system. We developed this system to help users that need to
interpret and analyze the behavior of rivers and make decisions according to prefixed
management goals. Our system generates presentations using different modes such as
text in natural language (as it is done by other data-to-text systems [8][11][4]) and,
also, dynamic illustrations (for example, animations, interactive geographic maps and
2D graphics).
VSAIH uses a system model with a representation of the hydrologic system based
on components and causal influences. VSAIH includes an abstraction generator that
uses the system model to find relevant data and condense it at an appropriate level of
abstraction. In addition, VSAIH includes a hierarchical planner to generate a presenta-
tion using a presentation model with discourse patterns as it is done by other multi-
media presentation systems
[1][5][10].
We developed for VSAIH a common system model that includes sensor know-
ledge. In addition, we developed three other presentation models according to three
different management goals: flood risk, water management, and sensor validation. For
example, the flood risk management goal is to avoid river floods. In this case, control
actions are oriented to operate reservoirs to avoid problems produced by floods and, if
problems cannot be avoided, to send information to public institutions in order to plan
defensive actions. For this goal, the summaries report relevant information of the river
basin from the point of view of potential or existing floods. In the following sections,
we describe more details about how we represented sensor knowledge for the VSAIH
application.
26
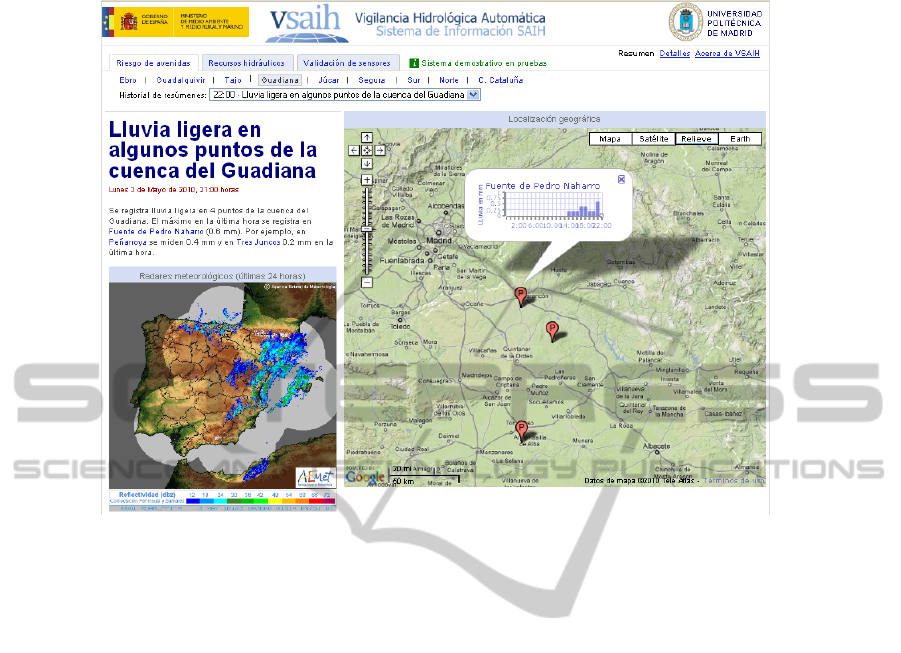
Fig. 4. Example of window presented by the VSAIH application.
4 Sensor Knowledge Representation
In order to represent sensor knowledge for the VSAIH application, we use a know-
ledge representation following a component-based approach. We use a formalization
based on many-sorted first order logic [6].
We use the following basic sorts: component represents a physical object of the
system (for example, a reservoir or a river), quantity is a quantitative property of a
component (e.g., the temperature or the pressure), and sensor is a device used to
measure observable quantities of components. More specific components can be re-
lated to more general components (with the is-a relation) by defining subsorts of the
sort component with the notation sort s: t (where s is subsort of t). For example, sort
reservoir: component defines the subsort reservoir of the sort component.
To characterize qualitative properties of the components we use the following
sorts: state represents the qualitative state of a component in the present moment (for
example, the state of a reservoir is empty), recent_state, represents the state of a com-
ponent in a recent time interval (e.g., the last 24 hours) and it is usually described in a
more abstract level than the state, trend, represents the trend of a state (for example,
with the set of values {increase, steady, decrease}) and quantification is a sort that
quantifies states for a given population (for example, with the set of values {all,
many, few}).
27

Predicate Description
part-of(x, y)
Component x is part of component y.
measure(x, y, z)
Sensor x measures the quantity y of component z.
cause(x, y, z, u, t)
Quantity x of component y is cause of quantity z of component u
with a delay t .
measurement(x, y)
Sensor x measures time series y.
value(x, y, t, v)
Quantity x of a single component y with t_scope t has the value v.
value(x, y, t, z, v)
Quantity x of a complex component y with t_scope t and c_scope z
has the value v.
state(x, y)
The state of component x is y.
recent_state(x, y)
The recent state of component x is y.
trend(x, y)
The trend of the state of component x is y.
quantification(x, y)
The quantification of the state of component x is y.
state_category(x,y,z)
The state z is a category of the state y of component x.
Fig. 5. Examples of predicates to represent knowledge about the dynamic system.
In order cope with different levels of abstraction, our representation also includes
the scope of certain affirmations. For this purpose, we use the concept of relative
scope to a specific domain. We use two sorts: t_scope which defines a temporal scope
and c_scope which defines the scope in a set of subcomponents that are part of a giv-
en component. For example, a possible value for temporal scope is max(n) that means
the maximum value for the last n hours.
Figure 5 shows a list of predicates to represent knowledge about the dynamic sys-
tem. For example, to represent structural relations we use the predicate part-of(x:
component, y: component) for the part-of relation and measure(x: sensor, y: quantity,
z: component) to relate sensors and quantities of components. The predicate cause(x:
quantity, y: component, z: quantity, u: component, t: number) represents a direct
causal influence between two quantities. The relation includes a temporal delay be-
tween the cause and effect.
To represent the value of a particular quantity we use the predicate value(x: quan-
tity, y: component, t: t_scope, v: value) for the case of a single component. This pre-
dicate defines the value for the quantity of a component with a particular temporal
scope. For example, value(temperature, tank-T3, current, 120) represents that the
current temperature of tank-T3 is 120 and value(volume, reservoir-R8, min(24), 18)
represents that the minimum volume of reservoir-R8 in the last 24 hours is 18. This
predicate also helps to represent historical information about behavior (e.g., average
values, maximum historical values, etc.). The predicate for the case of complex com-
ponents is value(x: quantity, y: component, t: t_scope, z: c_scope, v: value). It in-
cludes an additional argument for c_scope. For example, value(rain, Spain, current,
max, 27) represents that, at the present moment, the maximum rain in the set of points
(where rain is measured) that are part of Spain is 27.
To interpret the current state of a component we use the predicates state(x: com-
ponent, y: state), trend(x: component, y: state) and quantification(x: component, y:
quantification). For example the tuple <state(Spain, heavy-rain), trend(Spain, de-
crease), quantification(Spain, few)> represents that there is a decreasing heavy rain in
a few points of Spain. It is also possible to use the predicate recent_state(x: compo-
nent, y: state) for a recent time interval.
28

5 Model Development
The available information about SAIH sensors through the web application of the
Spanish Ministry of Environment includes basic information such as the identification
code, the sensor type (pluviometer, flow sensor, etc.) and the geographical location
(latitude, longitude in UTM format). However, in order to construct a model for the
VSAIH system, it is necessary to associate to sensors additional information that
currently is not present in this database. This includes, for example: geographical
administrations (provinces, regions, etc.), natural formations (rivers, lakes, etc.), his-
torical values (maximum value, average value, etc.), causal influences among sensors
due to downstream flow, standard names in natural language (the existing text de-
scriptions do not follow a standard approach), etc.
For this purpose, we applied a knowledge acquisition process supported by auto-
mated tools (developed in our own research group) using additional information
sources. Examples of these knowledge sources include (1) geographic information
such as raster files with digital elevation models and vector data files with rivers,
reservoirs, basins, dams, administrative limits (provinces, regions, etc.), (2) web ap-
plications with publicly available information, such as www.geonames.org that pro-
vides names for different locations and web pages with hydrologic information pro-
vided by local SAIH control centers.
Some of the automated procedures that we performed to build the model were the
following:
• Spatial Analysis. We used information provided by geographical data in raster
files and vector data files to create associations between model components. For
example, we used the geographic location of sensors to associate each sensor
(flow sensor or level sensor) to the corresponding river by using the vector data
files with multi-lines describing the shape of river channels. In addition, we es-
tablished causal relations, represented with the predicate cause(x, y), with spatial
analysis. We distinguished two different cases for causal relations: (1) causes as-
sociated to pluviometers, for each type of flow or level sensor we selected nearby
pluviometers using a prefixed maximum distance, (2) causes associated to river
channels, we analyzed geographic multi-lines of rivers and elevation models to
establish the causal relations based on a downstream influence of water flows and
water levels.
• Statistical Analysis of Historical Values. We consulted web pages and processed
databases to obtain historical values required for the model (average, maximum,
minimum, etc). These values are useful to select relevant values according to pre-
fixed goals.
• Text Processing for Sensor Names. We constructed for each sensor an appropri-
ate unique name in natural language. This task is essential to generate unders-
tandable text summaries. For this task, we used the complete information of the
sensor (for example, UTM coordinates, type of sensor, river, region, etc.) togeth-
er with a rule base (with conventions about names and certain heuristics) and the
web application www.geonames.org. For instance, we automatically constructed
the name [río Guadalquivir en Andújar] (river Guadalquivir at Andújar) for a
sensor that originally had the description [M10_GLQUVIR_AND].
29

As a result of this process, we developed a model that includes 14,337 elements
distributed in the following way: 1,864 values of sort sensor, 2,230 values of sort
component, 2,229 instances of predicate part_of(x, y), 1,864 instances of predicate
measure(x, y, z), 2,068 instances of value(x, y, t, v) (e.g., maximum value and average
value), 2,295 instances of cause(x, y, z, u, t) for pluviometers, 687 instances of
cause(x, y, z, u, t) for river channels.
The model was implemented in Prolog language. We evaluated the model with the
VSAIH application in continuous operation for more than one year with the help of
three experts in hydrology. The VSAIH application includes three other models (for
flood risk, water management and sensor validation) that share this common sensor
model. The current version generates summaries by processing every hour 44,736
numerical measures (for each sensor, a time series for the last 24 hours, a value per
hour).
6 Conclusions
In this paper we have described our experience in modeling and using sensor know-
ledge for the case of a national hydrologic information system. In the paper, we have
described how we developed sensor models for the VSAIH application that interprets
and analyzes sensor data to provide explanations to help to make decisions to differ-
ent types of users.
We applied a semi-automatic knowledge acquisition process to construct the mod-
el. In this process, we performed certain operations (spatial analysis, statistical analy-
sis and text processing) to capture and represent knowledge from different informa-
tion sources (geographical information systems, public web sites and specific data-
bases).
This domain is an example of a system that includes a geographically distributed
sensor network that records valuable data for different types of goals and users. Our
future work includes using techniques about data sharing and semantic web in this
domain. Standard semantic annotations for sensor knowledge (for example, historical
values, geographic information, causal influences and standards about names) can be
useful to help in the automatic creation and maintenance of models that use sensor
data for specific purposes. We expect that the semantic sensor web approach may
provide solutions to improve the capabilities of sharing knowledge between different
institutions and users interested in hydrologic information (e.g., scientists, local gov-
ernments, coordination groups, etc.).
Acknowledgements
This work was possible thanks to the support of the Ministry of Environment of Spain
(Dirección General del Agua, Ministerio de Medio Ambiente, Medio Rural y Mari-
no). The work was also partially supported by the Ministry of Science and Innovation
of Spain within the VIOMATICA project (TIN2008-05837/TIN).
30

References
1. E. André and T. Rist: “ The Design of Illustrated Documents as a Planning Task”. In M.
Maybury, editor, Intelligent Multimedia Interfaces, pp. 94–116. AAAI Press, 1993.
2. K. A. Delin and S. P. Jackson: “The Sensor Web: A New Instrument Concept”. Jet Propul-
sion Laboratory, California Institute of Technology, CA 91109-8099, 2001.
3. D.G.A. (Dirección General del Agua): “El programa S.A.I.H.: Descripción y funcionalidad.
El presente y el futuro del sistema”. Ministerio de Medio Ambiente y Medio Rural y
Marino (Spain). December, 2009. http://www.mma.es/portal/secciones/acm/
aguas_continent_zonas_asoc/saih/pdf/SAIH_WEB_MMA_V301109.pdf
4. J. Hunter, A. Gatt, F. Portet, E. Reiter, and S. Sripada: “Using natural language generation
technology to improve information flows in intensive care units”. In Proceedings of the 5th
Conference on Prestigious Applications of Intelligent Systems (2008).
5. K.R. McKeown and S.K. Feiner: “Interactive multimedia explanation for equipment main-
tenance and repair”. In Proc. DARPA Speech and Language Workshop (1990).
6. K. Meinke, J. V. Tucker: “Many-sorted Logic and Its Applications”. John Wiley & Sons,
Inc., Chichester, England, 1993.
7. M. Molina, V. Flores: “A Knowledge-based Approach for Automatic Generation of Sum-
maries of Behavior” In “Artificial Intelligence: Methodology, Systems, and Applications”,
J. Euzenat and J. Domingue (Eds.). 12th International Conference AIMSA 2006, Lecture
Notes in Artificial Intelligence, Springer Verlag, Bulgaria, 2006.
8. E. Reiter, S. Sripada, J. Hunter, J. Yu, and I. Davy: “Choosing words in computer-
generated weather forecasts”. Artificial Intelligence, vol. 67, no. 1-2 (2005) 137-169.
9. A. Sheth, C. Henson, S. Sahoo: “Semantic Sensor Web”. IEEE Internet Computing, vol.
12, no. 4, July/August 2008, p. 78-83.
10. W. Wahlster, E. André, W. Finkler, H.-J. Profitlich and T. Rist: “Plan-based integration of
natural language and graphics generation”. Artificial Intelligence 63 (1993) 387-427.
11. J. Yu, E. Reiter, J.R.W. Hunter and C. Mellish: “Choosing the content of textual summaries
of large time-series data sets,” Natural Language Engineering, vol. 13, no. 1, pp. 25-49,
2007.
31
