
Semantic High Level Querying in Sensor Networks
Ilaria Giordani
1
, Daniele Toscani
1
, Francesco Archetti
1,2
and Mauro Cislaghi
2
1
Consorzio Milano Ricerche, via Cozzi 53, 20125 Milan, Italy
2
University of Milano-Bicocca, Viale Sarca 336, 20125 Milan, Italy
Abstract. The quick development and deployment of sensor technology within
the general frame of the Internet of Things poses relevant opportunity and chal-
lenges. The sensor is not a pure data source, but an entity (Semantic Sensor
Web) with associated metadata and it is a building block of a “worldwide dis-
tributed” real time database, to be processed through real-time queries. Impor-
tant challenges are to achieve interoperability in connectivity and processing
capabilities (queries) and to apply “intelligence” and processing capabilities as
close as possible to the source of data. This paper presents the extension of a
general architecture for data integration in which we add capabilities for proc-
essing of complex queries and discuss how they can be adapted to, and used by,
an application in the Semantic Sensor Web, presenting a pilot study in envi-
ronment and health domains.
1 Background and Motivation
The rapid development and deployment of sensor technology involves many different
types of sensors, both remote and in situ, with such diverse capabilities as range,
modality, and manoeuvrability. It is possible today to utilize networks with multiple
sensors to detect and identify objects of interest up close or from a great distance.
Connected Objects – or the Internet of Things – is expected to be a significant new
market and encompass a large variety of technologies and services in different do-
mains. Transport, environmental management, health, agriculture, domestic appli-
ances, building automation, energy efficiency will benefit of real-time reality mining,
personal decision support capabilities provided by the growing information shadow
(i.e. data traces) of people, goods and objects supplied by the huge data available
from the emerging sensor Web [1].
Vertical applications can be developed to connect to and communicate with objects
tailored for specific sub domains, service enablement to face fragmented connectivity,
device standards, application information protocols etc. and device management.
Building extending connectivity, connectivity tailored for object communication –
with regards to business model, service level, billing etc, are possible exploitation
areas of the Internet Connected Objects. Important challenges are to achieve interop-
erability in connectivity and processing capabilities (queries, etc.), to distribute “intel-
ligence” and processing capabilities as close as possible to the source of data (the
Giordani I., Toscani D., Archetti F. and Cislaghi M..
Semantic High Level Querying in Sensor Networks.
DOI: 10.5220/0003116600720084
In Proceedings of the International Workshop on Semantic Sensor Web (SSW-2010), pages 72-84
ISBN: 978-989-8425-33-1
Copyright
c
2010 SCITEPRESS (Science and Technology Publications, Lda.)

sensor or mobile device), in order to avoid massive data flows and bottlenecks on the
connectivity side.
The sensor is not a pure data source, but an entity (Semantic Sensor Web) with as-
sociated domain metadata, capable of autonomous processing and it is a building
block of a “worldwide distributed” real time database, to be processed through real-
time queries.
The vision of the Semantic Sensor Web promises to unify the real and the virtual
world by integrating sensor technologies and Semantic Web technologies. Sensors
and their data will be formally described and annotated in order to facilitate the com-
mon integration, discovery and querying of information. Since this semantic informa-
tion ultimately needs to be communicated by the sensors themselves, one may wonder
whether existing techniques for processing, querying and modeling sensor data are
still applicable under this increased load of transmitted data.
In the following of this paper we introduce the state of the art in data querying over
network of data providers. In Sect. 2 we present the software architecture of a data
integration system in which we added complex query processing features. Sect. 3
introduces the case study in which we deployed our system: the study of short term
effect of air pollution on health. Sect. 4 presents the detailed implementation of the
querying features together with results on real data sets. Finally, Sect 5 presents the
conclusions and future work.
1.1 State of the Art
This paper stems from the work presented in [12], in which is presented a software
system aimed at forecasting the demand of patient admissions on health care struc-
tures due to environmental pollution. The target users of this decision sup-port tool
are health care managers and public administrators, which need help in resource allo-
cation and policies implementation. The key feature of that system was the algo-
rithmic kernel, to perform time series analysis through Autoregressive Hidden
Markov Models (AHMM) [7]. The scenario in which the system has been deployed is
the research project LENVIS
1
, which is aimed to create a network of services for data
and information sharing based on heterogeneous and distributed data sources and
modeling. One of the innovations brought by LENVIS is the “service oriented busi-
ness intelligence”, i.e. an approach to Business Intelligence in which the information
presented to the user comes from data processing that is performed online, i.e. data
are extracted under request of the applications, and on the basis of data availability,
i.e. data are exchanged through web services, which does not guarantee response time
neither availability.
Such a complex environment, in which data sources are distributed over the inter-
net, is common to several problems and has been faced by different approaches. One
of them is that of [13], in which “monitoring queries” continuously collect data about
spatially-related physical phenomena. An algorithm, called Adaptive Pocket Driven
Trajectories, is used to select data collection paths based on the spatial layout of sen-
1
LENVIS - Localised environmental and health information services for all. FP7-ICT-2007-2.
Project number 223925. www.lenvis.eu
73

sors nodes. This is not the case of our project, in which the geo-graphical location of
the data providers is unknown; however, this approach can be extended in order to
consider not only the geographical organization of sensors, but also any contextuali-
zation of thematic information in different spaces - be they conceptual or physical
(e.g. considering as generalized concept of space any type of organization deriving
from cooperation of data sources in an environmental monitoring network). The con-
cept of modelling generalized spaces, locations and mapping between locations be-
longing to different spaces is introduced in [2]; this model has been implemented in a
prototype system for space-aware communication [3] [4].
A different approach for continuous queries [11] is based on C-SPARQL, an ex-
tension of SPARQL, the standard language for querying Re-source Description
Framework (RDF) graphs. RDF graphs are data models, which in this case encode
metadata using the Semantic Sensor Web ontology (http://knoesis.wright.edu/
research/semsci/application_domain/sem_sensor/ont/sensor-observation.owl). C-
SPARQL adds to SPARQL the possibility to perform continuous queries over data
streams and supports simple forms of reasoning in terms of incremental view mainte-
nance. The main drawback of RDF is the performance: the representation of data
model based on XML requires executing inference and exploration of graphs; in case
of several queries executed in very short time, this overhead can greatly increase the
response time. The same problem in performance can affect systems based on ontol-
ogy reasoning; an example is SEMbySEM [5], an European research project with the
objective of creating a framework for the management of semantics in sensor net-
works. Sensor data are mapped in OWL ontologies and a rule based engine is applied
for reasoning.
The explicit management of sensors semantics is addressed also in [8], which pre-
sents a framework for query processing. Distributed end users can request streams of
interest with efficient energy management, based on the principle of pushing the
query down to the network nodes as much as possible, to maximize lifetime and util-
ity of the sensor network. Also in this case, the modelling of semantics is performed
through ontology. The object oriented meta-model that is at the basis of our architec-
ture allows explicit management of data types, taking benefits of the time and re-
source efficiency of Java objects manipulation (see Sect. 2).
LarKC [10] is an ongoing European research project with the objective of mixing
logic reasoning with information retrieval. The attempt to fuse data retrieval and
elaboration in sensor networks is not new; in [6], for instance, is presented FA, a
system where users and applications can pose declarative forecasting queries and
continuous queries to get forecasts in real-time along with accuracy estimates. A
feature that is missing in this system is the automatic discovery of the data sources,
which instead is addressed by systems based on ontologies, RDF and our meta-
model: in FA the user must state explicitly from which source the data should be
extracted; this is not always possible and easy in dynamically changing environment,
like our application case (Sect 3), in which sensors and services may not be always
available. Furthermore, the Analysis Layer of our architecture introduces at query
execution level the possibility to obtain data from analysis and forecast models; the
platform autonomously manages these models, without the need that the user explic-
itly deals with them.
74

2 System Architecture
The work presented in this paper is based on the architecture for data integration
already developed for querying environmental and health data [12]. Data providers in
the scenario in which our software is deployed are distributed over the web: in order
to meet the requirements of data accessibility and increase the availability of informa-
tion we extended the basic components of the software architecture by implementing
in the Analysis Layer a set of complex queries for time series analysis. As described
in Sect. 4, we applied these queries to extract indicators of critical situations in envi-
ronmental monitoring.
The system architecture which we are developing has been designed to be used as
basic infrastructure by other applications, like for instance Business Intelligence tools,
to retrieve heterogeneous data of different nature and data series, like sensor meas-
urements (e.g. environmental samples of different quantities), non-sequential (more
“DB-like”) data; e.g. people lists, clinical records, etc. The idea is to access uniformly
heterogeneous data sources (the containers of such data), integrating them logically
without modifying their content or structure.
The data types that are manipulated correspond to domain entities, which are spe-
cific for each application. An example of data is “PM10”, which represent a sensor
measurement of concentration of particulate matter; each type has a set of properties
(i.e. attributes); for instance PM10 has a date and a concentration value. This is
strongly different for a simple representation of sensor measurements as numeric
values: it is not possible, for instance, to execute mathematical operation on values of
types that are not compatible following the application specific model defined by the
programmer. The requests of data items are performed by queries with SQL-like
expressivity. Specific wrappers for each type of data source (e.g. DB, text file, soft-
ware interface, ...) are configured to access the data.
The system architecture is implemented in Java SE 6; it is deployed on a central-
ized server, connected over the Internet to data providers, and it composed by four
layers: 1) Data; 2) Integration; 3) Analysis and 4) Application layers (Fig. 1).
By Data Layer we identify the set of supported data sources: relational databases
and structured text files, which store mostly static data, and web services, through
which flow the data from sensors and services connected through the web.
The Integration Layer is kernel of our system; it provides the facilities to process
queries extract the data and compose them to produce outputs. A key feature is the
meta-model, which allows referring explicitly to the types of data in selection criteria
and configuration of wrappers. Our meta-model is an object-oriented representation
of domain entities, which is implemented in the DAC (Data Access Component). The
querying mechanism defined by the DAC is an object oriented representation of
query types and their elements, including constraints, expressions and operators. The
main components of the DAC are: Query Processor, Data Aggregator and Wrapper.
The Query Processor analyzes queries formulated by the user and processes them to
produce the results. The Data aggregator merges the output of the different wrappers
involved in the query evaluation, joining types when required. A Wrapper is a gen-
eral component that links the Query Processor with a data source (DB, web service,
text file…).
75
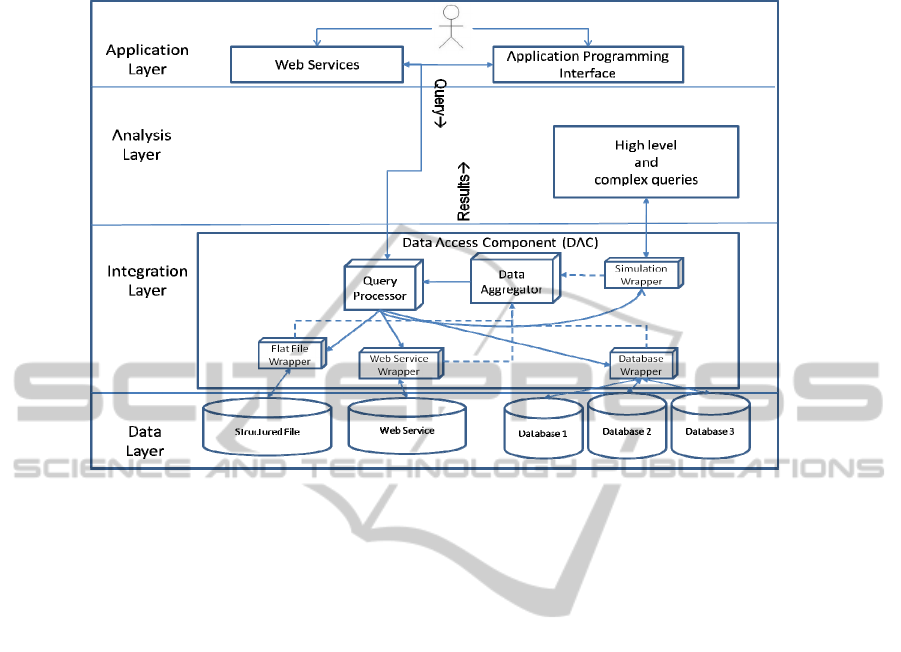
Fig. 1. System architecture.
In the Analysis Layer is implemented a set of built in queries (see Sect. 5), which
combine the query operators of the DAC and computational components. These que-
ries are not possible to perform through the standard querying mechanisms like SQL,
since they involve data processing, for instance forecast produced by machine learn-
ing algorithms. One of the greatest innovations of our work is that each component in
the Analysis Layer is connected to a Wrapper as a data source; it can then reply to
queries and the data that it produces are part of the query output together with histori-
cal and streaming data from sensors.
In the Application Layer are defined web services and the Java API (Application
Programming Interfaces) for the interaction with external applications and users’
interfaces. These two technologies have been chosen in order to offer the widest,
platform-independent support to the integration of our system. The possibility to
formulate queries as object-oriented system calls and the features offered by our
framework, in particular the masking of the data sources and automatic discovery of
the data providers, make it easy to develop data analysis, visualization and business
intelligence applications. Furthermore a set of pre-defined complex queries, some of
which are presented in Sect. 4, is still under development to offer a continuously
increasing library of embedded data analysis components, to be used by external
applications. The data produced as output are presented by the framework as objects
in the types defined by the user, with fields and attributes that can be configured for
any specific application, delegating to the framework the responsibility to convert the
data from the original formats in the sources.
76

3 The Case Study
The aim of this paper is to show how our system can simplify the access to informa-
tion in network of distributed data sources. The LENVIS project is a test bed with a
specific application: the querying of air pollution data and health indicators. As envi-
ronmental data we consider the concentrations of air pollutants in the city of Milan.
The network of air pollution monitoring has 9 stations, each of which is equipped
with a variable number of sensors, for a total of 37 sensors in the whole network.
Each sensor measures the concentration (in µg/m
3
) of one among: benzene, nitrogen
dioxide, sulphur dioxide, carbon monoxide, nitrogen oxide, total nitrogen oxide,
ozone, PM10 (Particulate Matter), PM2.5, TSP (Total Suspended Particulate). The
station calculates every hour the mean of pollutant concentration and sends it to a
control centre, where the data are manually validated to filter outliers and further
aggregated to obtain a daily measure.
The health indicators that we collected are the daily number of hospitalizations in
the town of Milan for respiratory and cardio-vascular diseases, whose acute occur-
rence can be related to air pollution. The number of hospitalizations for each pathol-
ogy are collected by the local government of the Lombardy region and stored in a
database.
4 High Level and Complex Queries
In this section we present the queries implemented for the case study introduced in
Sect. 3 and the results of their execution. As introduced in Sect. 2, the querying
mechanism defines an object-oriented abstraction of the types of objects and the con-
straints on which to perform selections; this requires that before the execution of all
the queries we define types (in our case pollutant and admission) and their properties.
In the box below, we define two properties for each type: date represents the time-
stamp in which the pollutant concentration or the admission has been recorded; value
is the numeric value of the pollutant concentration or, respectively, the number of
hospital admissions.
//Definition of the new set of 2 properties for pollutant type: date and
value (pollutant concentration)
Property()pollutant_p = new Property(2);
pollutant_p (0) = new Property(“date”,SimpleType.DATE);
pollutant_p (1) = new Property("value",SimpleType.DOUBLE);
//Creation of the new data type: pollutant with the properties pollutant_p
createType(“pollutant”, pollutant_p);
//Definition of the new set of 2 properties for admission type: date and
value (number of admission)
Property()admission_p = new Property(2);
admission_p (0) = new Property(“date”,SimpleType.DATE);
admission_p (1) = new Property("value",SimpleType.INT);
//Creation of the new data type: admission, with the properties admission_p
createType(“admission”, admission_p);
As a general approach, in our system a query is defined with three steps: 1) defini-
tion of symbolic expressions, which create a reference to the attribute of a property; 2)
77

definition of selection expressions, which complete symbolic expressions by adding a
compound expression, which defines operations and constants; 3) definition of the
query that combines all the selection expressions previously defined.
4.1 Query 1
The objective of Query 1 is, given a time period (e.g. a year, a month or a week), to
find the number of days in which the pollution concentration exceeds a critical
threshold. This is useful since risk thresholds are defined by the law and local admini-
strations, for instance, need to have warnings to know when pollution reduction poli-
cies have to be actuated.
Query structure
: The query structure follows the three steps described above.
First, the symbolic expressions poll_date and poll_val create respectively a reference
to the properties date and value of the pollutant of interest. In the second step it is
defined the selection criteria, called poll_Over_Thr, through a CompoundExpression
that extracts all the pollutant concentration values above the defined threshold. Since
the user might be interested only to a particular time period, a CompoundExpression
is defined to apply the Poll_Over_Thr selection criteria with the dataRangeCriterion.
Finally, the query q1 combines all the criteria previously defined to select the pollut-
ant concentration values over the threshold in the time period. The number of days in
which threshold is exceeded (dayOverThr) is given by the count of elements in the
result set obtained after query execution.
Expression poll_date = new Symbolic(pollutant.getPropertyByName ("date"));
Expression poll_val = new Symbolic(pollutant.getPropertyByName ("value"));
DataObject pollThrObj = t_double.createDataObject();
pollThrObj.setDouble(threshold);
Expression poll_over_thr = new CompoundExpression(GTE,poll_val,new Con-
stant(pollThrObj));
Expression dateFrom = new CompoundExpression(CmpOperator.GREATER_EQUAL,
poll_date,new Constant(dateF));
Expression dateTo = new CompoundExpression(CmpOperator.LESS, poll_date,new
Constant(dateT));
Expression dateRange = new CompoundExpression(AND,dateFrom,dateTo);
Expression dateRangeCriterion = new CompoundExpression(AND,dateFrom,
dateTo);
Expression compoundCriterion = new CompoundExpression(AND,poll_over_thres,
dateRangeCriterion);
Query q1 = new SelectQuery(”pollutant”, compoundCriterion);
int dayOverThr = count(q1.getResults());
Results: The query is executed with the following parameters: as pollutant we
chose the Particulate Matter with a diameter less than 10 microns (PM10) and as
temporal period we select the data in the month of February in all the years, from
1998 to 2008. The PM10 threshold is 50 µg/m
3
.
The query identifies that the threshold has been exceeded in 211 days. A represen-
tation of the results is depicted in Fig. 2. Here, for each day of the month under study,
a different colour represents the different concentration of pollutant PM10: darker
78
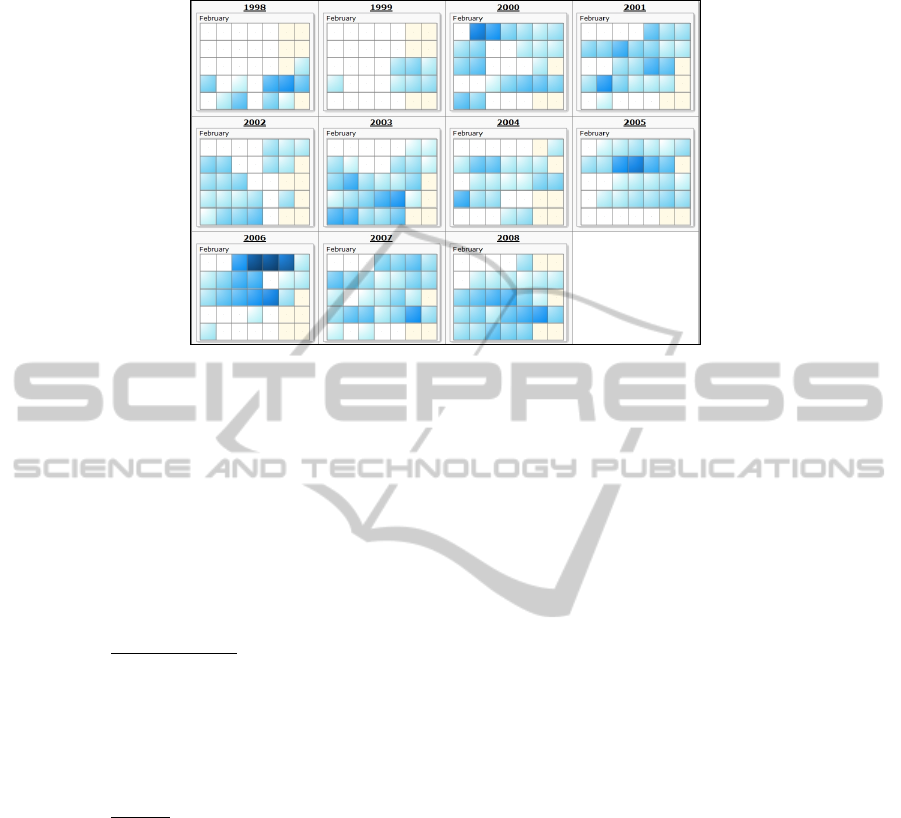
Fig. 2. Query 1 results.
cells correspond to days with higher pollution. Analyzing the results, we see immedi-
ately that the month with higher pollutant concentration is February 2006.
4.2 Query 2
The problem addressed by Query 2 is to know the variations of pollution concentra-
tions during the weekends (Saturday and Sunday) by comparing the results in differ-
ent months or different years. Query q2 extracts the number of Saturdays and Sun-
days in which the pollution concentration exceeds a specific threshold.
Query structure
: The structure of q2 is similar to q1. Also in this case we must de-
fine, through a symbolic expression, a reference to the date and value property of the
pollutant of interest and then select all the episodes of pollutant concentration over
the threshold during the time period of interest. Unlike the first query, here we intro-
duce the selection of the weekend days by applying a post-processing phase in which,
through the Java GregorianCalendar methods, we select only the Saturdays and
Sundays in the time period under study.
Results
: The pollutant selected is PM10 and as a time period we chose the years
from 1998 to 2008. The threshold defined is 50 µg/m
3
.
The number of Saturdays and Sundays over PM10 threshold returned by the query
is 380. In Fig. 3 are depicted the results of the query q2 with a calendar view. In the
figure is visualized only the year 2007. A peculiarity that is clearly visible from the
image is that in December and January there are high pollutants concentrations during
the weekends, probably due to general climatic conditions and higher vehicular traf-
fic.
79
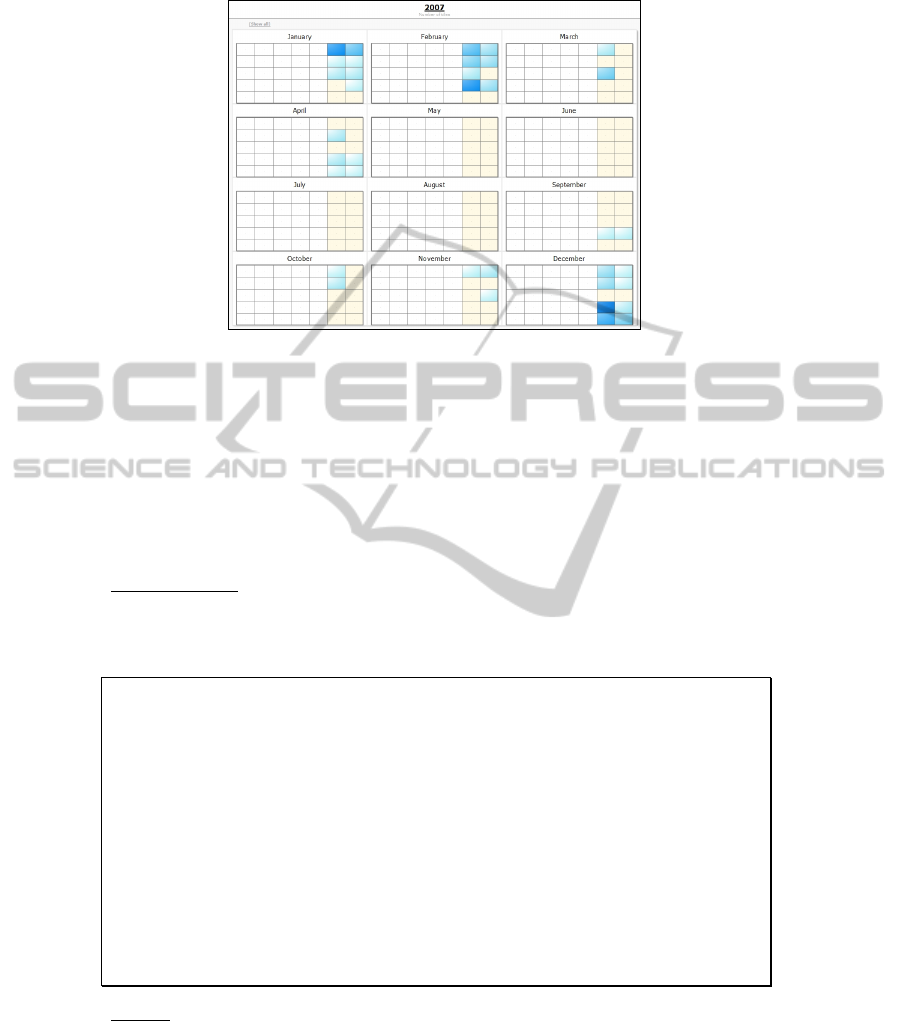
Fig. 3. Query 2 results.
4.3 Query 3
Both queries q1 and q2 have been executed on data collected by single sensors. In the
next queries we want to elaborate data recorded by different sensors located in the
network of air pollution monitoring stations. In this case the objective is the extrac-
tion of the number of days in which the pollution concentration exceeds the threshold
(different for each pollutant) in four different sensors.
Query structure
: The structure of this query is simpler than the previous ones. In
fact, as visible in the box below, we must merge the results (q3_s1, q3_s2, q3_s3 and
q3_s4 as reported in the pseudo-code) obtained with each simple query applied to
each sensor.
//Definition of references to pollutant concentration attribute of each
sensor
Expression symbRefSens_1_Value = new Symbolic(sens1.getPropertyByName
("value"));
DataObject sens1ThrObj = t_double.createDataObject();
sens1ThrObj.setDouble(threshold_s1);
Expression sensor1_over_thr = new CompoundExpres-
sion(GT,symbRefSens_1_Value, new Constant(sens1ThrObj));
//similar selection criteria for sensors 2, 3 and 4
........
Query q3_s1 = new SelectQuery(”pollutant”, sens1_over_thr);
Query q3_s2 = new SelectQuery(”pollutant”, sens2_over_thr);
Query q3_s3 = new SelectQuery(”pollutant”, sens3_over_thr);
Query q3_s4 = new SelectQuery(”pollutant”, sens4_over_thr);
List results = union
(q3_s1.getResults(),q3_s2.getResults(),q3_s3.getResults(),q3_s4.getResults(
));
Results: We use data recorded by two monitoring stations (called respectively Ju-
vara and Pascal) situated in Milan. For each station we have two kinds of sensors:
PM10 and the Sulphur dioxide (SO
2
). The pollutant concentration thresholds are 50
µg/m
3
for PM10 and 150 µg/m
3
for SO
2
.
80

Table 1. Query 3 results.
Sensor Name Number of Days over the
threshold
PM10_Juvara 1309
PM10_Pascal 172
SO2_Juvara 2
SO2_Pascal 0
Query results are reported in Table 1. The sensors for PM10 registered the higher
number of days over threshold in all the period under study. This confirms what has
been found by scientific studies: that the number of days over threshold for SO
2
de-
creased significantly over the years compared to PM10 [9].
4.4 Query 4
The fourth query is similar to q3; the only difference is that q4 extracts the number of
days in which the pollution concentration exceeds the threshold at the same time in
three different sensors.
Query structure
: This query is a combination of the previous ones. In fact, after the
definition of a reference to each sensor pollutant concentration attribute and after the
selection of all the measurements over the threshold thr, the query combines with the
logical operator and the obtained results.
//Definition of references to pollutant concentration attribute of each
sensor (sensor1, sensor2, sensor3)
Expression symbRefsens1 = new Symbolic(sensor1.getPropertyByName("value"));
Expression symbRefsens2 = new Symbolic(sensor2.getPropertyByName("value"));
Expression symbRefsens3 = new Symbolic(sensor3.getPropertyByName("value"));
DataObject sensorThrObj = t_double.createDataObject();
sensorThrObj.setDouble(thr);
Expression sens1OverThr = new CompoundExpression(GT,symbRefsens1,new Con-
stant( sensorThrObj));
Expression sens2OverThr = new CompoundExpression(GT,symbRefsens2,new Con-
stant( sensorThrObj));
Expression sens3OverThr = new CompoundExpression(GT,symbRefsens3,new Con-
stant( sensorThrObj));
Expression pollOverThr1 = new CompoundExpression(AND,sens1OverThr,
sens2OverThr);
Expression pollOverThrTotal = new CompoundExpression(AND,pollOverThr1,
sens3OverThr);
Query q_4 = new SelectQuery(”pollutant”, pollOverThrTotal);
Results: The query is applied on the network of PM10 sensors and in particular,
the three sensors under study are Verziere, Juvara and Pascal. The query returns only
three days in which the sensors exceed the threshold at the same time. The pollutant
concentration values of these days are visible in
Table 2.
4.5 Query 5
The last query that we propose is the more complex. The objective is to know the
average lag between the local maxima of pollutant concentration and the local
81

Table 2. Query 4 results.
Date PM10_Verziere
(µg/m
3
)
PM10_Juvara
(µg/m
3
)
PM10_Pascal
(µg/m
3
)
21/04/2007 71.0 61.0 80.0
22/05/2007 62.0 55.0 72.0
23/06/2007 71.0 60.0 76.0
maxima of hospital admission in a time period chosen by the user. This query repre-
sents the typical analysis that is applied to discover short-term variations on air pol-
lutant data, to find how pollutant concentration and hospital admissions are corre-
lated.
Query structure:
This query is a three stages query, where the second and third
stages are post processing steps. In the first step, through q5_p and q5_a, are ex-
tracted all the measurements for both pollutants and admissions in the period of inter-
est. The extraction is made using a query similar to q1, with the only difference that
here we take out a time series of all measurements. The pseudo-code is reported in the
box below.
Expression poll_date = new Symbolic(pollutant.getPropertyByName ("date"));
Expression poll_val = new Symbolic(pollutant.getPropertyByName ("value"));
Expression adm_date = new Symbolic(admission.getPropertyByName ("date"));
Expression adm_val = new Symbolic(admission.getPropertyByName ("value"));
Expression dateFrom_p=new CompoundExpression(CmpOperator.GREATER_EQUAL,
poll_date,new Constant(dateF));
Expression dateTo_p = new CompoundExpression(CmpOperator.LESS,
poll_date,new Constant(dateT));
Expression dateRange_p = new CompoundExpression(AND,dateFrom_p, dateTo_p);
Expression dateRangeCrit_p = new CompoundExpression(AND,poll_val, dater-
Range_p);
//similar selection criteria for admissions
.....
Query q5_p = new SelectQuery(“pollutant”, dateRangeCrit_p);
Query q5_a = new SelectQuery(“admission”, dateRangeCrit_a);
//find local maxima
List localMax_p = findLocalMaxima (q5_p.getResults());
List localMax_a = findLocalMaxima (q5_a.getResults());
//compute average lag
Double avgLag = computeAvgLag(localMax_p, localMax_a);
The second step (method findLocalMaxima) is focalized on the analysis of each
time series obtained in the previous step with the subsequent individuation of local
maxima, generally defined as the maximal value in some segment of the series. In this
way a local maximum is found by comparing each point in the time series with the
previous and the next one: if in a given point the value is greater than the previous
and the next, this point is defined as a local maximum. Local maximum extraction is
applied on both pollutant concentration and hospital admission time series.
Finally, in the third step (method computeAvgLag), is computed the average lag
between each local maximum of pollutant concentration series and the correspondent
local maximum of hospital admissions.
Results
: The query described above is applied on data recorded in the months of
February and March. We analyze jointly PM10 and admissions for respiratory dis-
eases, which are the health problems major related to particulate since, because of the
size of the particle, it can penetrate the deepest part of the lungs.
Larger particles are
82

Table 3. Query 5 results.
Max Admission Max pollutant Number of
days
Thu Apr 09 1998 Fri Apr 03 1998 6
Mon Apr 13 1998 Wed Apr 08 1998 5
Thu Apr 16 1998 Wed Apr 15 1998 1
Tue Apr 21 1998 Fri Apr 17 1998 4
Thu Apr 23 1998 Wed Apr 22 1998 1
generally filtered in the nose and throat and do not cause problems, but particulate
matter smaller than about 10 micrometers (PM
10
) can settle in the bronchi and lungs
and cause health problems.
Analyzing, for example, the month of April 1998, it’s possible to obtain the results
reported in Table 3. The average lag between max pollutant and hospital admission
for respiratory diseases is 3.4 days
5 Conclusions and Future Work
The data integration and querying system with reasoning capabilities presented in this
paper represents a further step in integrated processing of heterogeneous data sources
without the need to replicate heavy and costly databases or data warehouses. It makes
ETL dynamic, more suitable for analysing real-time data streams such as the ones
coming from sensor networks, enriched with semantic information, jointly with data
coming from more static databases.
Our query engine provides integration from heterogeneous data sources and does
not need any database duplication. This feature makes it particularly efficient in ana-
lysing real-time data from sensors and down-scalable to a micro-engine suitable to be
directly embedded into the sensor network themselves. In perspective the sensor
network can become not only a data source, but also a data consumer, capable to run
autonomous services by collecting the needed information elsewhere on the web.
“Smart cities”, urban computing, the environmental footprint of urban develop-
ment, emergencies, precision agriculture are potential target domains.
Ongoing activities include further development of the architecture, including fur-
ther data processing capabilities, and the study of configurable situation-aware agents
(or query micro-engines) to be deployed in sensor networks, with the objective to
enhance local processing and to reduce significantly the related communication over-
load, the reaction time and the power consumption. In order to better support the ease
of query formulation, a future improvement will include the implementation of a high
level querying language, which will allow to describe queries XML (through
XSTREAM, http://xstream.codehaus.org/) or semi structured natural language, possi-
bly integrating parsing libraries like JFLEX (an extension of JLEX, http://jflex.de) or
CUP (http://www.cs.princeton.edu/~appel/modern/java/CUP/).
Upcoming research activities in 7th Framework Program by the European Com-
mission will target the distribution of intelligence, data wrapping and processing
capabilities as close as possible to the source of data, in particular in sensor networks
and mobile devices in an interoperable frame. Our work, with its capabilities to query
83

data sources and web services, will be implemented having as key property its scal-
ability, in order to meet the requirements and challenges posed by the growing theme
of Internet Connected Objects.
References
1. Accenture, Information 2015: Reforming the paradigm, (2010)
2. Bernini, D., Micucci, D., Tisato, F.: A Space-Based Interoperability Model. In: Int. Work-
shop on Ontology, Conceptualization and Epistemology for Information Systems, Software
Engineering and Service Science (ONTOSE 2010) - In conjunction with 22nd Int. Conf.
On Advanced Information Systems Engineering (CAiSE'10) - June 7-11, Hammamet, Tu-
nisia, (2010).
3. Bernini, D., Micucci, D., Tisato, F.: Space Integration Services: a platform for space-aware
communication. In: Int. Workshop on Emergency Management: Communication and Com-
puting Platforms) - In conjunction with IWCMC 2010 - 6th International Wireless Com-
munications & Mobile Computing Conference (IWCMC 2010), Caen, France, (2010).
4. Bernini, D., Micucci, D., Tisato, F.: A Platform for Interoperability via Multiple Spatial
Views in Open Smart Spaces, In: First Int. Workshop on Semantic Interoperability for
Smart Spaces (SISS 2010) - In conjunction with IEEESymposium on Computers and
Communications (ISCC'10), Riccione, Italy, (2010).
5. Brunner, J.S., Goudou, J.-F., Gatellier, P., Beck, J., Laporte, C. E.: SEMbySEM: a frame-
work for sensor management. In: Proc. of the 1st Int. Workshop on the Semantic Sensor
Web (SemSensWeb) , collocated with ESWC, (2009).
6. Duan, S. and Babu, S.: Processing forecasting queries. In: VLDB '07: Proceedings of the
33rd international conference on Very large data bases, (2007), 711-722.
7. Messina, E., Toscani, D.:Hidden Markov Models for Scenario Generation. IMA Journal of
Management Mathematics, Vol. 19 (4), pp. 379–401. October 2008
8. Li, L., Taylor, K.: A Framework for Semantic Sensor Network Services. Lecture Notes In
Computer Science; Vol.5364 Proceedings of the 6th International Conference on Service-
Oriented Computing table of contents, Sydney, Australia, (2008), 347 – 361.
9. Mitis F, Iavarone I, Martuzzi M. Health impact of ozone in 13 Italian cities, Epidemiol
Prev., Vol. 31, 323-32, (2007).
10. Simperl, E., Keller, U., Fischer, F., Oren, E., Bishop, B., Huang, Z., Tagni, G., Quesada, J.,
Fortuna, B., Hu, J., Qin, Y.: Deliverable D1.1.1 An Overview of Relevant Work in Other
Areas. LarKC. The Large Knowledge Collider a platform for large scale integrated reason-
ing and Web-search. European Research Project FP7- 215535, (2009).
11. Stuckenschmidt, H., Ceri, S., Della Valle, E. and van Harmelen, F.: Towards Expressive
Stream Reasoning. In: Proceedings of the Dagstuhl Seminar on Semantic Aspects of Sensor
Networks, (2010).
12. Toscani, D., Bargna, F., Quarenghi, L., Archetti, F., Giordani, I.: A software system for
data integration and decision support for evaluation of air pollution health impact. In:
ICEIS conference, 8 - 12 June, Madeira - Portugal (2010).
13. Umer, M., Kulik, L. and Tanin, E.: Optimizing query processing using selectivity-
awareness in Wireless Sensor Networks, Elsevier Computers, Environment and Urban Sys-
tems Vol. 33 79–8, (2009).
84
