
INTEGRATED INSTANCE-BASED AND KERNEL METHODS
FOR POWER QUALITY KNOWLEDGE MODELING
Mennan Güder, Özgül Salor and Işık Çadırcı
The Scientific and Technological Research Council of Turkey, 06531, Tubitak-uzay Metu Ankara, Turkey
Keywords: Machine Learning, Knowledge Discovery, Power Quality Mining, Feature Construction, Feature Extraction.
Abstract: In this paper, an integrated knowledge discovery strategy for high dimensional spatial power quality event
data is proposed. Real time, distributed measuring of the electricity transmission system parameters
provides huge number of time series power quality events. The proposed method aims to construct
characteristic event distribution and interaction models for individual power quality sensors and the whole
electricity transmission system by considering feasibility, time and accuracy concerns. In order to construct
the knowledge and prediction model for the power quality domain; feature construction, feature selection,
event clustering, and multi-class support vector machine supervised learning algorithms are employed.
1 INTRODUCTION
In order to improve the Power Quality (PQ) in
energy generation, transmission and distribution
systems, real-time and long-period data have to be
investigated and an exhaustive model of the
electricity system characteristics has to be
constructed. PQ events may cause shut down of
processes run by electronics devices. Therefore it is
important to detect, classify and model PQ events
occurrings on a specific site to take countermeasures
against the potential PQ problems. Data mining
methodologies on the PQ event data may be used to
identify the correlations between the events, sites
and transformer substations. The cause and location
of any event may also be identified with the use of
collected data. The resulting knowledge may be used
to avoid the problem in the future. Widespread and
long term PQ monitoring and analysis are required
to collect such data and contruct the corresponding
modelling. To handle the huge amount of PQ data, a
considerable amount of effort has been spent
previously. Automatic clustering is applied on the
harmonics data collected from three year
simultaneous measurements of eight sites in a
transformer substation (Asheibi, Stirling & Soetanto
2006). SNOB (2010) and AutoClass (2010) data
mining tools are used to cluster the collected data,
where SNOB implements unsupervised learning
using minimum message length principle and
AutoClass implements Bayesian classification. In
the research (Dash, Chun & Chilukuri 2003),
examination is carried on voltage raw data collected
for one year. First, data processing by using a phase
corrected wavelet transform is applied to extract
relevant features. Then the features and if-then-ruled
fuzzy neural classifier are used to classify the short
duration transient PQ disturbance patterns. Fuzzy
multi-layered perception is used to determine the
class membership values of the input patterns. The
trained fuzzy neural network is also used for rule
generation. Another research (Asheibi, Stirling &
Robinson 2006), uses ACPro clustering software in
order to build predicting models for load forecasting
and to discover the relationships between the input
and output variables. The other research is based on
signal processing techniques. In Gerek, Ece and
Barkana’s (2006) research, covariance behavior of
several features derived from the event data is used
for PQ event detection and classification.
Classification of PQ events such as harmonics, sags,
and capacitor switching is achieved using time-
frequency analysis of the voltage and current
waveforms in Wang, Rowe and Mamishev’s
research (2003). Neural networks have been used by
Uyar, Yildirim and Gencoglu (2008) for PQ
disturbance classification, while fuzzy-expert
systems are used by Liao and Lee (2003) for the
same purpose. Wavelets are used for PQ event
classification in the Hu, Zhu and Ren’s research and
Wang, Rowe and Mamishev’s research. In these
352
Güder M., Salor Ö. and Çadırcı I..
INTEGRATED INSTANCE-BASED AND KERNEL METHODS FOR POWER QUALITY KNOWLEDGE MODELING.
DOI: 10.5220/0003117703520357
In Proceedings of the International Conference on Knowledge Discovery and Information Retrieval (KDIR-2010), pages 352-357
ISBN: 978-989-8425-28-7
Copyright
c
2010 SCITEPRESS (Science and Technology Publications, Lda.)
types of systems, PQ events are characterized by
several features and these features are classified for
single phase voltages.
All of the methods reported in the literature strongly
depend on the magnitudes of limited number of PQ
parameters for small areas and time periods. These
dependencies result in lack of ability to compare the
points having different magnitude but parallel
characteristics, and over fitting on a restricted period
and area. There is a lack of a complete method to
construct a representing model of the event
distribution and characteristics for selected time
period and area. In this paper, instance-based and
kernel methods are integrated to cope with the huge
amount of PQ event data. The method enables each
monitor to be able to retrieve the up to date specific
model which may be used to adapt behaviour of the
monitor.
2 SYSTEM DESCRIPTION
In order model characteristics of the electricity
system long term monitoring and a detailed analysis
of the collected data are the crucial concepts. The
National PQ Project developed by the Power Quality
Department of TUBITAK (Scientific and
Technological Research Council of Turkey) fufills
the PQ monitoring requirement. The developed PQ
monitoring system monitors the PQ parameters in
transformer substations from all over the country,
handles the required PQ measurements and analyzes
the PQ archive with the use of domain-specific
machine learning algorithms. The National Power
Quality Project enables users to access two types of
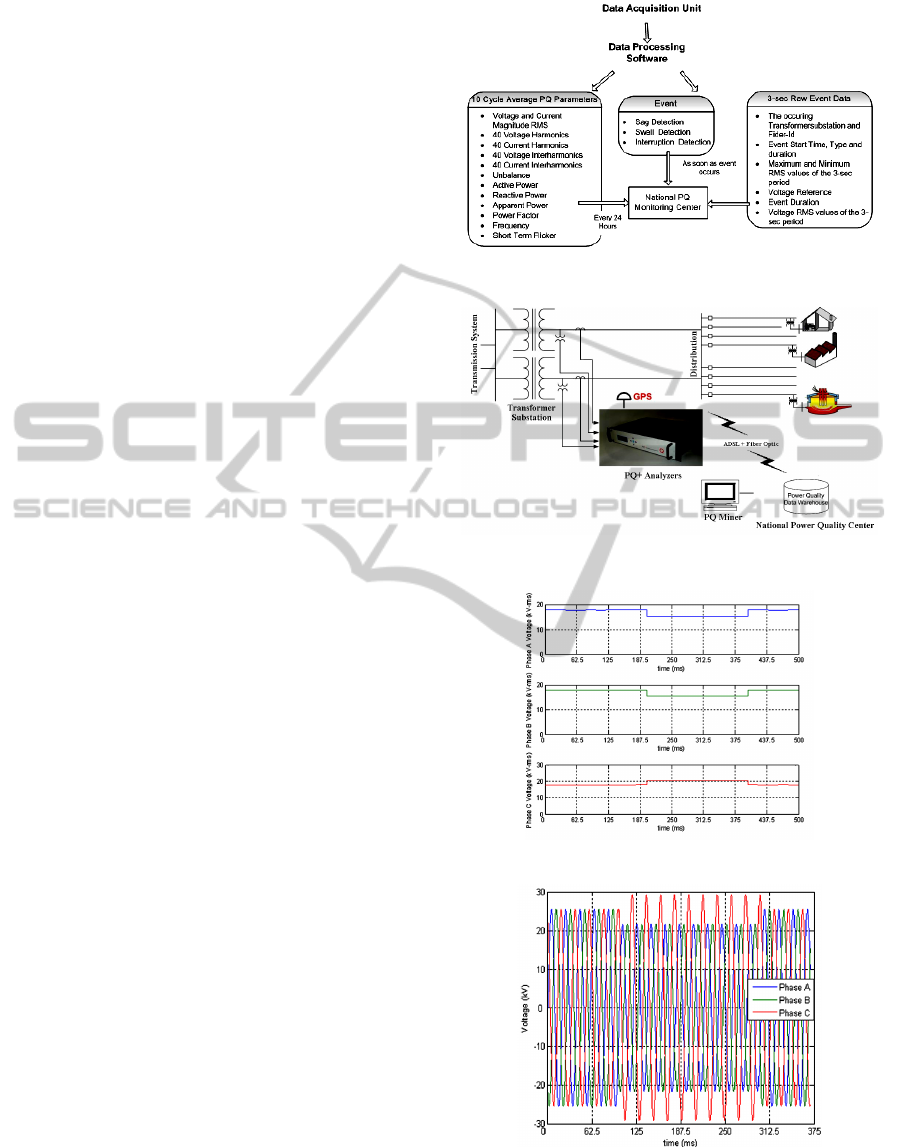
data; daily average data and event data; data flow
and the monitored contents are listed in Figure 1.
The main concern of the work presented in this
paper is the event data, which contains detected
voltage sags, swells and interruptions. The PQ event
data is obtained from the PQ sensors installed on the
country wide transformer substations. Real time
sensing of the electricity transmission system
provides huge number of time series, spatial PQ
events. Each raw event data include three-second
continuous measurements of the voltage and current
values at the event occurring fider. The PQ sensors
detect the event and communicate with the main
server and transfer the event data to the central data
warehouse. The proposed method accesses the data
warehouse and retrieves the events to be analyzed by
submitting spatial and time interval based queries.
The model of the overall system is given in Figure 2.
Figure 1: System Data Flow.
Figure 2: PQ Monitoring System Model.
a) Voltage-Time Graph of an Event Raw Data.
b) Voltage-Time Graph of the Event RMS Values.
Figure 3: Raw Data and RMS Representation.
INTEGRATED INSTANCE-BASED AND KERNEL METHODS FOR POWER QUALITY KNOWLEDGE MODELING
353

3 ALGORITHM DEFINITION
The proposed method is combines feature
construction, feature extraction, instance-based
clustering and support vector machine (SVM)
modelling in order to reveal characteristics of the
system. The flow diagram of the proposed method is
given in Figure 4. The first step, feature construction
defines a knowledge model for PQ event concept.
Expert knowledge is used to extract the features
representing each event jointly. The features are
constructed from the event raw data by root mean
square calculation over the 3 phase voltage and
current values. At the end of feature construction
step the expert view defines the affecting parameters
as a feature matrix. Feature matrix of the ith event Ei
is given in (1).
(1)
When the feature construction is accomplished,
feature selection process is required to be applied in
order to select relevant and informative features.
Aims of feature selection process are data reduction,
feature set reduction, performance improvement and
increasing data understanding. Subsets of the
features obtained from the feature construction step,
are generated, and these subsets are evaluated
according to defined assessment methods. Selecting
proper assessment technique is the crucial point in
feature selection. Filters, wrappers and embedded
methods are the main feature selection techniques.
Filters provide an order of the initial features
according to a relevance index. Wrappers implement
a learning to assign predictive power degrees to
subsets of the initial features. In the proposed
method, individual relevance ranking and principal
component analysis (PCA) are employed as filter
and wrapper, respectively.
After the feature construction and selection is
accomplished, the expert selects the spatial and time
information of the events to be considered via
developed PQMiner interface, the interface is given
in Figure 5. The events satisfying selected criteria
are queried from the central data warehouse in a
chunk-based manner; each retrieved chunk is
clustered by the k-means algorithm, results of each
chunk clustering is supplied to the next clustering
step and finally all of the events are clustered.
Experts examine the results of the chunk-based
clustering, and define the event classes by labeling
the revealed clusters by considering PQ event
properties. The training and test data sets are formed
from the clustering results and expert knowledge for
the concept learning step. The concept learning step
aims to model the behavior and characteristics of the
domain. Kernel-based method, SVM is selected to
form a flexible and powerful input representation for
the domain. The instance-based learning is designed
and implemented as chunk-based clustering. The
data is divided into chunks that can be clustered by
the k-means clustering algorithm. Overall clustering
results are obtained by consecutive application of the
clustering method to all of the chunks and
integration of the results.
Figure 4: Flow Diagram of the Proposed Method.
Figure 5: PQMiner Event Data Selection.
3.1 Feature Construction and Selection
The first step in the proposed method is feature
construction. Initially, the features are defined as:
• Event Type for each phase A, B and C: 3 Features
KDIR 2010 - International Conference on Knowledge Discovery and Information Retrieval
354
• Voltage Reference: 1 Feature
• The 299 slope values for each of the three phases
which are calculated from the distance between the
consequent voltage-RMS values of the event: 299*3
Features. This feature is time dependent representation
of the event signal.
After the features are constructed, elimination and
selection steps are started. In order to select the
features a training data set is required, the k-means
clustering algorithm and expert examination is
employed and the training set is constructed.
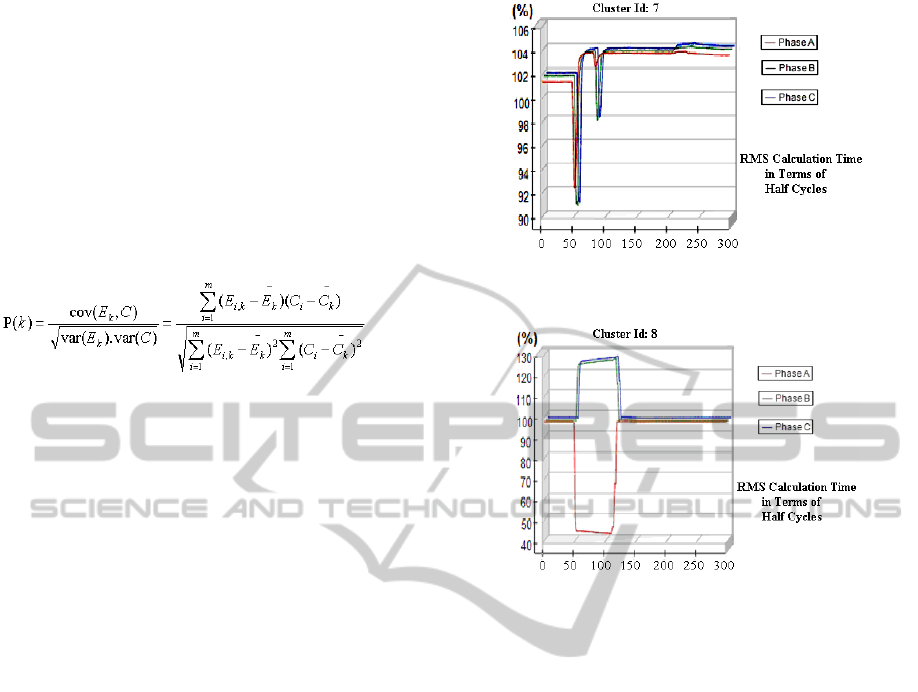
(2)
PCA and Pearson (
Jolliffe 2002) feature selection
calculations based on the training data set are used
for weight assignment to the each feature. The
Pearson correlation coefficient for k
th
feature is given
in (2), where m is the number of training samples
and C
i
is the corresponding class of the event E
i
. The
main approach in Pearson feature selection is
assigning a ranking to each feature by considering
the individual relevance and informative degrees.
Pearson correlation coefficient is the most used
relevance index for individual feature ranking to
measure distances of dimensions to the mean with
respect to each other.
PCA is generally used to eliminate noisy and
irrelevant features. Principal component analysis
(PCA) projects n-dimensional data onto a lower
dimension subspace by minimizing the square error
of the vector reconstruction. PCA steps may be
defined as follows:
• Calculate means for each data dimension and
subtract the corresponding mean from the every
data dimension of all of the training samples. By
this step all of the dimensions of the training set
would have zero mean,
• Calculate and form the covariance matrix from
the training vectors,
• Calculate eigenvalues and eigenvectors,
• Sort the eigenvectors in decreasing order of
corresponding eigenvalues, and select the
features with the higher eigenvalues.
When the three algorithm results are combined, total
number of features are determined as 448. The main
features to be used in the SVM classification and
modeling step are voltage reference and the 149 of
the initial 299 RMS values for each signal phase.
a) Cluster Number 7, typical class for line-to-ground
fault at Phase-A.
b) Cluster Number 8 Typical instantaneous sag event in
all three phases.
Figure 6: Cluster Result Examples.
After the calculations of Pearson and Fisher feature
importance values, corresponding weight values are
assigned to the features. Weight values are stored in
K
i
[j] where i denotes the signal phase and j denotes
feature number.
3.2 K-Means Clustering and Expert
Event Labeling
K-means, instance-based learning algorithm is used
as the base point in the proposed method to reveal
the structures in the PQ event data. After relevant
and most informative features are selected, the
clusters in the data are required to be obtained for
defining the characteristics of the domain and
distribution patterns of the events. K-means
algorithm requires a distance measure for the
comparisons of two items in the data set. The
distance measure used in the proposed method is
selected as the Euclidean distance between the
defined event matrices. The distance measure that is
used in the comparison of events is formulated in (3)
for the distance between two events E1 and E2
where K is the described feature importance weight
INTEGRATED INSTANCE-BASED AND KERNEL METHODS FOR POWER QUALITY KNOWLEDGE MODELING
355
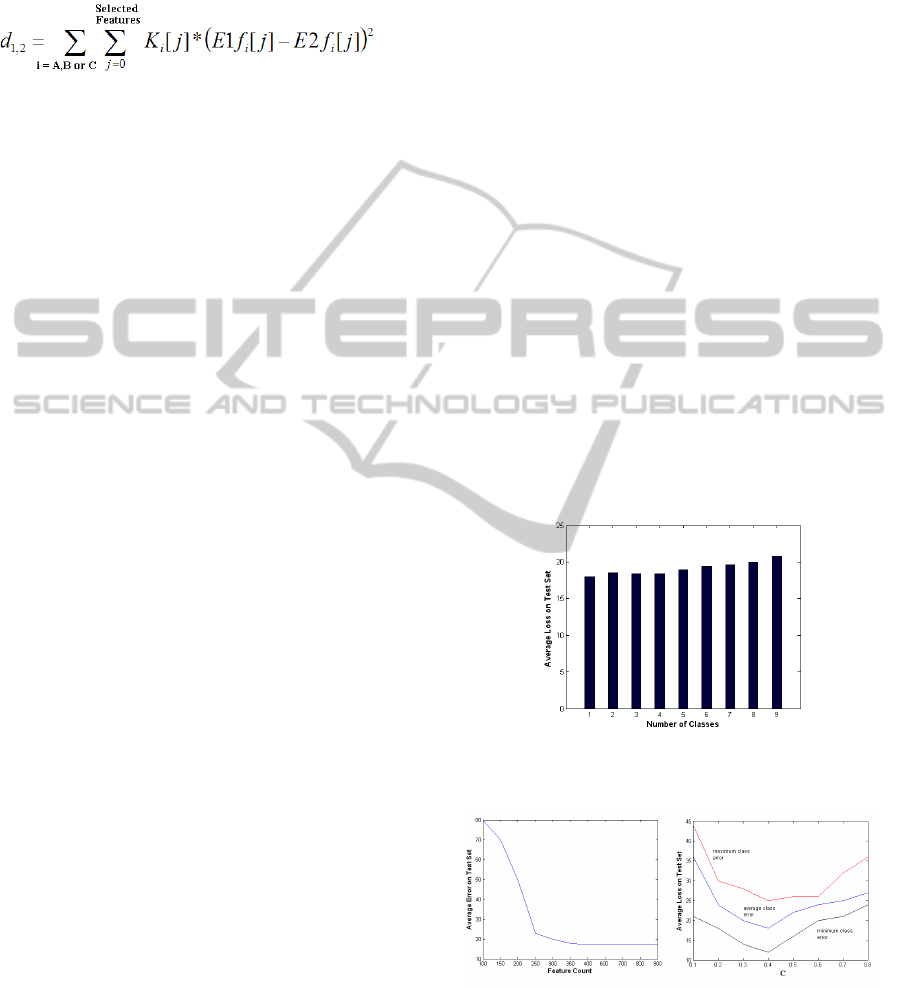
matrix. Chunk-based version of the k-means method
is given in the Figure 5 as a part of flow diagram.
Results of application of the algorithm with 9
clusters are given in Figure 6.
(3)
3.3 Model Construction Via Support
Vector Machine
The data dimensionality of the event data is
subjected to results of PCA and Pearson
calculations. The approximated model is constructed
from the most significant eigenvectors and the
corresponding features. Application of the previous
steps of the proposed method makes compact event
presentation available and supplies training and test
sets to construct a model of the domain. The noise in
the event data set is eliminated in many steps such
that the sensor detection and calculation process,
rms calculation and data warehouse insertion. SVM
is selected because it creates sparse solution which is
an important requirement when considered the data
size. SVM also handle large feature spaces, and
adapting the margin properties gives ability to
control over fitting problem. SVM multi-class
learner is applied to the constructed trained set and
the model for the PQ event domain is obtained.
When the model is constructed, SVM multi-class
can be used to classify any instances of events. The
results of a sample run on 660 event training set are
given as:
Total number of constraints (features) in final
working set: 103 (of 299)
Number of iterations: 300 - Number of SV: 67
Norm of weight vector: |w|=9.84792 - Runtime
in cpu-seconds: 34.70
4 EVALUATION
The evaluation of the model developed by SVM is
tested on the data formed by employing the k-means
clustering and the PQ expert knowledge. The main
argument to evaluate the constructed model is the
average loss values of different applications of the
SVM classification.
The relation between the number of classes and the
average error values is given in the Figure 7. The
training and test sets for different number of classes
are obtained from the k-means clustering and expert
analysis results. Error values increase as the number
of classes increase. There is a tradeoff between the
error values and the differentiating capability of the
system. The optimum value of the number of classes
is obtained from the examination of results of the
employed clustering method. SVM models generally
have a cost parameter C, by means of which the
tradeoff between training error and rigid margin can
be controlled. Increasing the value of C, results in
better fit on the training error. However after some
value better fit may become over fitting and results
in more error on test set as seen from graph given in
Figure 8. The optimum value should be selected in
order to obtain general enough and accurate model.
The relation between the numbers of feature used to
present events and average error results obtained
from the application of the SVM classifier on the
test data is given in Figure 8. As observed up to
some number of features is eliminated by the feature
elimination step, the error value does not respond to
change anymore. Thus the optimal feature count is
around 250 which are close to the obtained result
from feature selection process. The comparison of
the selected SVM classification on different data sets
is given in Table 1.
Figure 7: Class number versus avearage loss on the test
data.
Figure 8: Left: Features count versus average loss on the
test data results. Right: Margin versus average loss on the
test data.
KDIR 2010 - International Conference on Knowledge Discovery and Information Retrieval
356

Table 1: Benchmark Data and Proposed Method Results
for SVM (Sivakumari, Praveena & Amudha 2009).
5 DISCUSSION
AND CONCLUSIONS
The aim of the proposed method is revealing the
patterns in the event data by enabling magnitude
independent event comparisons according to the
event rms values, time and duration shifts in order to
detect type similarities. The current focus on the PQ
mining is restricted on small parameters and lack of
cause and effect analysis view. The methods are
based on just examining limited PQ parameter
values for a limited time period and describe the
overall view at that period. By means of the
proposed method, long period event data
examination is made possible. The method focuses
on the magnitude independent patterns in the data by
combining the appropriate instance-based learning
algorithm results, expert knowledge and SVM
modeling. Chunk-based application of the
algorithms makes system able to handle big amount
of data, however the chunk-based structure makes
the methodology not deterministic compared to the
original versions of the selected clustering and
classification algorithms.
Although the PQ event data is time series,
throughout this paper the time component of the
events are just considered as the occurring time.
However, a complete analysis of the system should
reveal the time series based characteristics and
behavior of the system together with examining the
spatial characteristics of the system.
ACKNOWLEDGEMENTS
This research and technology development work is
carried out as a subproject of the National Power
Quality Project of Turkey. Authors would like to
thank the Public Research Support Group
(KAMAG) of the TÜBİTAK for full financial
support of the project.
REFERENCES
A. Asheibi, D. Stirling, D. Soetanto, “Analyzing
Harmonic Monitoring Data Using Data Mining”, 5th
Australian Data Mining Conference, AusDM, 2006.
A. Asheibi, D. Stirling, D. Robinson, “Identification of
Load Power Quality Characteristics Using Data
Mining”, IEEE CCECE/CCGEI, 2006.
Autoclass, viewed 5 March 2010, http://ti.arc.nasa.gov/
project/autoclass/.
B. Biswal, P. K. dash, J. B. V. Reddy, “Power Signal
Classification Using Dynamic Wavelet Network”,
Applied Soft Computing, vol. 9, pp. 118-125, 2009.
G.S. Hu, F.F. Zhu, Z. Ren, “Power quality disturbance
identification using wavelet packet entropy and
weighted support vector machines”, Expert Systems
with Applications, vol. 35, pp. 143-149, 2008.
M. Wang, G. I. Rowe, A. V. Mamishev, “Classification of
Power Quality Events Using Optimal Time-Frequency
Representations – Part 2: Application”, IEEE Trans.
on Power Delivery, vol. 19, no. 3, July 2003.
M. Uyar, S. Yildirim, M. T. Gencoglu, “An expert system
based on S-transform and neural network for
automatic classification of power quality
disturbances”, Expert Systems with Applications,
Elsevier, 2008.
Jolliffe, I. T., 2002. Principal Component Analysis.
Second ed. Springer Series in Statistics. New York:
Springer-Verlag New York.
O. N. Gerek, D. G. Ece, A. Barkana, “Covariance
Analysis of Voltage Waveform Signature for Power-
Quality Event Classification”, IEEE Trans. on Power
Delivery, vol. 21, no. 4, Oct. 2006.
P. K. Dash, I. L.W. Chun, M. V. Chilukuri, “Power
Quality Data Mining Using Soft Computing and
Wavelet Transform”, Conference on Convergent
Technologies for Asia-Pacific Region, TENCON
2003.
Snob, viewed 2 March 2010 http://
www.datamining.monash.edu.au/software/snob/.
S. Sivakumari, R. Praveena Priyadarsini, P. Amudha,
“Performance evaluation of SVM Kernels Using
Hybrid PSO-SVM”, ICGST-AIML Journal, ISSN:
1687-4846, Volume 9, Issue I, February 2009.
Y. Liao, J. B. Lee, “A fuzzy expert system for classifying
power quality disturbances”, Electrical Power and
Energy Systems, vol. 26, pp. 199-205, 2004.
INTEGRATED INSTANCE-BASED AND KERNEL METHODS FOR POWER QUALITY KNOWLEDGE MODELING
357
