
Automatic Feature Selection for Operational Scenarios
of Satellite Image Understanding using Measures
of Mutual Information
Dragos Bratasanu
1
, Ion Nedelcu
1
and Mihai Datcu
2
1
Romanian Space Agency ROSA, Mendeleev 21-25, 010362, Bucharest, Romania
2
DLR German Aerospace Center, Oberpfaffenhoffen D-82234 Wessling, Germany
Abstract. The Earth Observation processing tools operating in the recent scena-
rio need to be tailored to the new products offered by the sub-meter spatial reso-
lution imaging sensors. The new methods should provide the image analysts the
essential automatic support to discover relevant information and identify signif-
icant elements in the image. We advocate an automatic technique to select the
optimum number features used in classification, object detection and analysis of
optical satellite images. Using measures of mutual information between the tar-
get classes and the available features, we investigate the criterions of maxi-
mum-relevance and maximum-relevance-minimumredundancy for automatic
feature selection at very-low cost. Following a comprehensive set of experi-
ments on multiple sensors, applications and classifiers, the results demonstrate
the possible operational use of the method in future scenarios of human-
machine interactions in support of Earth Observation technologies.
1 Introduction
The methods and ways users operate the Earth Observation (EO) satellite data in the
present scenario are beginning to change the paradigms of classical image analysis. If
in the past the existent automatic classification and segmentation tools provided good
results for mapping of decameters resolution images, nowadays these tools fail to
offer the users the necessary support in discovering relevant information in the image.
The old methods for knowledge-based image understanding were operating on
two distinct levels: pixel level (e.g. classification techniques in which each pixel is
assigned with a label) and region level (e.g. segmentation techniques in which homo-
geneous image regions are assigned with labels). The resolution of new optical sen-
sors has reached values of centimeters (e.g. GeoEye-1 0.41m, Quickbird 0.6m and
World-View-2 0.50m) and outran the capabilities of standard information mining tools
to infer knowledge using spectral and spatial information. Future tools need to look at
the way analysts understand the data and how the current manual operations are per-
formed. We introduce an approach based on patch-level analysis, capturing contextual
information – sub-meter resolution image areas interconnect complex structures cov-
ering many pixels with high diversity of spectral information. By using this approach
we line up to the way users create cartographic products for multiple applications (e.g.
Bratasanu D., Nedelcu I. and Datcu M..
Automatic Feature Selection for Operational Scenarios of Satellite Image Understanding using Measures of Mutual Information.
DOI: 10.5220/0003143101090117
In Proceedings of the International Workshop on Semantic Sensor Web (SSW-2010), pages 109-117
ISBN: 978-989-8425-33-1
Copyright
c
2010 SCITEPRESS (Science and Technology Publications, Lda.)
maps for emergency response, geo-intelligence, forensics). Maybe the most important
step in all automated procedures is to identify the optimum set of attributes – feature
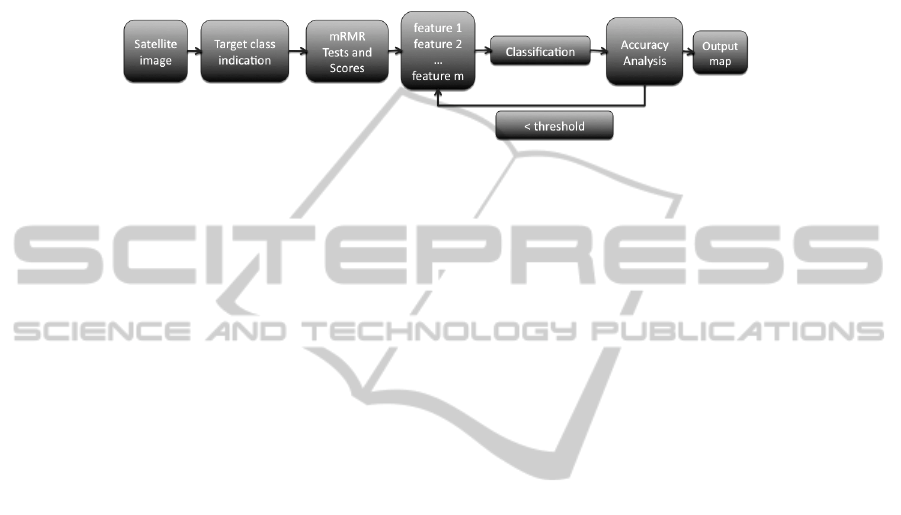
selection - to minimize the classification error. Using the minimum-redundancy-
maximum-relevance (mRMR) criterion [1] based on mutual information, we intro-
duce a method to select an ideal set of features from the available set. Fig.1 shows the
workflow of our procedure.
Fig. 1. Workflow for selecting the optimum features for target class classification.
We test the resulting attributes using four classifiers (Minimum Distance, Maximum
Likelihood, Mahalanobis Distance and Latent Dirichlet Allocation (LDA) [2]). The
minimum of the classification error yields the optimum feature set as a function of the
operating classifier. The results confirm that the mRMR method applied to sub-meter
resolution data improves classification accuracy for applications based on the new
sensors.
2 Theoretical Approaches
2.1 Feature Selection using Statistical Measures of Mutual Information
In all information-mining applications, feature selection (characterizing attributes for
a given class) is a critical step in minimizing the classification error. Having available
a data set D described by M features
{, 1... }
i
X
xi M==
and the target class C, the
problem is to discover a subspace of m features
m
R
in the feature space
M
R
that cha-
racterizes C. Of course, the score for each possible feature set needs to be related to
an operational classification algorithm. The question that rises is ‘what subset
mM
RRÌ
is the optimum for the problem at hands?’ Since there are countless combi-
nations of the existent attributes, we use an incremental method explained in the fol-
lowing paragraphs.
The optimal characterization condition most of the times implies minimal classifi-
cation error for the target class, which in turn requires the maximal statistical depen-
dency of the target class C on the data distribution in the subspace
m
R
. In literature,
this condition is known as maximal dependency.
The maximal dependency approach is widely debated in information theory publi-
cations and the most familiar way to obtain it is to use maximum relevance (MR)
criterion – selecting the features m with the highest relevance to the target class C.
The relevance of features
m
R
to the features in C is defined in terms of mutual infor-
mation. Given two random variables x and y with probability density functions p(x)
and p(y), the following formula gives their measure of mutual information:
110

(, )
(, ) (, )log
() ()
pxy
I
xy pxy dxdy
pxpy
=
òò
(1)
The selected features
i
x
in
m
R
need to yield the largest mutual information
(,)
i
IxC
with the target class C. In the incremental search, the first m maximum scores of mu-
tual information
(,)
i
IxC
yield the selection of the best m features.
The MR criterion gives a good start in the feature selection problem but it does not
answer two critical questions: ‘what is the optimum number of features m to select
from the mutual-information
(,)
i
IxC
scores’ and ‘are all these selected attributes
useful to minimize the classification error?’ In information theory it is widely ac-
cepted that the combination of individually good features may lead to confusion in
classification results if they have a high level of mutual redundancy. One approach to
reduce redundancy amongst characteristics is the minimum redundancy (mR) crite-
rion.
In [3] the authors introduce a minimum-redundancy-maximal-relevance (mRMR)
framework to select the optimum number of features and minimize redundancy
amongst them. We will describe this method in the following paragraphs.
2.2 Category Discovery using Maximum relevance Minimum Redundancy
When considering mutual information the reasoning for discovering the optimum set
of attributes, the goal is to find a feature set S with m features
{}
i
x
, which jointly
have the largest dependency, on the target class C (2).
( , ) max( ( , 1... ), )
i
M
axDependency S C I x i m C==
(2)
Because maximum dependency is often hard to implement even for discrete ran-
dom variables, maximum relevance criterion (MR) has been proposed as alternative
in publications. The MR criterion approximates the dependency between multiple
random variables by selecting the features approximating
max( ( , 1... ), )
i
Ixi m C=
with the mean value of all mutual information values be-
tween individual features
i
x
and class C (3).
,
1
max ( , ) max ( , )
||
ij
i
xx S
DSC I x C
S
Î
=
å
(3)
It is well known in remote sensing literature that usually features (e.g. spectral bands)
may present high redundancy for a specific target class. When two or more variables
have a rich content of mutual information, discriminating between the target class and
the rest does not change if one feature is removed. In order to select mutually exclu-
sive features, the criterion of minimum redundancy (mR) may be used following the
MR. (4)
2
,
1
min( ,( )) min ( , )
||
ij
ij
xx S
RS Ixx
S
Î
æö
÷
ç
÷
ç
=
÷
ç
÷
ç
÷
ç
èø
å
(4)
111

The criterion that combines the MR and the mR is called minimum-redundancy-max-
relevance (mRMR) [3]. We choose the form (5) to combine the above formulas,
where D is the max-relevance and R is the min-redundancy:
max( )mRMR D R=-
(5)
In operational application we used an incremental version for selecting the feature set.
If we have m-1 selected attributes, the task is to select the m-th feature that maximizes
the mRMR condition (6):
1
1
1
max ( , ) ( , )
1
im
jm
jji
xS
xXS
Ix C Ix x
m
-
-
Î
Î-
é
ù
ê
ú
-
ê
ú
-
ê
ú
ë
û
å
(6)
2.3 Choosing the Optimal Feature Set
After determining the score for each feature with the mRMR tests, the remaining
issue is to determine the optimum number of attributes m. To discover the feature set
m
SSÌ
we follow the workflow in figure 2.
Fig. 2. Selecting the optimum feature set.
The process of selecting the optimum characteristics for a specific target class in-
cludes the following steps:
1. Determine the available features for the satellite image – spectral bands, textural
information, etc
2. Choose a patch from the image representing the target class
3. Determine the score of the mRMR tests for each feature
4. Begin with the top 3 features
S3 and determine the classification accuracy for each
adjacent features sets
S3 ⊂ S4 ⊂ S5...⊂ Sm. The feature set that yields the low-
est classification error
min( )
k
ee=
gets selected to be the optimum one.
2.4 Multiple Classifiers
The mRMR feature selection scheme does not imply the use of a specific classifier.
We have tested this approach on multiple supervised classifiers with the same train-
ing set and discovered that optimum attributes differ not only with respect to the tar-
get class but also with respect to the operational classifier. We used in our case stu-
112

dies the Minimum Distance, Mahalanobis Distance, Maximum Likelihood and Latent
Dirichlet Allocation described in [2].
The Minimum Distance classifier discovers the classes of interest by the following
rules [4]. Suppose
i
m
are the means for the M classes determined from the training
data and x is the position of the pixel to be classified. Classification is performed on
the basis of:
i
xwÎ
if
22
(, ) (, )
ij
dxm dxm<
for all
ji¹
(7)
Maximum Likelihood classification works on the following principles [4]. Let the
spectral classes for an image be represented by
,1...
i
iMw =
with M the total number
of classes. A pixel x is assigned to class
i
w
if:
(|) ( |)
ij
pxp xww>
for all
ji¹
(8)
(|) (|)()/()
iji
pxp xp pxwww=
(9)
P(ωi)istheaprioriprobabilityofclass
i
w
tooccurintheimage.
The Mahalanobis Distance classifier assigns each pixel in the image to one of the
training classes based on the following distance measure [4]:
21
(, ) ( ) ( )
t
ii i
dxm x m x m
-
=- -
å
(10)
The Latent Dirichlet Allocation based classifier is thoroughly described in [2] and
works by assigning each pixel and each patch in the image to a specific ‘latent’ topic
generated from the training patches. For all classifiers, experiments and results are
presented in the following section.
3 Operational Case Studies and Results
3.1 Urban Areas Extraction using WorldView-2 Satellite Image
In the first case study we aim to discover the optimum feature set and extract the
urban areas from a WorldView-2 image (resolution of 0.5 meters / pixel). Figure 3
shows the test image and the training patch used to indicate the target class.
113

Fig. 3. WorldView-2 image and the target class Urban areas.
The first set of features contained only the 8 spectral bands provided by the sensor
(costal, blue, green, yellow, red, red-edge, nir-1, nir-2). We computed the MR and
mRMR values between all features in the data set and the target class and drew the
score table as shown in figure 4.
Fig. 4. The scores for the features in the data set and the results of mRMR criterion.
After evaluating the mRMR scores, we train the test classifiers with patches
representing the target class and classes labeled as ‘others’. The first three top features
(nir-1, blue, yellow) are tested first and then each feature in the scores table in added
to the classifier. Figure 5 shows how each classifier operates better on a different set
of input features, yielding different accuracy values (the y-axis) as function of the
input features (the x-axis). The Maximum Likelihood classifier gives the best accura-
cy value (93%) with the first three features (nir-1, blue, yellow) and the target class
mask is shown in figure 6.
Fig. 5. Classification accuracy as a function of the input features and the classifier used.
114

Fig. 6. WorldView-2 image and the target class extracted with Max Likelihood.
We added textural information to the first set of features and recomputed the MR and
mRMR values between all features in the data set and the target class. The table score
is presented in figure 7. We compute the classification accuracy for the first three top
features and then add an extra attribute each step and re-perform the experiments.
From the graphics in figure 8 we can easily understand that the best accuracy is ob-
tained by using the first 7 features in the score table with Maximum Likelihood.
Fig. 7. MR and mRMR scores for the features in test.
Fig. 8. Target class and the classification accuracy as a function of the features in test.
115

3.2 Urban Areas Extraction using GeoEye-1 Satellite Data
In the second case study we aim to discover the optimum feature set and extract the
urban areas from a Geoeye-1 image (resolution of 0.41 meters / pixel). Figure 9
shows the test image and the training patch used to indicate the target class.
Fig. 9. GeoEye-1 image and the target class Urban areas.
On this image we performed three types of experiments, with different input feature
sets. The first set consists only of spectral information, the second contains the spec-
tral bands and textural information and the third has the spectral bands and the vegeta-
tion index NDVI. Each experiment gave different scores for the mRMR tests and the
top is presented in figure 10. Figure 11 shows the classification accuracy of the target
class as function of the input features and the classifier used. The graphics show that
the lowest error is obtained by the Minimum Distance classifier applied to the first
four textural features in the score table.
Fig. 10. mRMR score for three different feature sets of GeoEye-1 image.
4 The Sensor Data-knowledge Continuum
The recent and future scenarios of sensorics arise with the promise of new capabilities
for collecting and distributing information about the world. However, there is still a
gap between the raw data coming from the sensor in form of numbers (measures of
116

Fig. 11. Classification accuracy scores for GeoEye-1 image, target class Urban areas.
physical phenomena) and applied user-oriented knowledge (in form of meaning).
When the human mind understands an object or an event, it classifies it automati-
cally into an acknowledged category with sense and implicit semantic denotation.
We introduce a procedure to describe an important layer of automatic data
processing i.e. feature selection with the aim of supporting the users to find what they
are looking for in the collection of data. In order to add human-oriented conceptual
meaning to the abstract representation of sensor information, semantics may be intro-
duced at different steps of the workflow.
The mRMR technique yields highly accurate results when used with a layered
classifier – inferring classes one at a time. The user indicates the target category; adds
a descriptive caption to it and detects the optimum features simultaneously. This ap-
proach ensures that the class of interest is extracted with maximum accuracy and in
the same time it is represented in the concepts domain by the wording chosen by the
user. Thus, the added semantics provide an inter-connection between layers of infor-
mation in the sensor data-knowledge continuum.
References
1. Peng, H., Long, F., Ding, C.: Feature Selection Based on Mutual Information: Criteria of
Max-Dependency, Max-Relevance and Min-Redundancy. IEEE Transactions on Pattern
Analysis and Machine Intelligence. Vol. 27. No.8. 2005. Pp 1226-1238
2. Bratasanu, D., Nedelcu, I., Datcu, M.: Bridging the gap for satellite image annotation and
automatic mapping applications. IEEE Journal of Selected Topics in Applied Earth Obser-
vations and Remote Sensing, accepted paper 2010
3. Ding, C., Peng, H.: Minimum Redundancy Feature Selection from Microarray Gene Ex-
pression Data. Proc. Second IEEE Computational Systems Bioinformatics Conference.
2003. Pp 523-528
4. Richards, J., Jia, X.: Remote Sensing Digital Image Analysis. 4th Edition. Springer, 2006.
117
