
BOOK SUPPLY CHAIN MODEL BASED
ON SYSTEM DYNAMICS
Wu Chong-yu and Lu Xiao-chun
School of Economics & Management, Beijing Jiaotong University, Beijing, China
Keywords: Book Supply Chain, Model, System Dynamics.
Abstract: Research on the book supply chain has always been a topic of discussion. This paper uses system dynamics
theories and models to simulate the key part of supply chain of book industry in real-life. Firstly, the paper
describes the purpose of book supply chain model and methods. Secondly, control the relationship between
sales and returns on the basis of analyzing the workflow of book supply chain, and then establish the book
supply chain mode. Finally, test the rationality of book supply chain mode through inputting the data of
parameters in model.
1 INTRODUCTION
Our society is now in the information age, because
of special varieties of goods and market demand, an
increasingly shorter life cycles of books, the
turnover rate of returned books and cycle time have
become important issues in the book supply chain
management. The distribution system reform of
Book supply chain has been from "Order book to
ensure sales" to "No sales of the book to ensure
return”. Publishing house has been from the
initiative into a passive position. Shortening of
product life cycle and the transfer of power of
supply chain generate a large number of return
books within supply chain and the distributor
inventory backlog of serious books. “The relevant
data show that the inventory of publications there
are at least 50 billion to 60 billion Yuan of the scale,
about 90% of the stock books can only be
denominated in dealing kg” (Li Xianglan 2005,
p.66-68) . Obviously, the reverse logistics of China's
book market has become an important issue that
needs to be explored and studied to find some
optimal solutions to these problems.
Yang Jianzhong (2001), taking the computer
books for example, analyzed the reasons that
publishers have a large number of returns and
Countermeasures that publishers reduce the returns
and pointed out the main cause of book returns that
is the increasingly fierce market competition and the
extensive mode of marketing. Finally he gave the
eight-pronged approach to reduce return books. Liu
Haiyan and Lv Qingxian (2004) put forward the
causes that the book supply chain has a "bullwhip
effect", analysed the impact that "bullwhip effect"
brings, and proposed some suggestion to solve the
problem. Chen Li and Lin Quan (2006) studied that
information technology improve the reverse logistics
model in the publishing industry's applications under
the network environment. Tan Weifeng (2005)
recapitulated the reason that book reverse logistics is
in crisis in China from the point of the publishers,
distributors and retailers of view and proposed five
kinds of optimization programs. Ding Weifei (2009)
proposed that the book reverse logistics with the
high rate of return and a large quantity of stock had
become a bottleneck in the development of book
industry, and explored a few points to propose
reverse logistics in theory.
In the quantitative analysis, Dobos (2003)
proposed a model of inventory management of
deterministic logistics activities. He presumed that
the demand and recovery are known for a given
function, and the cycle of all logistics activities are
known. He proposed the optimal control problem
which contains two state variables (the state of two
stocks) and three control variables (production
rate,re-manufacturing rate and processing rate). Mi
Zhongchun, Miao Mianyun
[8]
proposed a waste
home appliances recycling model for reverse
logistics system managed by fund management
agencies, and made a parameters evaluation of this
199
Xiao-chun L. and Chong-yu W.
BOOK SUPPLY CHAIN MODEL BASED ON SYSTEM DYNAMICS.
DOI: 10.5220/0003267401990204
In Proceedings of the Twelfth International Conference on Informatics and Semiotics in Organisations (ICISO 2010), page
ISBN: 978-989-8425-26-3
Copyright
c
2010 by SCITEPRESS – Science and Technology Publications, Lda. All rights reserved

mathematical model.
At present the study of Chinese book supply
chain only remains in the stage theory and stage
measures, and the vast majority of theories and
measures are based on the implement changes in
forward book supply chain. The reverse rarely
involved quantitative research less. Computer
simulation has provided us with new ideas for
research. It can abstract the objective world, and find
relevant information resources from the simulation
results to make decision. Therefore, we need to
simulate the book supply chain, so we can take
forward and reverse process as a system together in
the model, use this model as a platform for the
systematic study of book supply chain. We can
identify the intrinsic relationship of various elements
and quantify the relationship between their
respective information through the parameter
settings and changes to solve a large number of
return books in book supply chain and its related
issues.
2 FEASIBILITY ANALYSIS TO
MODELING OF THE BOOK
SUPPLY CHAIN BASED ON
SYSTEM DYNAMICS
System dynamics is a subject to analyze information
feedback system, was founded by Professor Jay W.
Forrester at the Massachusetts Institute of
Technology in 1956. System Dynamics based on
system theory, with both essence of cybernetics and
information theory. The way of SD solve problems
is the unity of qualitative and quantitative analysis.
Take qualitative analysis as a guide; with
quantitative analysis in support .Two complement
each other. “SD analyzes system to model from
internal mechanism and micro-structure of the
system. It analyzes relationship of dynamic behavior
and the internal structure of system to find solutions
to these problems using computer simulation
techniques (Wang Qifan 1988, p.1).
Both the SD subject characteristics and
systematic nature of book supply chain activities
decide SD can apply to the field of library supply
chain issues.
(1) Book supply chain system is dynamic. There
are a numbers of states changing over time in the
system, such as wholesalers’ inventory, retailers’
inventory, inventory in transit, etc. The
corresponding cost and the number of goods in
logistics activities related to dynamic change over
time too. The system dynamics build a structure -
functional simulation model, it is best used to study
the complex system structure, function and dynamic
relationship of behavior.
(2) The book supply chain system is a causal
feedback system. The state variables changing over
time in system are caused by some kind of factors.
In other words, it is suitable for using system
dynamics approach to analyze issues in book supply
chain because the activities in book supply chain can
be formed a variety of causal feedback relationship.
(3) The system dynamics can still research under
the conditions lack of data. The complexity of book
supply chain has led to some of the parameters
relationship are difficult quantified or lack of data.
But due to the structure of system dynamics model is
based on feedback loop-based, SD focused on
concern about the logical relationship between the
variables. The existence of multiple feedback loops
makes the system behavior model for most
parameters are not sensitive. Thus, although lack of
data, as long as the estimated parameters in the
context of its setting, the system dynamics can still
carry out some research work.
In summary, the system dynamics is suitable for
studying book supply chain issues. it can construct
that can reflect the non-linear, multi-feedback
dynamic model according to abstract the causal
relationship between various factors in book supply
chain system, achieve dynamic system the
movement process with computer simulation method,
and analyze the human factors that decision-making
factors on the system movements.
3 BOOK SUPPLY CHAIN
MODELING
3.1 The Process Analysis of Book
Supply Chain
The forward process of book supply chain is usually
from printing to the publishing house and then
publishers shipped to wholesalers at all levels to
form wholesalers’ inventory. All levels wholesalers
send books to the retailers at all levels to form retails
inventory. At last retailers sell books directly to final
consumers. The reverse process of book supply
chain, in China, is generally level-return. Retailers
return the books that did not sell or defects to their
ICISO 2010 - International Conference on Informatics and Semiotics in Organisations
200
superiors wholesalers. Wholesalers put the books
from all retailers together and then return to their
corresponding superiors publishing house.
Publishing house, based on the actual situation, let
the books that still have some market demand and
will be no quality problems have a second delivery
and the other books become pulp. This paper
emphasize on the relationships of order, sales and
returns, use of demand-driven type and select a part
in the end of the entire supply chain, that is from
market demand to retailers then to wholesalers to
explain the model construction. This paper assumes
that printers send books directly to wholesalers.
There is no delay in orders. In order to simplify the
supply chain to highlight the key construction, we
just select one wholesaler and one retailer. The paper
mainly discusses how to define the relations among
ordering, sales and returns and how to achieve
convergence between forward and reverse logistics.
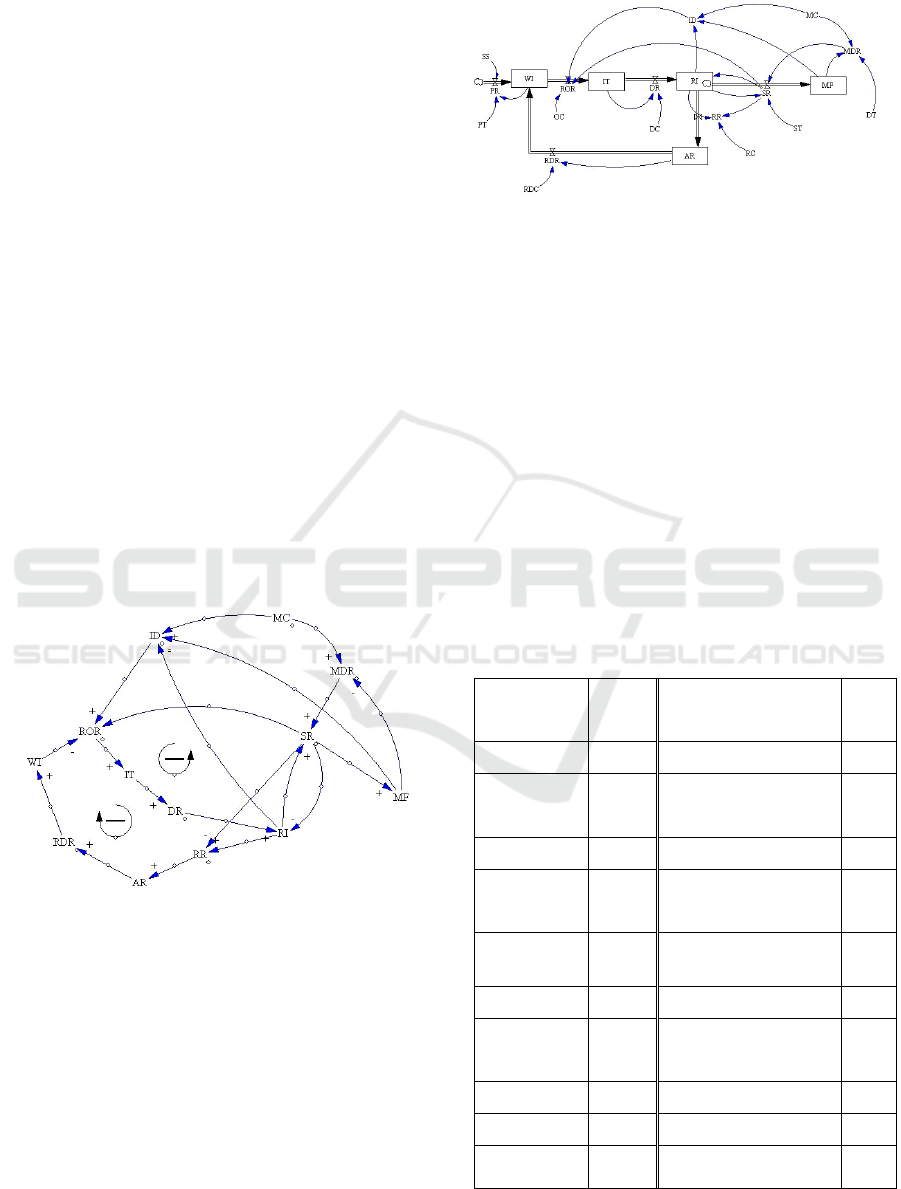
3.2 Causal Loop Diagram of Book
Supply Chain
According to the process and characteristics of book
supply chain mentioned above, we can establish a
causal loop diagram of book supply chain shown in
Figure 1.
Figure 1: Causal loop diagram of book supply chain.
Through the sign of the figure we can find two
negative feedback cycles. It is such a negative
feedback so that the inventory of whole supply chain
can be adjusted.
3.3 Book Supply Chain Modeling based
on SD
After analyzing the logical structure, we can have
this as a basis for the establishment of book supply
chain model, shown in Figure 2.
Figure 2: The system dynamics simulation diagram of
book supply chain.
Market capacity is the overall capacity of the
market for books in a period of time. Generally,
retailers according to the historical records of
customer needs make predictions, and then retailers
determine their own objective inventory based out of
this forecast demand, and determine their own order
rate depending on the inventory differences, that is
the difference between the target inventory and the
retailers real inventory. Other processes are in line
with the preceding analysis.
A brief introduction of each variable and their
equations in this model as followed. The
abbreviations of each variable and constant are
showed as table1.
Table 1: Abbreviation.
wholesalers
inventory
WI printing rate PR
retailers inventory RI retailers order rate ROR
inventory in
transit
IT distribution rate DR
safety stock SS sale rate SR
the amount of
return
AR return rate RR
market fulfill MF reverse distribution rate RDR
market capacity MC the market demand rate MDR
inventory
differences
ID return cycle RC
printing time PT reverse distribution cycle RDC
order cycle OC demand time DT
distribution cycle DC sale time ST
BOOK SUPPLY CHAIN MODEL BASED ON SYSTEM DYNAMICS
201

(1)Stock
Wholesalers inventory (WI) is a stock, that is, the
current stock of wholesalers’ inventory center. PR
and RDR are the inputting rate of WI; ROR is the
outputting rate of WI.
(+ )dt
∫
WI = PR RDR- ROR
(DR )dt
∫
RI = - RR- SR
(RR )dt
∫
AR= - RDR
The market fulfill that is the amount of market
capacity has been met.
dt
∫
MF= SR
Inventory in transit is r in-transit cargo from
the wholesalers to the retailers.
(ROR )dt
∫
IT= -DR
(2)Flow
First to introduce this function: IF THEN
ELSE ((condition), (ontrue), (onfalse)).The
meaning is first judge the condition in parentheses,
if met, then take ontrue value, the other hand, take
onfalse value.
The Vensim equations and mathematical
relationship of all rate variables as follows:
ROR=IF THEN ELSE ((ID<=0): AND :( SR<=0),
0, ID/OC+SR)
that is:
0
/ + others
≤
≤
⎧
⎨
⎩
0,ID 0且SR
ROR=
IDOCSR,
SR=IF THEN ELSE(MDR=0, 0 , RI/ST)
that is:
MDR 0
SR
RI/ST MDR
=
⎧
⎨
≠
⎩
0,
=
, 0
RR=IF THEN ELSE ((RI>0): AND: (SR<=0),
RI/RC, 0)
that is:
/
others
≤
⎧
⎨
⎩
RI RC,RI > 0 且SR 0
RR=
0,
PR= (SS-WI)/PT
DR=IT/DC
RDR=AR/RDC
(3)Other variables and constants
MDR=IF THEN ELSE (MC<=MF, 0, (MC-MF)/DT),
that is:
0 ≤
⎧
⎨
⎩
,MCMF
MDR=
(MC- MF)/DT,MC> MF
ID=MC-MF-RI
SS, MC, PT, OC.DC, ST, DT, RC, RDC are
constants.
4 BOOK SUPPLY CHAIN MODEL
ANALYSIS
This paper simply describes the model of book
supply chain operations. We need to analyze
whether the model is feasible to be used for
follow-up study.
Firstly, the logical relations whether can be
established. After the causal loop diagram of book
supply chain established, you can clearly
demonstrate the relationship among each variables.
From the major aspects of it is:
Figure 3: Logical relations.
Then the parameter validation test followed. In
general, the paper is based on previous studies
related to literature and specific cases, combined
with my own model characteristics, and can not
match the real-world supply chain system with
setting the parameters involved in some special
cases. In practice, before inputting a function need
considering we should have extreme conditions
tests. Extreme conditions tests are to test the
matching degree between the dynamic behaviors
the model showing and the real world in the case
of extreme conditions input. The main purpose is
to test the robustness of the model. Extreme
conditions tests of this paper are no needs test and
a constant step taking place needs test.
No need test is that the market demand is 0.In
this model, market capacity is 0. In this case,
because of demand-driven, the number of books
won’t change. When the demand is 0, there was
not any logistics activities happened in the model.
ICISO 2010 - International Conference on Informatics and Semiotics in Organisations
202
In the real world, order is generated by the end
customers’ demand .Only the actual demand
happen, retailers will order from their up nodes,
followed by wholesalers ordering from their up
nodes .Information flow will then pass, it will
bring distribution, sales and return phenomenon.
The simulation models in this paper is consistent
with the real-world systems behavior, that is, there
is no ordering, distribution, sales and returns
occur when demand is 0.
After analyzing the situation of the entire
supply chain are in a quiescent state, now we
analyze the situation of the market demand is a
constant in the beginning and occur a step change
after running for some time.
In this case, if the model is correct, the market
capacity change will cause differences in changes
in inventories, which led to the occurrence of
retailer order rate. Order rate associated with the
occurrence of market demand rate will cause an
increase in retail inventories, thereby increasing
the sale rate and narrowing the difference between
stocks. With the market saturated, the market
fulfill tends gradually to meet the market capacity,
inventory difference will be smaller, order rate
and sale rate will have a reduced trend. When
inventory differences disappeared the market will
saturate and order rate and sale rate will no longer
occur, reduce to 0.If the retailers have excess
inventory, they should be returned, so return rate
occur, and gradually reduced until it is 0 .
From the image we should be certain is that
the market capacity are two straight-lines which
occurred step change, the market fulfill and the
market capacity to meet the end-overlap, order
rate, sales rate and the return rate were not
simultaneously, retailers inventory is a first
increased and then decreased until to 0 curve.
This step function selected to test the function,
the market capacity = 1000 + STEP (500, 50),
before time of 50 the market capacity, that is,
market demand is a constant that is 1000, and in
time of 50 occurs a step to 1500 , the state
variable initial value is 0.
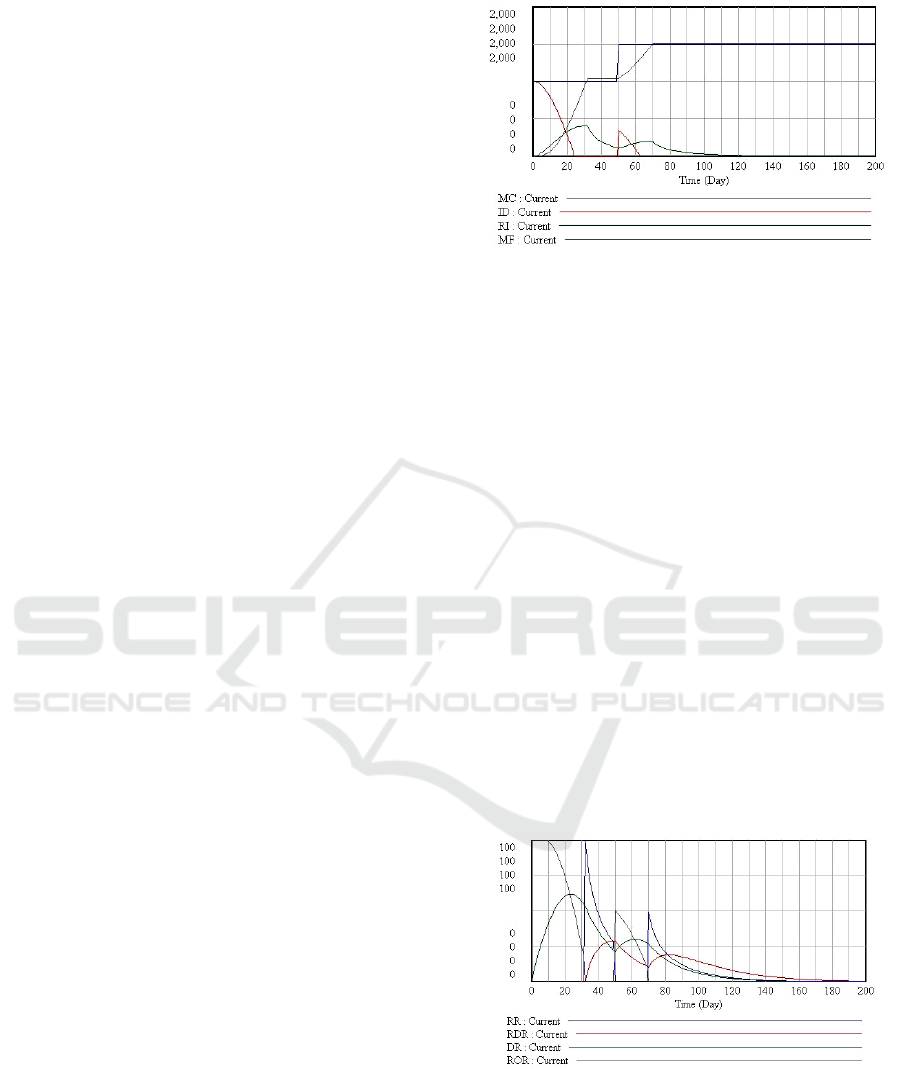
Figure 4: After step occurs the demand for inventory
differences and related variables variation.
From Figure 3 we can see, the market fulfill
becoming more and more to meet the market
capacity, and after a step change the phenomenon
happened again. Eventually the market fulfill
coincides with the market capacity, which
indicates the market has reached its saturation. At
the moment 0, the inventory difference is the
market capacity. With the occurrence of ordering,
retailers’ inventory is gradually increasing. The
amount of the market meet increased and
inventory differences gradually reduce until it is 0.
At the moment 50, due to a abrupt increase in
market capacity, inventory differences increased
again. Since retailers keep a certain stock at that
moment, inventory differences is smaller than the
market capacity. At the moment 70, the market
capacity is equal with the market fulfill, so no
longer for sale. The retailers begin to return
excess inventory, and retailers’ inventory down to
0.
Figure 5: After step occurs the rate variables variation.
From Figure 4 we can see, before the moment 50
and after it two almost identical curve models are
shown. The right one is smoother than the left one
and by the values expressing is also smaller. From
BOOK SUPPLY CHAIN MODEL BASED ON SYSTEM DYNAMICS
203

the moment 0, the order rate shows a decline
curve and the sales rate is a rising one, which
indicating sale rate kept rising, with the retailers
inventory increasing and inventory differences
reducing, the order rate is declining. At the
moment 30, the sale rate and the order rate are 0,
indicating a saturated market and no sales and
orders happened. At this time retailers maintained
excess inventory, so retailers begin to return and
return rate came to maximize. With this happened,
the reverse distribution rate is also beginning to
increase. With retailers inventory reduced due to
return, return rate gradually came to 0. At the
moment 50, due to increased market demand,
inventory differences inventory increased, the
order rate begun to reach max, return rate reduced
to 0. At this time reverse distribution was still at
work, so the reverse distribution rate only reduced
and would not immediately drop to 0. In the
process of the reverse distribution rate dropping to
0, return rate began at the moment 70.So the
reverse distribution rate began to increase again at
70, and then decreased with the return rates
reducing, until to 0.
The relationship among return rate, sale rate
and order rate Figure 4 shows is in line with
objective reality, indicating that the model
simulated the key aspects of reverse logistics that
is the logical relationship among return rate, sale
rate and order rate. The model is reasonable.
5 CONCLUSIONS
This paper build a book supply chain model using
system dynamics and simulate this model using
Vensim. Basically reflects the overall state of the
system. Through the parameters reasonableness test,
we can intuitively see a corresponding change of the
variable curves. We can analyze the simulation
results and explain the reasons for system behavior
whether essentially in line with the actual situation.
The book supply chain simulation system in
this paper provides multiple levels of abstraction,
coordinate a key part of the forward and reverse
supply chain, that is, when orders begin ,when
return begin ,when the implementation of return,
the ordering and sales must be turned off and the
implementation of orders and sales, the return
must be turned off. We can expand this base
model to create the entire book supply chain
simulation model. We can also build the supply
network involving multiple suppliers, vendors and
make optimum design based on the simulation
results. Finally we can apply to the operation
management of the supply chain, such as
inventory management, order processing,
transportation management and decision-making
design. System Dynamics provides a simulation
laboratory of future system activities and provide
a good method for simulating the system
development trends more accurately, expecting
future logistics cost and making policy.
REFERENCES
Chen, L & Lin, Q 2006, ‘Book Reverse Logistics Analysis
Based on The Book Supply Chain Sustainable
Development’, Journal of Northwestern University,
No 6. pp. 149-152.
Ding, WF 2009, ‘Book Reverse Logistics Measures Based
on The Supply Chain Management’,Journal of China
Publishing, No2. pp. 47-49.
Dobos.2003, ‘Optinal Production-inventory Strategies for
A HMMS-type Reverse Logistics System’,
International Journal of Production Economics, Vol.
81. No 2. pp. 351-360.
Li, X L 2005, ‘Sino-Japanese Publishing Industry Reverse
Logistics Comparison’, China Logistics and
Purchasing, Vol. 4. pp.66-68.
Liu, H Y & L v, Q X 2004, ‘Bullwhip Effect in Book
Supply Chain’, Journal of Published Wide-angle, No 4.
pp.30-31.
Mi, Z C & Miao, M Y 2003, ‘Waste Appliance Recycling
Reverse Logistics System Model’, Journal of Science
and Technology Progress and Policy, No10.
Tan, W F 2005, ‘An Analysis of The Reason of A Large
Number of Reverse Logistics Generate in China's
Publishing Industry and Optimization Program’,
Journal of Shopping Center Modernization, No13.
pp.6-8.
Wang, Q F 1988, System Dynamics, 1
st
ed. Tsinghua
University Press, Beijing.
Yang, J Z 2001, ‘Computer Books Return Causes and
Counter Measures to Reduce Returns’, Chinese
Reading, No 13.
ICISO 2010 - International Conference on Informatics and Semiotics in Organisations
204
