
RESEARCH ON THE ECOLOGICAL CORRELATION
ANALYSIS BETWEEN THE ENTERPRISES
IN THE LOGISTICS PARK
Honglu Liu
School of Traffic and Transportation, Beijing Jiaotong University, 100044 Beijing, P. R. China,
Xiaolan Guan, Zhenji Zhang
School of Economics and Management, Beijing Jiaotong University, 100044 Beijing, P. R. China,
Keywords: Logistics park, Correlation analysis, Ecosystem.
Abstract: This paper innovatively introduces the correlation analysis in the theory of ecosystem into the relationship
analysis between the enterprises in the logistics park and has opened up a new brand-path to describe the
complicated relationships between the enterprises. Through constructing a correlation analysis model, we
can measure the reasonability of the enterprises distribution and understand the enterprise's core business
and the integration of resources within the park more systematically and effectively, and also provide new
ideas and new methods to guide the building of ecological logistics park in the future.
1 INTRODUCTION
Recently, the Brocade IT Logistics Supply Chain
Management Research Center released the logistics
research report of the second quarter in 2009, in
which the statistical data of the logistics park are
striking. Compared with the same period of last year,
the construction rate of logistics park that has been
started increases by 14 percent, while the idle rate of
the logistics park has dropped to 60 percent
dramatically at the same time. The direct market
customers of the park or the other major enterprises
attracted to the park include the transportation
enterprises, logistics service providers and logistics-
intensive industrial and commercial enterprises.
These enterprises and entities can be divided into
eight categories, including logistics enterprises,
freight forwarding enterprises, commercial
enterprises, manufacturing enterprises,
transportation enterprises, courier enterprises, banks
and other service agencies and others. However,
from the perspective of the operation of our national
logistics parks, the largest proportion of the
enterprises settled down in the park is the logistics-
intensive commercial enterprises and it has reached
50 percent, while the proportions of other enterprises
that are closely related to the logistics, such as the
logistics enterprises, freight forwarding enterprises,
transportation enterprises, and courier enterprises are
relatively very small. The majority of main business
income of many logistics parks comes from the
following four aspects, including the warehouse and
yard rent, facilities rent and management fees,
property management fees and office building rent
Only a handful of logistics parks can make profit
from the value-added services, such as the logistics
information services, warehousing and distribution,
etc. Even more puzzling, there are a few logistics
park's profits come from the state funding, tax
incentives and land rent or sales after revaluation. In
short, the structure of China's logistics park system
is irrational, and there is no relationships between
the enterprises that only operate for their own
business, or loosely connected. And there is even
redundant construction, waste of resources, vicious
competition between the enterprises due to
homogenization, and other issues that obstruct the
sound development of the logistics park seriously.
In order to describe and analyze these issues
more effectively, this paper innovatively introduces
the correlation analysis in the theory of ecosystem
into the relationship analysis between the enterprises
193
Guan X., Liu H. and Zhang Z.
RESEARCH ON THE ECOLOGICAL CORRELATION ANALYSIS BETWEEN THE ENTERPRISES IN THE LOGISTICS PARK.
DOI: 10.5220/0003268201930198
In Proceedings of the Twelfth International Conference on Informatics and Semiotics in Organisations (ICISO 2010), page
ISBN: 978-989-8425-26-3
Copyright
c
2010 by SCITEPRESS – Science and Technology Publications, Lda. All rights reserved

in the logistics park based on the ecological
characteristics of the logistics park and uses the
mathematical method to measure the reasonality of
the enterprise distribution within the park
quantitatively and systematically, and thus to
understand the enterprise's core business and the
integration of resources more effectively.
2 ECOLOGICAL
CHARACTERISTICS OF THE
LOGISTICS PARK
The differences in the possession of resources on
core business between the enterprises and reasonable
convergence of business processes are the
foundation of stable development for the whole
logistics park. The differentiation of core business
between the enterprises is the prerequisite of the
stability of the park, since that there is often fierce
competition for resources after the introduction of
some enterprises with similar business, and also lead
to the exit and migration of some enterprises. At the
same time, the reasonable convergence of business
processes is the guarantee of coordinated operation
of the park, because that it requires the cooperation
of many enterprises and entities to fulfill a complete
logistics process, such as the various specific steps
from the entrance, warehousing, distribution,
delivery, out of the park to transport, as well as the
integration of services, power, policy, management
and other related facilities. As to these two aspects,
one is the vertical possession of resource, and the
other is the horizontal integration of information
flow, capital flow and logistics flow. They built up a
complex and stable operational system together.
We can find that there is a special similarity
between the logistics park and the ecological system
by comparison. For example, the difference of
resource possession for the enterprise is similar to
the difference of niche for the biology, and the
business process is similar to the food chain.
Therefore, we can consider the logistics park as an
ecosystem and consider every kind of enterprises in
the park as one kind of species in the ecosystem. For
example, the warehousing enterprises, transportation
enterprises, semi finished products processing
enterprises and service enterprises are all the species
in the system. The enterprises have to find their own
niche if they want to maintain stability and promote
their own development, otherwise there will be
vicious competition between the enterprises, which
just like the niche overlap between the species. We
have to build a reasonable food chain, or namely the
business cooperation process on the basis of suitable
niche, otherwise there would be the food chain
fracture and lead to the withdrawal of enterprises
and even the collapse of the whole system.
The ecological regions of the logistics park refer
to the three-dimensional location of time, space and
market and the functional position of the market.
The enterprise’s occupation to the niche can be
called the separation and coexistence relationship of
niche, that is to say, the noncompetitive relationship
between the enterprises for the resources on the
basis of proximity and separation of the enterprises’
niche, and all these different niche possessions of the
enterprises constitute the entire possession of
internal resources in the logistics park. In this paper,
this kind of extent and intensity for the possession of
such resources can be measured through the
correlation degree between the enterprises’ niches in
the park. Specifically, this paper considers all the
functions and services involved in the logistics park
as the total resources of the whole park, and every
enterprise within the park occupies a part of the total
resources. If the collection of all the enterprises’
possessions of resources equals to the total resources
of the park, then we can say that the system structure
of this logistics park is reasonable and efficient;
otherwise, according to the correlation analysis, we
can understand the ecology degree of the logistics
park more clearly and thus make adjustments to the
logistics park accordingly.
3 ECOLOGICAL CORRELATION
ANALYSIS MODEL
This paper constructs the correlation analysis model
between the enterprises within the logistics park
based on the theory of food chain among biological
communities in ecology.
3.1 Calculation Formula of Correlation
The biological communities’ correlation refers to the
measurement to the correlation between the species
in a biological community. It equals to the ratio of
the actual food chain number observed in the
communities’ food net to the largest food chain
number, shown as the following:
()
1
2
L
C
SS
=
−
(1)
ICISO 2010 - International Conference on Informatics and Semiotics in Organisations
194

Here, C refers to the correlation between the
biological communities, which is also the correlation
between the enterprises in the logistics park;
S
refers to the richness of species, which is also the
potential richness of the correlation between the
enterprises in the park, that is to say the saturated
state of the correlation;
L
refers to the actual
observed number of food chain contained in the food
net, which is also the real correlation between the
enterprises within the park.
The parameters of the ecological correlation
between the enterprises within the park can be
divided into the following categories:
1C = , shows that the correlation has reached
saturation, and this is also the ideal operation state of
the logistics park.
0.5 1C<<, shows that the correlation between
the enterprises within the park has reached a certain
rate, and this is also a good operation state of the
logistics park.
0.5C < , shows that there is a serious lack of
coordination in the possession and utilization of
resources between the enterprises in the internal
logistics park. There are relationships of overlap,
cross-ties and mutually inclusive between the
enterprises’ niches, and these relationships will
directly lead to unreasonable competition between
the enterprises in the logistics park. The business
was chaotic and this is the most unsatisfactory
operation state and need to improve.
3.2 Parameters Solving Method
In order to get the parameters in the above formula,
we can use a chart or matrix to demonstrate the
relationships between the enterprises. When there is
a small number of species and the relationships
between the enterprises are simple, we can draw the
connection diagram. In order to facilitate
understanding, we have adopted the chart for
analysis. Figure 1 explains the real biological
communities’ correlation between the enterprises in
the logistics park which is marked with solid lines,
while the dotted lines indicate the potential
correlation between all the enterprises within the
park.
Here, the connection between two points
indicates that there is complementary and
Figure 1: The correlation between the enterprises in the
logistics park.
interdependent relationship between the enterprises,
rather than competitive relationship. There is no
doubt that it is an ideal situation when there are
complementary relationships between the core
businesses of all the enterprises. It shows that there
is business relevance with others for every enterprise
in the park, and there is no competitive relationship
on the business. The species richness in Figure 1
is 6S
=
. The number ‘1’ in the matrix indicates that
there are complementary relationship between the
enterprises in the park; while if there is no
relationship between two enterprises, we will use the
number ‘0’. Thus, the food chain of this matrix for
Figure 1 is 6L
=
.
4 APPLICATIONS
4.1 Model Calculation
We take a logistics park that engaged in the
international goods trade to apply the model. In
order to simplify the calculation process, we
intercept a particular logistics process of certain
goods exports to carry out the application. There are
six entities in this process (including the enterprises
and administrative departments), and the specific
process is as follows: the foreign trade enterprise
d
purchase a batch of merchandise for export sales
from the manufacturing enterprise
a , and it also
contacts with the warehousing enterprise
b to
provide it storage and short-distance transport
services, and
b and d have to go to the
administrative department
f
to deal with the
relevant export procedures. The manufacturing
enterprise
a has to contact with the deep-processing
enterprise
e to segment and package the goods
RESEARCH ON THE ECOLOGICAL CORRELATION ANALYSIS BETWEEN THE ENTERPRISES IN THE
LOGISTICS PARK
195

before export, and then transfer to the ocean
shipping enterprise
c that engaged in the
international goods transport and take goods from
the warehouse of warehousing enterprise
b and
complete the entire process that the goods in the
logistics park.
We use different letters , , , , ,
abcde fto represent
all the enterprises with different core business, and
then draw the diagram shown as Figure 2.
It is inconvenient to demonstrate with diagrams
when there are too many enterprise species in the
park, and then we can use the matrix, shown as
Figure 3. The top of the matrix indicates the
enterprises that need the service resources, and the
left of the matrix indicates the enterprises that
provide the service resources. The richness of the
enterprise species in this application is 6
S
=
. The
number ‘1’ in the matrix indicates that there are
complementary relationship between the enterprises
in the park; while if there is no relationship between
two enterprises, we use the number ‘0’. Thus, for
this application, the food chain of this matrix
is 7
L = .
Figure 2(a)
Figure 2(b)
Figure 2: The real correlation and the potential correlation.
−
−
−
−
−
−
01110
00001
10011
10010
10110
01100
f
e
d
c
b
a
fedcbaA
Figure 3: The correlation matrix between the enterprises in
the logistics park.
The potential correlation within the logistics park
is
(
)
(
)
1661
15
22
SS−−
=
=
. Take 7L = and
6S
=
into (1) and then we can get the ecological
correlation between the enterprises of this logistics
park.
() ()
7
0.47
1661
22
L
C
SS
==≈
−−
4.2 Result Analysis
According to the result 0.47C
≈
, we can consider
that the correlation between the enterprises in this
logistics park is relatively very weak. From the
perspective of Figure 2, the enterprise e in this park
is the weakest one, which has only one business
relationship with enterprise a . That is to say, it can
only provide services for enterprise a in the whole
park and this is unreasonable for the ecological
logistics park. On the one hand, the enterprise e has
to provide service for enterprise a , but also only this
one enterprise; on the other hand, the resources of
enterprise e are not fully utilized, while the other
enterprises don’t need the service of enterprise e or
to provide it services. So the enterprise e has to find
a way out and exit the park to develop and pursue
other interests, or to engage in other completely
irrelevant business in order to seek to survive, but
this will inevitably lead to the food chain fracture the
of the logistics park. There is only operational
complementary relationship between the enterprise
a and
c
with the other two enterprises, while the
enterprise b , d and
f
also have only achieved
operational complementary relationships with the
other three enterprises. This kind of network
relationships with mutually use of resources or the
complementary relationships between the enterprises
business is still very inadequate.
ICISO 2010 - International Conference on Informatics and Semiotics in Organisations
196
Here, we consider the relationship between the
enterprise a and e as the relationship between two
different niches. That is to say, their businesses are
not overlapping in this logistics park, and there is a
collection of niche space due to the logistics in this
ecological logistics park. Both of from the enterprise
a to e and from the enterprise e to a are the
possessions of different niches. We can assume that
the total number of niche correlation in this logistics
park is
*6 30NS==
based on Figure 2 (equal to
the number of species in the park multiply with the
total number of connections with the other enterprise
species). From Figure 2, we can get the specific
niche correlation that has been used in the logistics
park, which is represented as
M
. So there are
2*7 14
M ==
niche correlations. The number of
specific ecological niche correlation of Figure 2 is
shown as Table 1.
According to Table 1, we can calculate the
occupation rate of the internal enterprises to the
niche in the logistics park, and this rate equals to the
real niche correlation occupied by the enterprise
species to the total correlation under the saturated
state. They are shown as the following.
230 0.067a =≈
;
330 0.1b ==
;
230 0.067c =≈
;
330 0.1d ==
;
130 0.033e =≈
;
330 0.1f ==
The total rate is just 0.47
C ≈ .
Table 1: The distribution of the enterprise niche
correlation within the logistics park.
Enterprises
a
b
c
d
e
f
Number
Real enterprise niche
correlation in practice
(
M
)
2 3 2 3 1 3 14
Ideal enterprise niche
correlation under the
saturated state (
N )
5 5 5 5 5 5 30
a
b
c
d
e
f
others
a
b
c
d
e
f
others
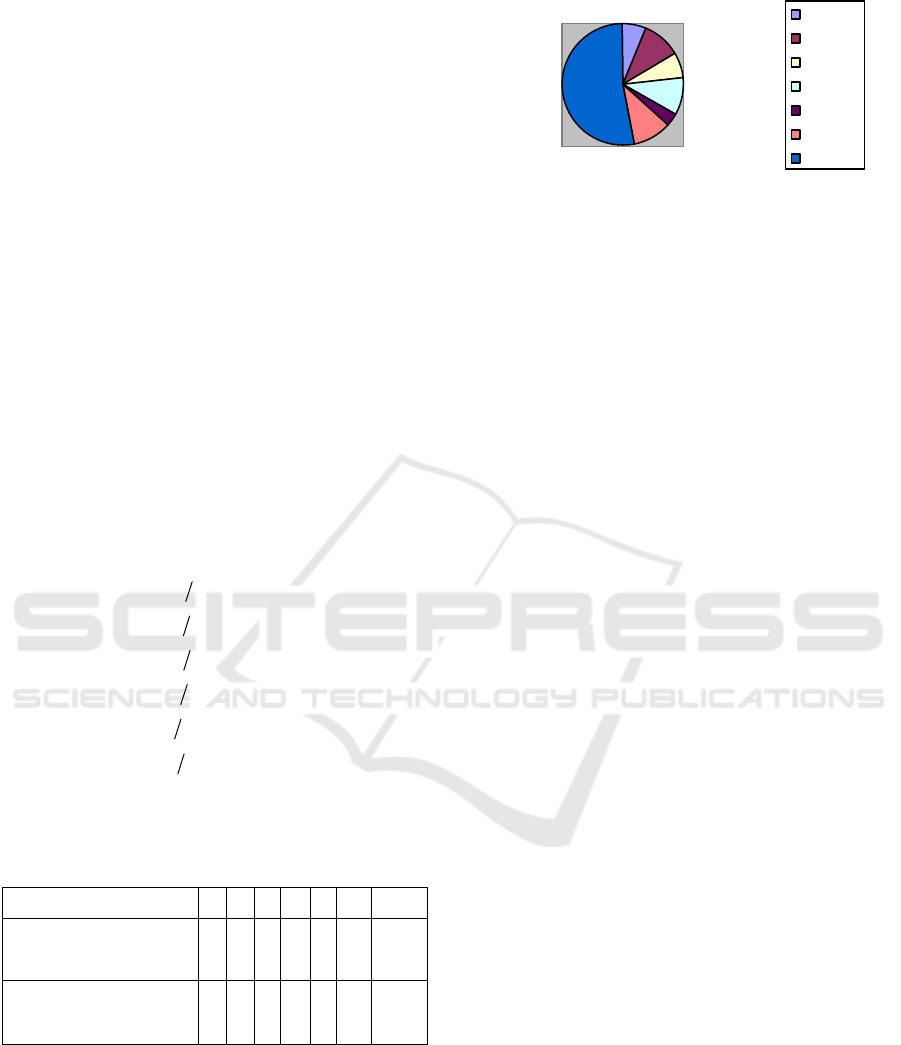
Figure 4: The pie chart of the enterprise niche occupation
within the logistics park.
In order to facilitate understanding, we use a pie
chart to demonstrate the distribution proportion of
the enterprise species in this logistics park and the
niche resources that they occupied, shown as Figure
4.
In Figure 4, the region of ‘others’ indicates that
there are niches that have not been occupied and
used by the enterprises in this logistics park, and the
park has to borrow related businesses and functions
from other areas to cover this vacancy of core
business. However, it will result in two
disadvantages in this way. On the one hand, it will
affect the realization of economic effects in the park
because of its own imperfect core business within
the park and has to use other non-park enterprises to
compensate for this part of the vacancies. On the
other hand, it will also result in waste of resources
due to the inefficient utilization of the facilities and
equipments within the park. It is clear that the
vacancy rate of this park is very serious, and the
degree of ecology is not enough. There is still a long
way to meet the requirements of ecological logistics
park through the analysis.
According to the correlation analysis and
combined with Figure 4, we can draw such a
conclusion that there are the following five issues in
this logistics park:
(1) It lacks of complementarities between the
enterprises within the park and there is not a
reasonable planning to introduce enterprises into the
park.
(2) The efficiency of the resource utilization is
not high, and there is the phenomenon of resource
idle and waste.
(3) The ecology degree of this park is not enough,
and it has not realized the real sense of core business
integration between the logistics-related enterprises.
(4) There are enterprises whose core business is
not logistics-related, such as some commercial
enterprises.
The existence of these irrational issues affects
the normal business dealings directly within the
logistics park and often results in some unnecessary
RESEARCH ON THE ECOLOGICAL CORRELATION ANALYSIS BETWEEN THE ENTERPRISES IN THE
LOGISTICS PARK
197

phenomenon, such as the operation confusion,
disordered competition and so on, and thus lost the
original purpose of building the logistics park, as
well as the role to promote the development of the
logistics industry that it should take on and play.
5 CONCLUSIONS
This paper introduces the correlation analysis in the
theory of ecosystem into the relationship analysis
between the enterprises in the logistics park
innovatively and has opened up a new brand-path to
describe the complicated relationships between the
enterprises. It measures the enterprise correlation
quantitatively through constructing the correlation
analysis model and targets specific issues in the park.
However, since this method is constructed based on
some simplified assumptions and it just uses the
binary parameters to describe the relationships
between the enterprises, we can make the parameters
more complicated in the future research in order to
describe the logistics park more realistically.
ACKNOWLEDGEMENTS
This work is partially supported by the Philosophy
and Social Science Funds of Beijing
(No.09BeZH128) and the Science and Technology
Innovation Funds of Beijing Jiaotong University for
outstanding Ph.Ds (No.141101522).
REFERENCES
China market intelligence center, 2009. The logistics
research report of the second quarter in 2009.
Shixiang Liang, Yan Wang, Weiwen Shen, 2007. Niche
analysis and collaborative mode selection of the
enterprises settled in the logistics park
[J].Transportation Enterprise Management. No.8,
pp54-55. (in Chinese)
Yuan Shi, 2009. Analysis on the strategy positioning of the
logistics park based on SWOT [J]. Economic
Research Guide. No.8, Serial No.46, pp 88-89. (in
Chinese)
Chunyan Liang, 2009. A Study of Operational M ode in
Ecological Logistics Park [J]. Journal of Lanzhou
Commercial College. Vol.25, No.4, Aug. pp 79-85.
(in Chinese)
Chunxun Xie, Zhong Wu, Benhong Peng, Sep.2006.
Research on the partnership model of the third-party
logistics based on the niche theory [J]. Market
Modernization. Serial No.478, pp 104-106. (in
Chinese)
Sha Qu, Jingfang Wang, Hao Zhou, Bingduo Li, Jan. 2009.
Analysis on the Connectance on Symbiotic Web of
Eco-industrial Park [J]. Science & Technology
Progress and Policy. Vol.26, No.2, pp 41-44. (in
Chinese)
ICISO 2010 - International Conference on Informatics and Semiotics in Organisations
198
