
TOWARDS AN INITIAL SEMIOTIC VIEW
OF THE INTERACTIVE GRAPHIC ORGANISER
Mario J. Lopez and Hector R. Ponce
VirtuaLab, University of Santiago of Chile, Av. L B O’Higgins 3363, Santiago, Chile
Keywords: Interactive graphic organiser, Semiotics, Visual learning strategy, Cognitive skill, Software component.
Abstract: This paper presents a first approach to understand a visual software application, named Interactive Graphic
Organiser (IGO), from a semiotic point of view. The paper begins with the original conceptual background
review, which came from both component software engineering and visual learning. The paper then moves to
describe the technology and its impacts; the visual technology developed are IGOs, that allows cognitive
skills development, and IGO based applications. Next and under the working hypothesis that the use of
graphic organisers significantly improved involved cognitive skills, the paper describes some results from
experimental research conducted to measure some of the visual technology’s impacts. The paper concludes
that, although initial treatment cannot claim to be comprehensive, it does provide a conceptual view and
provides insight into the practices of those involved around IGOs and their applications.
1 INTRODUCTION
The core visual technology analysed in this paper is
the Interactive Graphic Organiser (IGO) (Ponce, et
al., 2008). This is a software application that
combines non-linguist representations (shapes,
symbols and arrows) with linguist elements (words
and phrases) and a series of basic functions, which
allows interactivity. IGOs so far have educational
and business uses. In education, IGOs support the
development and practice of cognitive skills for
reading comprehension and writing (text production).
In business, IGOs support the development and
practice of higher order cognitive skills involved in
business planning and strategy execution. Each IGO
points to one specific cognitive skill. Combined
IGOs make up larger applications for specific
purposes.
This paper describes the conceptual background
for the visual technology: component software
engineering and visual learning. Next, it describes
the visual technology as well as e-PELS, one of the
larger applications built up with IGOs. The paper
then presents some results of the technology impact
on users. After that, the paper attempts to provide a
first approach to look at the IGOs from the semiotic
viewpoint. Finally, it presents a couple of remarks as
a way of conclusions.
2 BACKGROUND
IGO’s conceptual background comes from two
sources, one from the ICT area (component software
engineering) and the other from the educational area
(visual learning).
2.1 Component Software Engineering
Interactive Graphic Organisers as a technology is
based on software components. A number of
components constitute each organiser and the
integration of IGO components generates software
applications with more functionality. A software
component is a set of objects that carry out a specific
function, specify interfaces and work independently
from each other. Software components may include
other components to make up more complex
software systems (Laitkorpi and Jaaksi, 1999; Broy,
et al., 1998). Software components major
characteristics include composition (components
integration to form larger granularity components);
encapsulation (component works as a ‘black box’);
interoperability (components work independently
and interact with other components); multi platform
(components work independently from hardware and
operating system); and self-contained (components
125
Lopez M. and Ponce H.
TOWARDS AN INITIAL SEMIOTIC VIEW OF THE INTERACTIVE GRAPHIC ORGANISER.
DOI: 10.5220/0003269001250132
In Proceedings of the Twelfth International Conference on Informatics and Semiotics in Organisations (ICISO 2010), page
ISBN: 978-989-8425-26-3
Copyright
c
2010 by SCITEPRESS – Science and Technology Publications, Lda. All rights reserved

do not depend from other components to achieve
their functions) (Crnkovic and Larsonn 2002).
A software component construction essential
aspect is the interface among components. The
interface is the communication mechanism between
two components, which allows interoperability. A
software component has a ‘provide interface’ that
declares the services provided and a ‘require
interface’ that declares the required services to
operate correctly. Another important aspect is
software components composition that allows
interconnecting components through their interfaces.
There are three types of component composition:
sequential (when an adapter is required to connect
two incompatible components); hierarchical (when a
component executes a service required by a
compatible component); and additive (when two or
more components make up a component of greater
granularity) (Hall, 2007). The composition process
is a class of client-server process. The client
component requires a service offered by the server
component interface. In its turn, the server
component executes the required function and
returns its results to the client.
2.2 Visual Learning
Visual learning takes into account that an important
set of learning strategies requires mental
representations that result in visual schemes for their
understanding. For example, there are simple
learning techniques paragraph underlining and
margin notes, and other techniques that require
complex cognitive processes, such as conceptual
mapping.
The advantages of introducing strategies that
require visual representation are diverse and based
on the fact that about 80% of perceived information
comes through the visual channel. A visual learning
principle is that students, using visual tools, can
clarify their thinking, enhance their understanding,
integrate new knowledge and, additionally, identify
misconceptions (Gardner, 2003). A visual scheme
allows students to discover and design patterns,
interrelation-ships and interdependencies, and
provide opportunities to develop creative thinking
(Lopez, et al., 2007). For example, through a
differences and similarities diagram, students have a
visual strategy that allows them to identify
similarities and differences between two or more
objects (Witherell and McMackin, 2005). This
technique facilitates reading skills, develops
diagramming abilities, and synthesis through
structured analysis registration of similarities and
differences. Graphic organisers are typical
representatives of visual learning. Graphic
organisers encourage the development of structured
activities; help to display content in a graphical form,
and support the development of cognitive skills
(Marzano, et al., 2001).
Graphic organisers, when use as thinking tools,
facilitate the development of students’ deep learning,
discouraging a memory based or repetitive learning
(Ausubel, 1963). Graphic organisers help to build
substantive and non-arbitrary relationships between
what it is already known and what it is to be learnt
(Coll, 1991). Thus, a learning process is activated
where new understandings take place by providing
and generating meaningful experiences for learners.
(Entwistle, 1981; Gibbs, 1999). Three requisites are
required to accomplish this task. First, content
logical significance; that is, content structure should
facilitate how learners build relations between new
and their previous knowledge. Second,
psychological significance of content; related to the
internal representation made by learners of logical
significant of content. Third, learners’ favourable
attitude given by the disposition to substantively,
profoundly and no literally relate their cognitive
structure with the new material (Gibbs, 1999). The
development of deep learning through the use of
graphic organisers in educational environments
depends upon the mediation between didactic
(methods and strategies) and learning outcomes
(Lopez and Ponce 2004). This requires a rigorous
and systematic teaching and learning planning,
including content and aims characteristics, learner
starting level, methods, didactic sequences, and
learning strategies to facilitate deep meaning of
contents and activities. Basic cognitive operations
such as observation, comparison, classification,
analysis and synthesis are better developed when
learning activities consciously put emphasis on their
need to process content and create new knowledge
(Amestoy, 2002).
Learning is a process in which “people generate
from their experience the concepts, rules and
principles that guide their behaviour in new
situation” (Kolb, et al., 1991). Learning takes place
through a continuous and recurrent sequence of
actual experiences and, as experiences by
themselves are insufficient, thought, observation,
and abstract concept construction go along with
experiences. Thus, it is suggested that an effective
implementation of graphic organisers should follow
the experiential learning process: (1) Concrete
experiences followed by (2) observation and
reflection of such experiences, which leads to the (3)
ICISO 2010 - International Conference on Informatics and Semiotics in Organisations
126
formation of abstract concepts and the constructions
of principles or generalisations, followed by (4) the
testing of such concepts in new situations.
3 VISUAL TECHNOLOGY
The following is a brief description of IGO and a
software application developed using software
components such as the IGOs.
3.1 Interactive Graphic Organisers
Interactive Graphic Organisers facilitate the
discovery and design of patterns, relationships, and
interrelationships, as well as helping to develop
creative thinking. IGOs educational uses include (a)
content visual presentation on its own (Ponce, et al.,
2008) or as an add-in for PowerPoint (Lopez, et al.,
2008). (b) Development of students’ learning
activities for either class work or homework. (c)
Reading understanding allowing the reader-learner
to make sense or meaning, before, during and after
reading. (d) Writing producing allowing the
writer-learner to order ideas before writing,
paraphrase, write short tales and so on. IGOs
business uses include (a) content visual presentation
on its own or as an add-in for PowerPoint. (b)
Developing companies’ strategic plans. (c) Linking
strategies to operations.
Each organiser has functionalities in a tool bar to
create, edit, remove, store, retrieve and print what
the user is developing or has completed. IGOs are
highly interactive through adding and editing the
graphic forms. The graphic organisers’ features
grant them a high degree of interactivity, allowing
cognitive skills development and practice, as shown
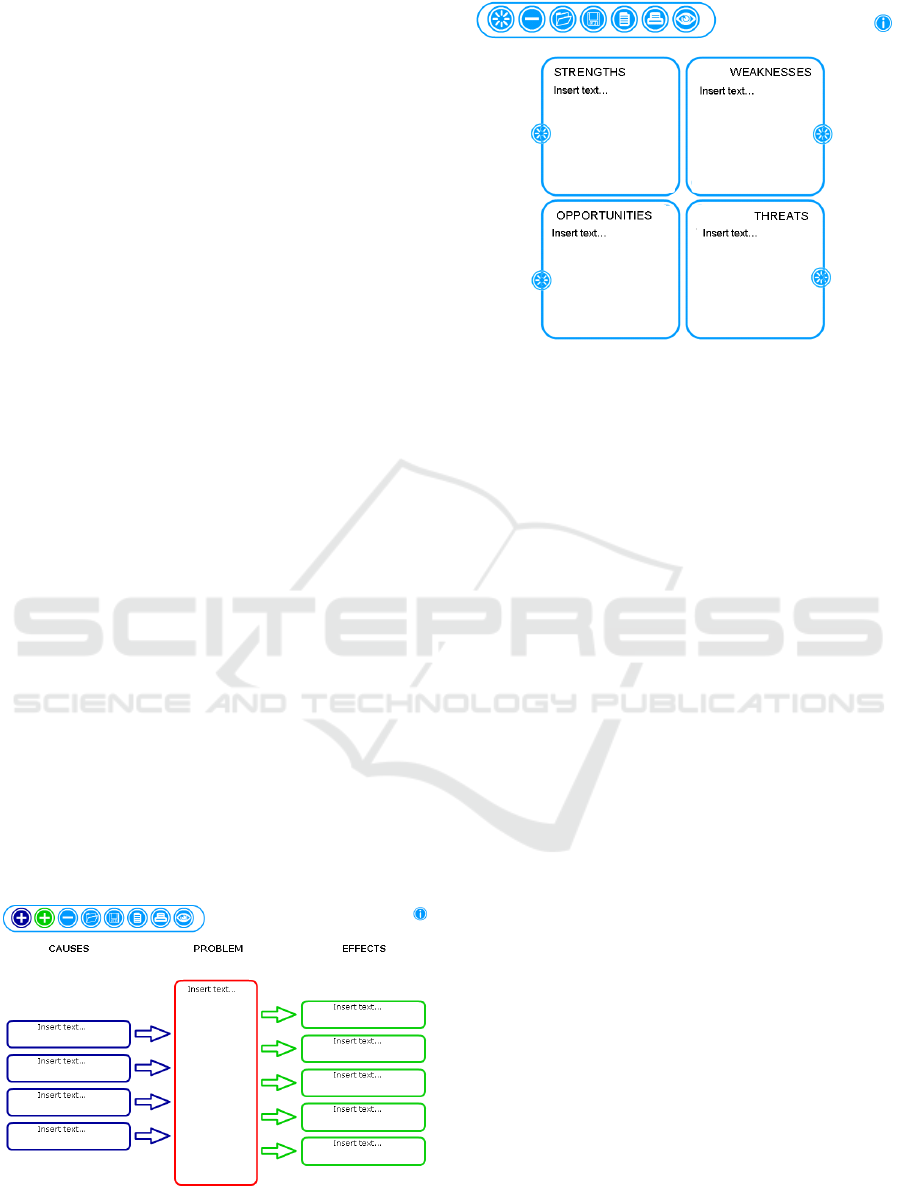
in Figures 1 and 2.
Figure 1: IGO Cause and Effect.
Figure 2: IGO Swot.
3.2 Software Tools
Interactive Graphic Organisers are software
components technology implemented in Adobe
Flash (Sametinger, 1997, Gallardo, et al., 2009).
This allows easy integration with other components
and into Web environments and Flash compatible
software. The application to describe is the
component software (Szyperski 1998) virtual
training programme in comprehensive reading
(e-PELS, from its acronym in Spanish) (Ponce, et al.,
2007a and 2007b). e-PELS design and development
followed Roman (2004) and Roman and Gallegos
(1994), who proposed a training programme in
comprehensive reading based on a set of cognitive
and meta-cognitive skills.
The basic cognitive processes identified are (1)
information acquisition strategies, (2) information
coding strategies, (3) information retrieval strategies,
and (4) information processing support strategies. In
his original proposal, Roman suggested the following
strategies: underlining, paraphrasing, self-
questioning, text structure and conceptual maps. The
programme e-PELS expanded conceptual mapping to
the use of interactive graphic organisers and added
strategies for summarising and word meaning.
For the acquisition strategies, e-PELS includes
underlining or colouring, to stand out relevant words
or phrases, and paraphrasing, to allow students their
own wording of texts. For the coding strategies,
e-PELS incorporates the text structure strategy
(problem solving, cause-effect, descriptive,
comparison and time sequence), self questioning to
relate and think about the text, and interactive graphic
organisers for the organisation of ideas or arguments
within the source text. For the retrieval strategy,
e-PELS incorporates the summary for synthesising
TOWARDS AN INITIAL SEMIOTIC VIEW OF THE INTERACTIVE GRAPHIC ORGANISER
127
the text. For the word meaning strategy, e-PELS
includes the word box. e-PELS also includes other
functionalities that are typical to this sort of software:
new, open, save. As e-PELS is software component
based, integration into other applications (flash or
Web) is rather easy.
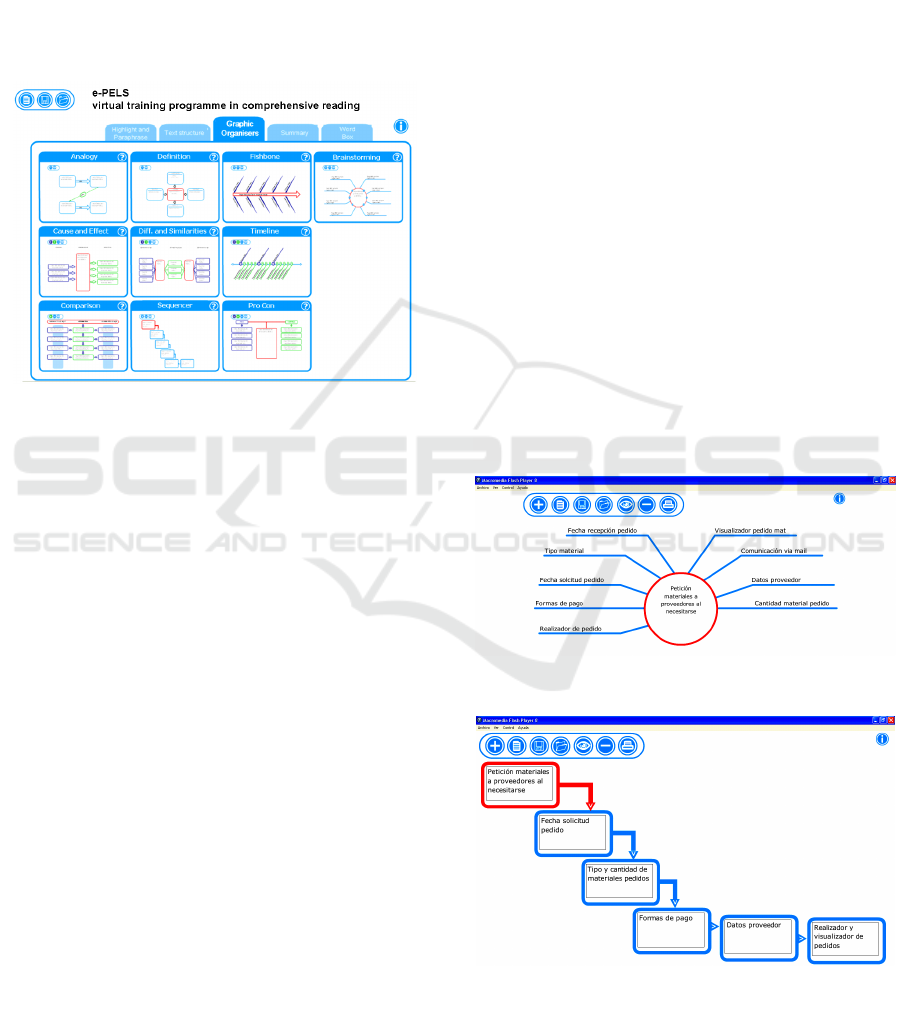
Figure 3 is an image of e-PELS in use. Each of the
strategies is accessible from a tab: Highlight and
paraphrase; text structure; graphic organisers,
summary and word box.
Figure 3: e-PELS in use.
4 TECHNOLOGY IMPACTS
With the hypothesis that use of IGOs and e-PELS
would have a positive effect on users, research
designs followed the cuasi-experimental model, with
control and experimental groups. IGOs evaluation
was with a higher education group of students and
e-PELS evaluation was with 18 primary schools.
4.1 IGOs Impacts
The research was into an information systems design
course, which belongs to the seventh level (out of
twelve) of the Civil Industrial Engineering degree at
the University of Santiago, Chile (Lopez, et al.,
2009). 45 students, organised into 14 teams, on the
course during a first university term constituted the
experimental group. 35 students, organised into 9
teams, on the same course but taken on the previous
university term constituted the control group.
Therefore, different students constituted the
experimental and control groups.
The experimental group participated in learning
activities that integrated the IGO software. The
experimental group used five IGOs in four different
learning activities. Typically, learning activities
included learning outcome identification; activity’s
name and brief description; IGO(s) to be used (if
appropriate), and systematic instructions for
producing digital and physical evidence. The
previous term, the control group did not use any
IGOs to carry out the same learning activities.
The following is an example of the experiences
with IGOs carried out by the students in the
experimental group. In this example, the
experimental (14 teams) and control (9 teams)
groups were assessed for their ability to design
logical components of their computer application
prototype. Both groups had to design the logical
components of an information system prototype. The
experimental group made use of two Interactive
Graphic Organisers for the assignment, while the
control group did not use any graphic organisers.
The control group design ended to be both very
intuitive and software applications disorderly listed.
The experimental group had support from two
Interactive Graphic Organisers. Initially from the
Brainstorming IGO, this enabled them to list all
necessary components that their prototype should
have included. The complete list was then analysed,
prioritized, and entered into the Sequencer IGO.
Figure 4 shows the structure of the Interactive
Graphic Organisers Brainstorming and figure 5 the
IGO Sequencer.
Figure 4: IGO Brainstorming.
Figure 5: IGO Sequencer.
Equivalent assessment marks for experimental
and control groups were compared through t-test
ICISO 2010 - International Conference on Informatics and Semiotics in Organisations
128
(when data was normally distributed) or U test
(when data was not normally distributed). The data
showed that the teams use of the Brainstorming and
Sequencer IGOs had a significant impact for
producing a programme pseudo coding (U = 34.5,
p-value = .037, and α = .05).
Qualitative data on students’ perceptions of IGO
uses showed that their most valued aspects were: (1)
structural thinking and (2) keep focus on what
matters. Regarding the first, students indicated that
IGOs use helped them to not only think but also, and
more importantly, to think more structurally, think
with more sense, organise ideas more easily and
synthesise more rapidly. Regarding the second,
students considered that using the IGO software
allowed them keeping focus on what mattered to the
course: solve an information problem through an
information system design and prototype.
4.2 e-PELS Impacts
The following analysis comes from an experimental
evaluation of e-PELS with 4th grade elementary
students (Ponce, et al., to be published). It will be
shown how the different visual learning strategies
included in e-PELS were articulated to support a
meaning construction process. This was carried out
through a training programme that lasted 11 sessions
of two-hours each for two months at the school’s
computer lab. Some examples are shown and the
performance of the students on each strategy
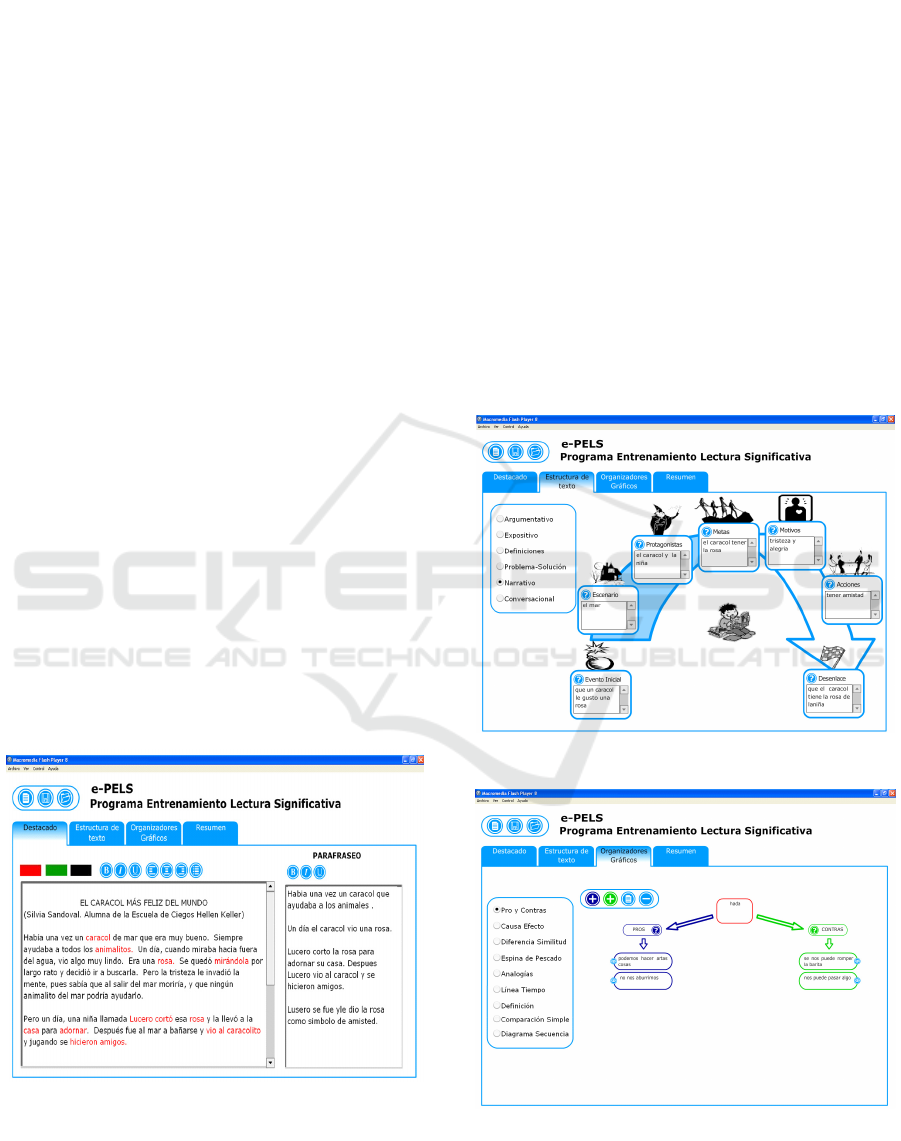
included in e-PELS. The following figures show a
typical use of highlighting and paraphrasing
strategies for the students in the experimental group.
Figure 6: Highlighting and paraphrasing.
The evidence demonstrated that at the beginning
of the training programme, students in the
experimental group did not know how to use the
highlighting strategy; they were not able to
differentiate main ideas for a later understanding of
the text. By the seventh training session, most
students identified keys words or phrases, without
highlighting extensively. Regarding the paraphrasing
strategy, the evaluation of the evidence
demonstrated that at the end of the training process,
the synthesis as a thinking skill was not completed
developed in these students. However, they replaced
it by constructing phrases that correctly articulate the
elements of the source text. Student’s ability to
articulate more significant phrases increased as the
sessions went by. The paraphrasing, initially seen as
an end, it was soon transformed into a skill to
produce small pieces of text increasingly
personalized and significant.
Figures 7 and 8 show an exemplary use of text
structure strategy and interactive graphic organiser,
respectively.
Figure 7: Use of text structure and self-questioning.
Figure 8: Use interactive graphic organiser.
For the use of text and self-questioning, the
evidence shows that students increasingly
TOWARDS AN INITIAL SEMIOTIC VIEW OF THE INTERACTIVE GRAPHIC ORGANISER
129
understood the explicit text elements. At the
beginning of the training process, students showed a
superficial comprehension of the reading challenges
present in their training. As the students continued in
their training, they were able to explore, process,
repeat and maintain the reading’s original sense.
Text structure and self-questioning evolved from a
level of recognition up to a level of integration and
coherence. For the use of the graphical organisation
strategy, the evidence showed that students use was
easy. The diagrammatic representation of basic
cognitive skills facilitated its development,
particularly those related to skills such as
comparison, analogy, identifying pros and cons and
sequences. To work with this strategy, students
processed the source text using the previous
strategies included in e-PELS, so graphic organisers
were used to identify specific aspects of the text that
require analysis. For example, differences and
similarities between characters in a tale, analogies
between known things by the students and new
elements discovered in the text, causes and effects of
problems stated in the source text, among others.
Quantitative data showed that 757 pupils in 27
classes form the experimental group took the pre and
post tests (PLC forms A and B respectively). 85
pupils in 3 classes from the control group took the
same pre and post tests. 24 out of the 27 classes in
the experimental group showed an increase their
reading understanding level in the posttest as
compared with their level in the pretest. Two of the
three classes in the control group slightly decreased
their reading understanding level; the third had a
small increase. A cluster analysis, for the pretest,
determined that classes fell into three types, two of
which had control groups. Therefore, significance
and effect sizes comparison are possible within these
two cluster types. 12 classes in the experimental
group had significant increase in reading
understanding in comparison to the control group.
Effect sizes, measured with a d Cohen Coefficient,
were up to 0.7 standard deviations, which is a
medium, though relevant, size effect.
5 TOWARDS A SEMIOTIC VIEW
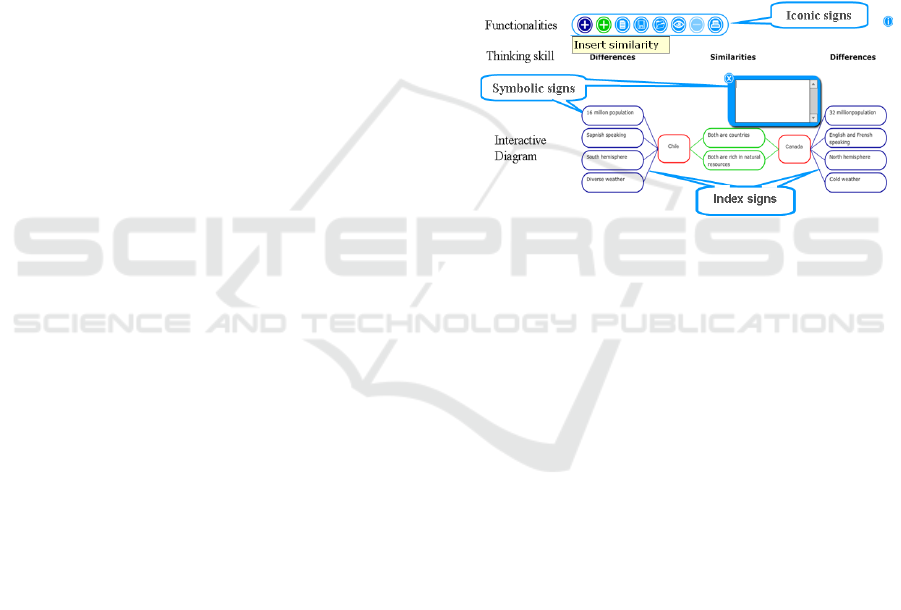
The definition of Interactive Graphic Organiser as a
combination of non-linguist representations (shapes,
symbols and arrows) with linguist elements (words
and phrases) means that IGO is full of signs.
Although categories are not exclusive, IGOs
incorporate Peirce’s classic distinction between
iconic, indexical and symbolic signs (de Souza
2005). There are iconic signs, which resembles
something, in the form of links pointing to IGOs
functionalities. As a sign is not iconic until the
interpreter recognises it as such, if the cursor is on
the sign, a micro help message comes into view.
There are indexical signs, which indicate
something, in the form of connectors to facilitate
relations. As a sign is not an index until the
interpreter recognises as such, when adding a new
shape, the relationship, because it is pre drawn,
appears simultaneously with the shape.
There are symbolic signs, which arbitrarily
represent something, in the form of text boxes to
enter conventional words or phrases, since words are
examples of symbolic sign. Figure 9 describes IGO
structure and its signs.
Figure 9: IGO structure and its signs.
e-PELS and other software tools built up with
IGOs software components inherit the analysis as
arrangements of diverse sign types.
One of IGOs major features is their high
interactivity; users have to be active and
participative to complete with words and phrases to
obtain meaningful diagrams. The conceptual
framework Semiotic Engineering (de Souza 2005),
describes IGOs since it is a semiotic theory of
human–computer interaction, where interactive
computer systems allow messages flow from
designers to users.
Educational uses of IGOs include (a) content
visual presentation; (b) students’ learning activities
development for either class work or homework; and
(c) reading comprehension and text production. In
these cases, instructors and students engage in
teaching/learning activities. Business uses of IGOs
include (a) content visual presentation for
developing companies’ strategic plans and (b)
linking strategies to operations. In these cases,
managers and employees engage in activities for
planning/executing strategies. All these cases can be
explained through semiotic mediation (Hull and
Saxon 2009); that is, the mediation of something by
someone to someone else by means of the modality
ICISO 2010 - International Conference on Informatics and Semiotics in Organisations
130

of language. Semiotic mediation is practical to
understand the engaged activities of instructors and
students and that of managers and employee when
they use interactive graphic organisers.
Information Systems also help to analyse IGOs
and e-PELS. One angle to describe information
systems is through a six fields ladder: physical
world, empirics, syntax, semantics, pragmatics, and
social world (Stamper, et al., 2000). This
Semiotic perspective not only offers a deeper
understanding about IGOs and e-PELS, but also
about their milieu, ranging from technology to social
issues. For example, for e-PELS, the physical field
or level includes school classroom and computer
laboratory hardware, settings, budget and properties.
The empiric level comprises different existing
technological capacity, communication channel. The
syntactic level considers IGOs diagrams’ formal
structure, language and logic; associated software
and files. Semantics consider IGOs user’s meanings
and significations. Pragmatics includes IGOs
diagrams purpose (development of cognitive skills)
and participants’ interactions and negotiations. The
social world comprises participants’ commitments,
teaching and learning or managerial styles
approaches and ICT use abilities.
One of the starting points for this paper was to
seek for a conceptual viewpoint that united the
initial separated learning and technological
backgrounds. An interesting approach that looks
simultaneously at learning and use of technology is
Social Semiotics (Skaar 2009), which describes the
connections between learning and the use of
technology. First, learning is seen as taking place
through the semiotic work performed with created
signs and texts. Second, digital technology
establishes new premises for learning through the
meaning-creating process.
Semiotics assumes that sign-systems play a
major part in the construction of social reality and
that reality connect closely with sign-systems in
which they are experienced (Chandler 2007). From
this point of view, the visual technology described
here, or rather, the sign-system sought to play a role
in the construction of social reality. That is, at least
in Chile, on the one hand, children, through
educational use of IGOs, having a better reading
understanding and writing producing and, on the
other hand, small and medium size company
managers, through business use of IGOS, having
better planning and executing of their strategies.
6 CONCLUSIONS
As stated in the Introduction, this paper attempted to
provide a first approach to look at the IGOs from the
semiotic viewpoint. As Semiotics is a huge field, this
initial treatment cannot claim to be comprehensive.
However, within the range of this short analysis, it
does give a unified conceptual view and provides
insight into the practices of those involved around
IGOs and their applications.
This paper not only described the sign-systems,
or visual technologies, but also showed that they had
an impact on, or stood for something to, their users.
According to Semiotics, the IGOs sign-systems for
developing cognitive skills consist of pre drawn
diagrams (the representamen); users interacting with
the diagrams (the object) and the idea that IGOs
repeated and systematic use produce cognitive
automaticity (the interpretant).
ACKNOWLEDGEMENTS
The authors are grateful to FONDEF (Chilean
Research and Development Agency) for financing
the development of IGOs through project
TE04i1005; to the Teaching Division, University of
Santiago for financing the IGO evaluation; and to
Enlaces (Chilean Ministry of Education
Technological Agency) for financing e-PELS
evaluation through project 2356/08.
REFERENCES
Amestoy, M. 2002. La investigación sobre el desarrollo y
la enseñanza de las habilidades de pensamiento.
Revista Electrónica de Investigación Educativa. Vol. 4
1), 129-159.
Ausubel, D. 1963. The Psychology of Meaningful Verbal
Learning. Nueva York: Grune and Stratton.
Broy M., Deimel A., Henn J., Koskimies K., Plasil F.,
Pomberger G., Pree W., Stal M. & Szyperski C. 1998.
What characterizes a software) component? Software,
Concept and Tools. 191 49-56.
Chandler, D. 2007. 2nd edition, Semiotics the basics.
London and New York: Routledge.
Coll, C. 1991. Aprendizaje escolar and construcción del
conocimiento. Barcelona: Paidos.
Crnkovic I. and Larsonn M. 2002. Building reliable
component-based software systems. Boston: Artech
House.
TOWARDS AN INITIAL SEMIOTIC VIEW OF THE INTERACTIVE GRAPHIC ORGANISER
131

de Souza C. 2005. Semiotic engineering: bringing
designers and users together at interaction time.
Interacting with Computers Volume 17, Issue 3, May
2005, Pages 317 – 341
Entwistle, N. 1981. Styles of Learning and Teaching: An
Integrated Outline of Educational Psychology for
Student, Teachers, and Lecturers. Chichester: John
Wiley & Sons
Foglia, D. and Piccinnob, A. 2005. Environments to
support context and emotion aware visual interaction.
Journal of Visual Languages and Computing &
Computing, 16 386–405
Gallardo, M, Ponce, H. and Lopez, M. 2009. Desarrollo de
Software Educativo basado en components: el caso de
e-PELS. In Sánchez, J. ed. Nuevas Ideas en
Informática Educativa, Volumen 5, pp. 108 – 117,
Santiago de Chile: Universidad de Chile.
Gardner, H. 2003. Inteligencias Múltiples: la teoría en la
práctica. Buenos Aires: Paidos.
Gibbs, G., Morgan, A., and Northedge, A. 1998. Teaching
in Higher Education: theory and evidence, how
students learn, Milton Keynes: The Open University.
Gibbs, G. 1999. Teaching in Higher Education: theory
and practice, how students differ as learners, Milton
Keynes: Open University
Hall, S. 2007. This Means This, This Means That: A User's
Guide to Semiotics, London: Laurence King.
Hull, D. and Saxon, T. 2009. Negotiation of meaning and
co-construction of knowledge: An experimental
analysis of asynchronous online instruction.
Computers & Education 52, 624–639
Kolb, D., Rubin, I. and Osland, J. 1991. Organizational
Behaviour: an experiential approach. New Jersey,
Prentice-Hall
Laitkorpi M. & Jaaksi A. 1999. Extending the
Object-Oriented Software Process with
Component-Oriented Design. The Journal of Object
Oriented Programming JOOP 12(1) 41-50
Lopez, M. and Ponce, H. 2004. e-Learning Promotes
Students' Deep Learning. Proceeding Fourth
International Symposium Communication Systems,
Network and Digital Processing, University of
Newcastle, United Kingdom.
Lopez, M, Ponce, H. and Labra, J. 2007. Towards a more
meaningful web experience. Ninth International
Symposium on Communication Theory and
Applications. ISCTA'07. 16th - 20th. July.
Lopez, M, Ponce, H. Labra, J. and Jara, H. 2008.
Organizadores Gráfios Interactivos: Add-in para MS
Power Point. In Sánchez, J., ed., Nuevas Ideas en
Informática Educativa, Volumen 4, pp. 101-109,
Santiago de Chile: Universidad de Chile.
Lopez, M, Ponce, H. and Quezada R. 2009. Interactive
Graphic Organizers: A case of ICT curriculum
integration in higher education. London International
Conference on Education. 9-12 of November, 2009 in
London, UK.
Marzano, R., Pickering, D. & Pollock, J. 2001. Classroom
Instruction that Works: Research Based Strategies for
Increasing Student Achievement. Virginia: Association
for Supervision and Curriculum Development.
McMackin, M. and Witherell, N. 2005. Different routes to
the same destination: Drawing conclusions with tiered
graphic organizers. The Reading Teacher, 59 (3),
242-252.
Ponce, H, Lopez, M, Labra, J, Brugerolles, J, and Tirado,
C. 2007ª. Evaluación Experimental de un programa
virtual de entrenamiento en lectura significativa
e-PELS, Revista Electrónica de Investigación
Psicoeducativa. N° 12, Vol 52), 2007, pp 399 – 432.
Ponce, H., López, M., Labra, J. 2007b. Programa de
Formación en Estrategias de Aprendizaje Lector. In
Sánchez, J., ed., Nuevas Ideas en Informática
Educativa, Volumen 3, pp. 193-216, Santiago de Chile:
LOM Ediciones.
Ponce, H, Labra, J. and Lopez, M. 2008. Organizadores
Gráfios Interactivos: un innovador recurso tecnológico
para aprendizajes estratégicos. In Farias, M y
Oblinovic, K., eds., Aprendizaje Multimoda –
Multimodal Learning. pp 183 – 190. Santiago:
Publicaciones Facultad Humanidades, USACH.
Roman, J. 2004. Sociedad del conocimiento y refundacion
de la escuela desde el aula. Barcelona: Vemtrosa
Impresores.
Roman, J. and Gallego, S. 1994. ACRA: escalas
estratégicas de aprendizaje. Madrid: TEA Ediciones.
Sametinger J. 1997, Software Engineering with reusable
components. Berlin: Springer-Verlag.
Skaar, H. 2009. In defence of writing: a social semiotic
perspective on digital media, literacy and learning.
Literacy, Volume 43, Issue 1 p 36-42.
Stamper, R., Liu, K., Hafkamp, M., & Ades, Y. 2000.
Understanding the roles of signs and norms in
organizations—a Semiotic approach to information
design. Journal of Behaviour and Information
Technology, 191, 15–27.
Szyperski C. 1998. Component Software Beyond
Object–Oriented Programming. Edinburgh Gate:
Addison–Wesley.
ICISO 2010 - International Conference on Informatics and Semiotics in Organisations
132
