
Design of a Service-Oriented e-Learning Environment
Dumitru Dan Burdescu
1
, Marian Cristian Mihăescu
1
Costel Marian Ionaşcu
2
and Bogdan Logofătu
3
1
University of Craiova, Software Engineering Department, Craiova, Romania
2
University of Craiova, Analysis, Statistics and Mathematics Department, Craiova, Romania
3
University of Bucharest, CREDIS Department, Bucharest, Romania
{burdescu, mihaescu}@Ssoftware.ucv.ro, icostelm@yahoo.com
logofatu@credis.ro
Abstract. Within e-learning domain there is a tremendous effort trying to
loosely couple the data management and data deployment in e-Learning envi-
ronments. This paper presents a design of such a architecture which consists of
three main pieces: (1) Global Repository, (2) Repository Manager and (3) Web
Deployer. The architecture ensures scalability, interoperability and service
composition for an enterprise e-Learning environment. The Global Repository
consists of a suite of services that actually manage all the assets of the e-
Learning environment. The Repository Manager is a data management tool
which allows the maintenance of all assets from a desktop application. The Web
Deployer tool actually creates e-Learning environments by using assets from
the Global Repository. The overall architecture is Service Oriented such that
each service publishes its functionality in a standardized way letting other ser-
vices to access and use the functionality in a flexible manner.
1 Introduction
Enhancing on-line environments become more and more evident in almost all existing
systems. One important approach is to use a recommender system for students. This is
one important way of upgrading a traditional e-Learning platform. In this way, e-
learning becomes the way to empower a workforce with the skills and knowledge it
needs. So far, traditional e-learning systems were developed in the means of static
software applications, lacking in educational multimedia environments and persona-
lized capabilities and without any interest given to the real users input and feedback
[1, 2].
Large amount of hypermedia may be accessed using an e-Learning platform thus
leading to large amounts of data regarding user behavior. This data may be used for
intelligent user profiling, content reaching and classification, personalized intelligent
interface.
This paper presents a process and the outcome of our effort in developing a rec-
ommendation mechanism for students that run along an e-Learning environment. The
content of the e-Learning platform is centrally administered and is supposed to be
custom structured. An e-Learning infrastructure needs to be set up such that discip-
lines and associated materials are presented in a structured way. The platform is sup-
posed to have the capability of capturing and saving user’s performed activities.
Burdescu D., MihÄ
ˇ
Cescu M., Ionaŧcu C. and Logofatu B.
Design of a Service-Oriented e-Learning Environment.
DOI: 10.5220/0004465700980115
In Proceedings of the 4th International Workshop on Enterprise Systems and Technology (I-WEST 2010), pages 98-115
ISBN: 978-989-8425-44-7
Copyright
c
2010 by SCITEPRESS – Science and Technology Publications, Lda. All rights reserved

Second section presents related work regarding intelligent recommender systems.
The third section presents the e-Learning content representation and fourth section
presents the logging mechanism of student’s interactions. These two sections
represents a prerequisite for the e-Learning environments that want to obtain recom-
mendations from IRS. Section five presents the methodology of building learner’s
model, section six presents the procedure for computing the knowledge level for a
student and section seven presents the procedure for obtaining recommendations.
These sections represent the core business logic of IRS. Section eight presents the
software architecture of IRS. Main software components with functionalities and
interactions are presented. Section nine presents how IRS and client e-Learning plat-
form are put together. Finally, conclusions are presented.
2 Related Work
Substantial research in the design of technology enhanced learning has been con-
ducted within programs such as the Web-based Inquiry Science Environment [3],
BioKids [4], Thinkertools [5], Modeling Across the Curriculum [6], and other re-
search programs.
These projects have investigated the use of models and visualizations, idea maps
and modeling engines, graphs and data probes, collaboration, and inquiry learning.
They have pushed the boundaries of what technology can do, providing new functio-
nality for curriculum designs and scaffolding students, teachers and classrooms. Such
research promises to transform learning from its traditional form of knowledge disse-
mination to new forms of knowledge community and inquiry learning [7]. This
represents the next-generation of e-Learning systems that use innovative methods and
materials and finally promote an intelligent community curriculum developers.
Another research direction courses web-usage-based mining [15]. In this direction
there are major contribution regarding preprocessing and preparing of data [16], rec-
ommendation of actions in e-Learning according performed actions [17].
There were proposed models for assisting evaluation of learner’s in e-Learning
systems [18]. Implementing many of these research directions has been done using
data mining algorithms [19]. There were employed clustering algorithms [20], algo-
rithms for obtaining sequential models [21], algorithms for association rule creation
[22, 23].
These research directions concretized into non invasive recommendation systems
for learners [24]. Such system is also employed for obtaining recommendations re-
garding the materials that need to be studied by learners [25].
Automatic recommendation implies that the user profiles are created and eventual-
ly maintained dynamically by the system without explicit user information. Examples
include amazon.com’s personalized recommendations and music recommenders like
Mystrand.com in commercial systems [26], and smart recommenders in e-Learning
[28], etc. In general, such systems differ in the input data, in user profiling strategies,
and in prediction techniques.
Several approaches for automatic personalization have been reported in the litera-
ture, such as content-based or item-based filtering, collaborative filtering, rule-based
filtering, and techniques relying on Web usage mining, etc [27]. In the e-learning
100

area, one of the new forms of personalization is to give recommendations to learners
in order to support and help them through the e-Learning process.
To deliver personalized content to users with diverse backgrounds, data mining
techniques have been used in e-learning systems in recent years [29, 30]. The data
mining approach uses all the available information about existing users, such as sys-
tem logs, to learn user models and then use these models for personalization..
3 e-Learning Content Representation
Concept mapping may be used as a tool for understanding, collaborating, validating,
and integrating curriculum content that is designed to develop specific competencies.
Concept mapping, a tool originally developed to facilitate student learning by orga-
nizing key and supporting concepts into visual frameworks, can also facilitate com-
munication among faculty and administrators about curricular structures, complex
cognitive frameworks, and competency-based learning outcomes.
To validate the relationships among the competencies articulated by specialized
accrediting agencies, certification boards, and professional associations, faculty may
find the concept mapping tool beneficial in illustrating relationships among, ap-
proaches to, and compliance with competencies [6].
Figure 2 is a typical example of a concept map [14]. It addresses a simple ques-
tion, “What is a plant?” and illustrates how cross-links can be made and concepts
organized. This is just one way the concepts listed on the left of the figure can be
positioned in a hierarchical fashion to show relationships. The list of concepts and the
relationship between them depend entirely upon professor because different profes-
sors create different concept maps on the same subject. This is the reason why the
concept map associated with a subject is a point of continuous improvement.
Recent decades have seen an increasing awareness that the adoption of refined proce-
dures of evaluation contributes to the enhancement of the teaching/learning process. In the
past, the teacher’s evaluation of the pupil was expressed in the form of a final mark given
on the basis of a scale of values determined both by the culture of the institution and by the
subjective opinion of the examiner. This practice was rationalized by the idea that the
principal function of school was selection - i.e., only the most fully equipped (outstanding)
pupils were worthy of continuing their studies and going on to occupy the most important
positions in society.
The usage of concept maps has a proper motivation. Using this approach, the respon-
sibility for failure at school was to be attributed exclusively to the innate (and, therefore,
unalterable) intellectual capacities of the pupil. The learning/ teaching process was, then,
looked upon in a simplistic, linear way: the teacher transmits (and is the repository of)
knowledge, while the learner is required to comply with the teacher and store the ideas
being imparted [7].
Usage of concept maps may be very useful for students when starting to learn about a
subject. The concept map may bring valuable general overlook of the subject for the
whole
period of study.
It may be advisable that a concept map should be presented to the students at the very
first meeting. This will help them to have a good overview regarding what they will study.
101
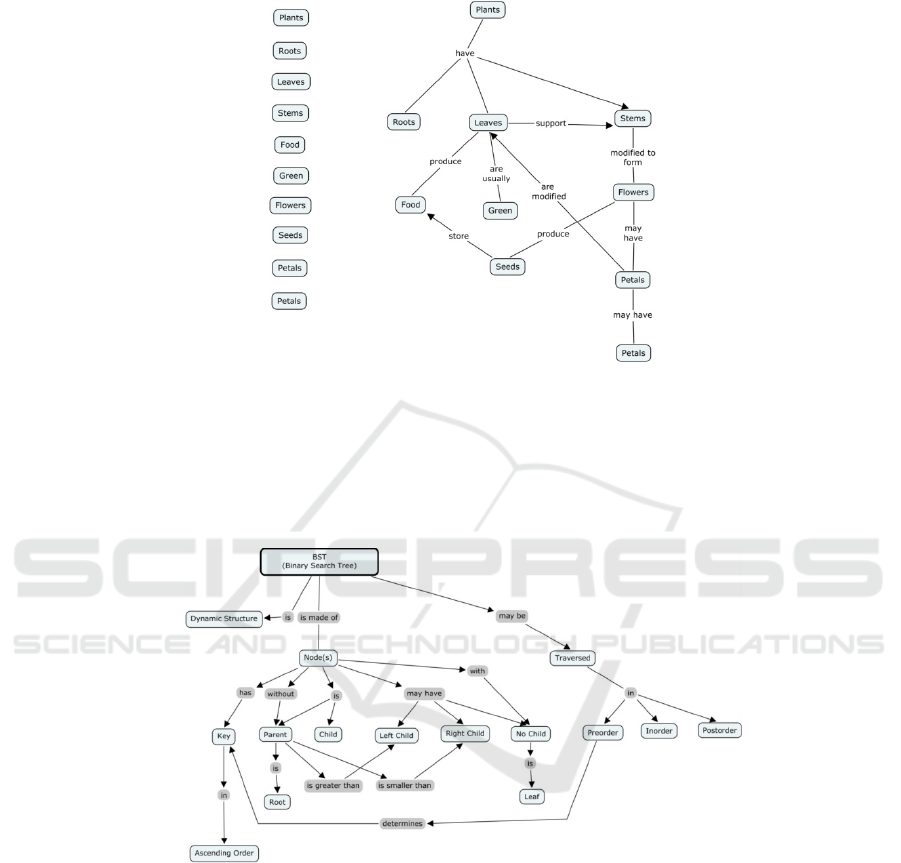
Fig. 1. An Example of a Concept Map (Novak, The Institute for Human and Machine
Cognition) [14].
The structuring of the teaching course material is performed according to the instruc-
tional objectives defined by course manager. This structuring will allow dynamically build
custom e-Learning course materials in accordance with learner’s previous activity, current
knowledge model and goals that were set up by administrators and learner himself.
Fig. 2. The structure of a course.
The knowledge representation model has a direct influence regarding the outcome of
the construction procedure of the learning material. Under these circumstances the know-
ledge model becomes the central part of the building mechanism. It may be regarded as a
reference point for all learners. It may be assimilated to a representative virtual learner for
all learners that contributed to experience repository data.
(wbe 2010)Once a course manager has been assigned a discipline he has to set up
its chapters by specifying their names and associated document. For each chapter
course managers have the possibility of setting up two pools of questions: one for
102
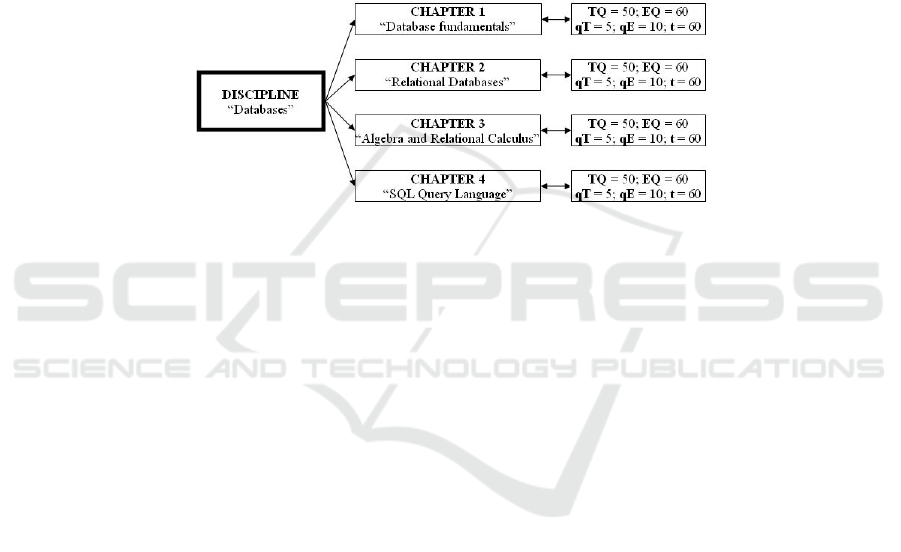
testing and one for final examination. The e-Assessment tool offers also the possibili-
ty the structure of testing and examination activities.
The course manager specifies the number of questions that will be randomly ex-
tracted for creating a test or an exam. Let us suppose that for a chapter the professor
created 50 test questions and 60 exam questions and he has set to 5 the number of test
questions and to 10 the number of exam questions that are to be randomly withdrawn.
It means that when a student takes a test from this chapter 5 questions from the pool
of test question are randomly withdrawn. When the student takes the final examina-
tion at the discipline from which the chapter is part, 15 questions are randomly with-
drawn: 5 from the pool of test question and 10 from the pool of exam question. This
manner of creating tests and exams is intended to be flexible enough for the professor.
In Figure 1 it is presented the logical structure of the Database discipline.
Fig. 3. Structure of Database discipline.
All tests and exams are taken under time constraints. For each chapter the profes-
sor sets up a number of seconds necessary to answer questions that chapter. When a
test or exam is taken all the seconds are summed thus obtaining a maximal interval of
time in which the student has to finish the test. The elapsed and remaining time are
managed on server side and presented to the student after each answered question. In
Figure 1 the time parameter is denoted by t and its value is 60 seconds for each ques-
tion. Figure 2 presents how the management of the Database discipline looks in the e-
Assessment tool.
The professor has also enough flexibility for creating and editing questions. A
question may contain pictures, thus equations, formulas or other graphics may be
imbedded into it. For each question the professor sets up the visible answers and the
correct answers. For example, if a question has four possible answers he will have to
check the checkboxes called A, B, C and D stating that the student will have four
choices. Error checking is enforced such that when a question has three visible an-
swers and the correct answer is D an error is shown to professor and the question
cannot be saved.
4 Logging Student Interactions
Tracking of actions is required to facilitate the data collection for the needed per-
formed actions. The design of actions tracking module needs to select proper features
that describe the performed actions of the learned. Among these features (or
103

attributes) there are: user id, the date and time the action has been performed, details
about the performed action, and so on. From the design phase of the platform, there
were adopted two methodologies for monitoring actions.
Since the business logic of the platform is Java based, log4j utility package was
employed as a logging facility and is called whenever needed within the logic of the
application. The utility package is easy to use; log4j.properties properties file manag-
es the logging process. The setup process states the logs are saved in idd.log file. The
main drawback of this technique is that the data from the file is in a semi-structured
form. This makes the information retrieval to be not so easy task to accomplish. On
the advantages, logging activity may be very helpful in auditing the platform or even
finding security breaches. This logging facility is also very helpful when debugging
during development or when analyzing peculiar behavior during deployment.
To overcome the semi-structured shape of logged activity a structured way of ga-
thering activity information was enforced. The activity table was added in the data-
base and all actions were recorded in the manner of one record per action. In the table
1 it is presented the structure of activity table.
Table 1. Structure of activity table.
Field Description
id primary key
userid identifies the user who performed the action
date stores the date when the action was performed
action stores a tag that identifies the action
details stores details about performed action
level specifies the importance of the action
In Table 1 the action field is represented by a tag. The detailed explanation of
what the tag means is set in a properties file. For each language a separate properties
file is created, each file containing the same tags but with description in a different
language.
The details field stores specific information regarding the action that was ex-
ecuted. For example, if a secretary modifies the profile of a student in the details field
there will be stored information about what fields were updated.
The level field specifies the importance of the executed action. There are defined
three level of importance: 0, 1 and 2 where level 0 specifies the critical actions.
After five months of deployment, the activity table contains more than 50,000 re-
cords and we suppose that until the end of the learning cycle there will be close to
100,000 records. All this logged activity may also be very helpful in an audit process
of the platform. The records from the activity table represent the raw data of our ana-
lyzing process.
Figure 4 presents a sample of the log with the performed activities by students.
104
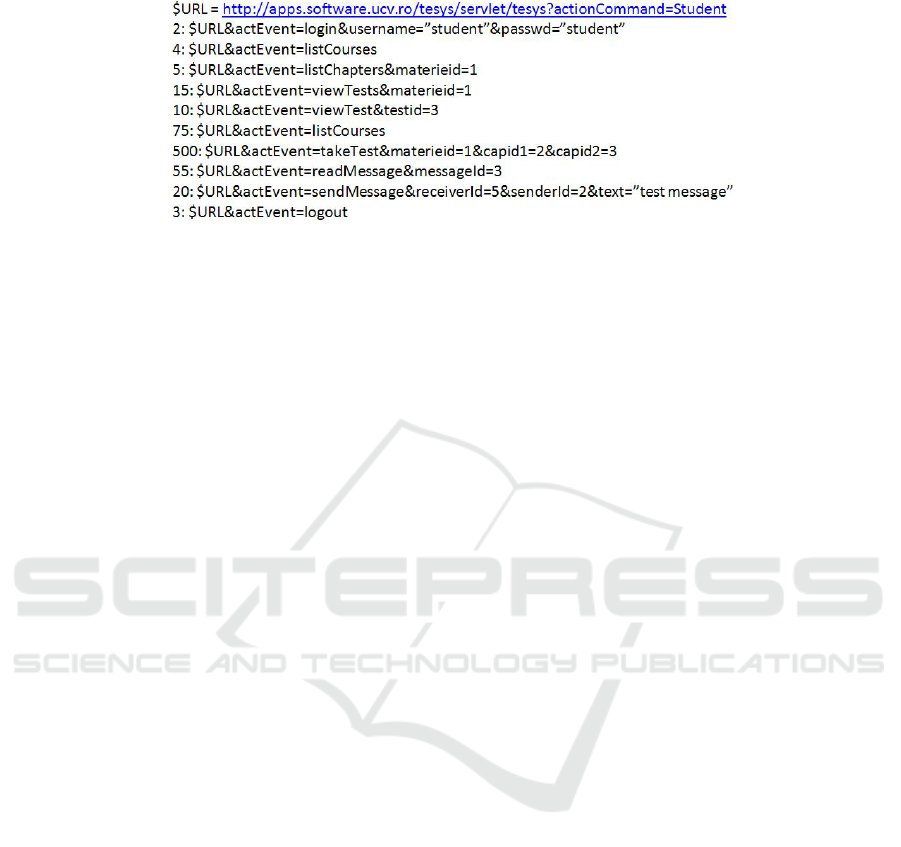
Fig. 4. Sample scenario for a virtual learner.
5 Building Learner’s Model and Predicting Needed Resources
Clustering is one of the most useful tasks in data mining process for discovering
groups and identifying interesting distributions and patterns in the underlying data.
Clustering problem is about partitioning a given data set into groups (clusters) such
that the data points in a cluster are more similar to each other than points in different
clusters [8].
In the clustering process, there are no predefined classes and no examples that
would show what kind of desirable relations should be valid among the data that is
why it is perceived as an unsupervised process [9]. On the other hand, classification is
a procedure of assigning a data item to a predefined set of categories [10].
Clustering produces initial categories, in which values of a data set are classified
during the classification process. From all clustering algorithms categories we chose
to have a closer look on those that use partitioning methods. k-Means algorithm [11]
is taken since it is simple and straightforward. The steps of clustering process are
presented in Figure 3. The procedure follows the standard knowledge discovery [10]
but is accustomed for our specific situation.
In the k-Means algorithm, given a database of n objects and k, the number of clus-
ters to form, a partitioning algorithm organizes the objects into k partitions ( k ≤ n ),
where each partition represents a cluster. The clusters are formed to optimize an ob-
jective partitioning criterion, often called similarity function, such as distance, so that
objects within a cluster are “similar”, whereas the objects of different clusters are
“dissimilar” in terms of database attributes. So, the first step is to define a list of
attributes that may be representative for modeling and characterizing student’s activi-
ty.
The classic k-means algorithm is a very simple method of creating clusters.
Firstly, it is specified how many clusters are being thought: this is the parameter k.
Then k points are chosen at random as cluster centers. Instances are assigned to their
closest cluster centre according to the ordinary Euclidean function. Next the centroid,
or the mean, of all instances in each cluster is calculated – this is the “means” part.
These centroids are taken to be the new centre values for their respective clusters.
Finally, the whole process is repeated with the new cluster centers. Iteration continues
until the same points are assigned to each cluster in consecutive rounds, at each point
the cluster centers have stabilized and will remain the same thereafter [12].
105
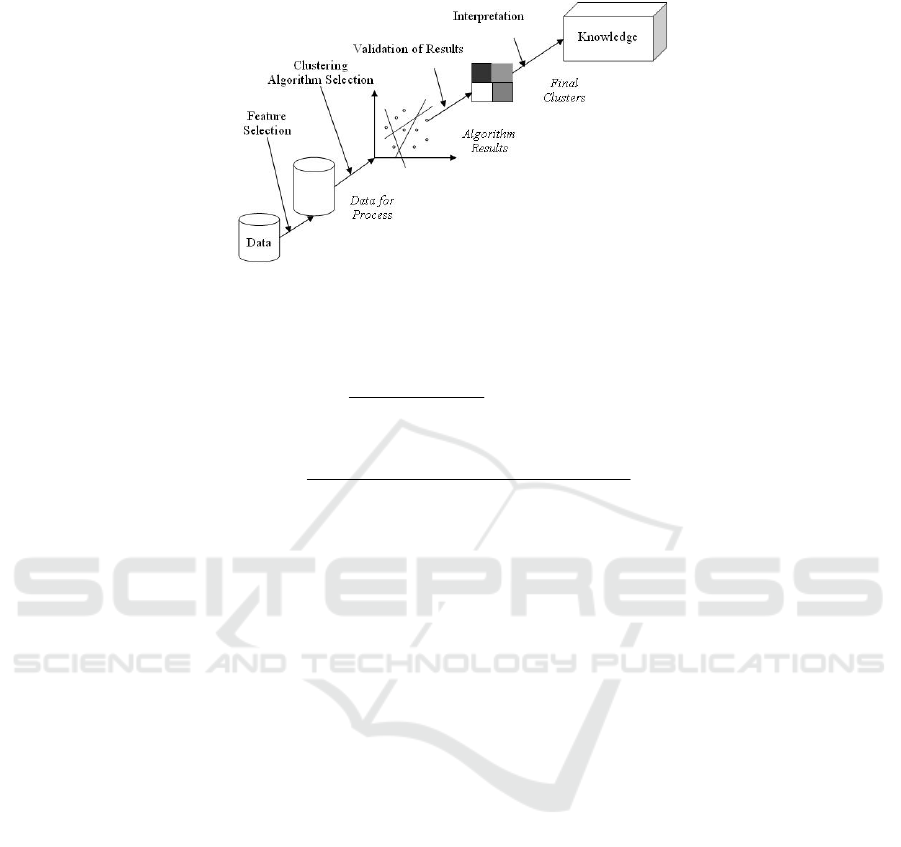
Fig. 5. Steps of clustering process.
From a different perspective, for a cluster, there may be computed the following two
parameters:
12
...
n
x
xx
n
μ
+++
=
(the means)
()() ()
22 2
12
...
1
n
xx x
n
μμ μ
σ
−+−++−
=
−
(the standard deviation)
The sum of all probabilities for all clusters is 1. If we know which of the distributions
each instance came from, finding the parameters is easy. On the other hand, if the
parameters are known finding the probabilities that a given instance comes from each
distribution is easy. The general clustering algorithms result in crisp clusters, meaning
that a data point either belongs to a cluster or not. The clusters are non-overlapping
and this kind of partitioning is further called crisp clustering.
Cluster validity assessment is the final step in the process and practically validates
the results. There are two criteria proposed for clustering evaluation and selection of
an optimal clustering scheme [9]: compactness and separation.
Also, the influence of the maximum number of clusters Cmax, related to the
weighting factor, in the selection of the optimal clustering scheme is discussed in
[12].
6 Computing the Knowledge Level
The main input data for computing the knowledge level is represented by the context
data from the platform and the activity performed by the learner taken into considera-
tion. Next lines present a sample XML file with data representing the context of the
platform.
<module>
<id>1</id>
<name>Computer Science</name>
106

<discipline>
<id>1</id>
<name>Algorithms and Data Structures</name>
<chapter>
<id>1</id>
<name>Binary Search Trees</name>
<quiz>
<id>1</id>
<text>text quiz 1</text>
<visibleAns>abcd</visibleAns>
<cotectAns>a</ cotectAns >
</quiz>
……
</chapter>
<chapter>
<id>2</id>
<name>Height Balanced Trees</name>
</chapter>
……
</discipline>
</module>
One of the critical issues regarding knowledge measurement is represented by weight
assignment procedure for quizzes. Weight assignment is automatically performed
according with data recorded within Experience repository module. The weight of a
quiz is computed according with the number of learners that answered incorrectly to
that quiz. If n is the total number of learners that answered a question q
i
and n
wrong
is
the number of students that answered incorrectly the question than the formula for
computing the weight of the quiz is:
ℎ
=
This formula will assign values between 0 and 1. Values closer to 1 mean high weight
and are obtained for high number students that answered incorrectly to questions. For
example, if 25 students answered to a quiz and 20 of them answered incorrectly this
means the weight of the quiz is 0.8.
7 Procedure for Obtaining Recommendations
For Algorithms and Data Structures disciplines there was created an infrastructure for
Binary Search Trees chapter. For this chapter there were defined 16 concepts as in
figure 4. For each concept there are created 5 to 10 quizzes. Each instance is repre-
sented by a set of 3 features: nL -number of loggings, nT-number of taken tests,
avgW-
average of weight for taken test.
- K-means clustering algorithm is performed and 4 clusters are obtained. The distribu-
tion into clusters is:
107

- Cluster 0 – 25 instances – 12.5 %
- Cluster 1 – 63 instances – 31.5 %
- Cluster 2 – 80 instances – 40 %
- Cluster 3 – 32 instances – 16 %
The virtual representatives have the characteristics presented in table 1.
Table 2. Cluster characteristics.
Cluster ID
nL nT avgW
0 <10 <5 <0.3
1 10 .... 50 5 ... 10 0.3 ...0.5
2 50 ... 100 10 ... 20 0.5 ... 0.7
3 >100 >20 >0.7
When a learner with 15 loggings and 5 taken tests enters the e-Learning platform
he is placed as belonging to cluster 1. For him, the target cluster is cluster 2.
All concepts are taken into consideration for the virtual representative of cluster 1
and for analyzed user. Table 2 presents the value of weights for some concepts.
Table 3. Weights of concepts for a cluster representative and analyzed learner.
Concept
C1 C2
C3
Representative of cluster 1 0.2 0.4 0.5
Analyzed learner 0.1 0.1 0.2
For a threshold value of 0.2 there are obtained concepts C2 and C2. These con-
cepts need more study and thus their associated document is presented as recommen-
dation. More than this, the associated quizzes are recommended for testing purposes.
After the learning session all performer activities are saved into Experience
learner repository. Each time the learner will log in the e-Learning environment his
portfolio of actions is rebuild and the cluster to which the learner belongs is deter-
mined.
Within the knowledge repository model the model is rebuild at certain intervals,
for example 2 days. The newly obtained model represents a challenger model.
The quality of the challenger model is determined by computing the likelihood of
a test dataset. Measure of goodness-of-fit is determined by the logarithm of the likeli-
hood, or log-likelihood: and the larger this quantity, the better the model fits the data.
Instead of using a single test set, it is also possible to compute a cross validation esti-
mate of the log-likelihood. For our instances the value of the log-likelihood is -2.4
which represent a promising result in the sense that instances (in our case students)
may be clustered in four disjoint clusters based on their used features.
Validation of results produces the final clusters that implement the model. The
validation procedure has two main outcomes: firstly it proves the correctness of re-
sults for current dataset and gives an idea of how the model will perform on new data.
Classification using Bayes technique was also used for obtaining recommenda-
tions
regarding assets (e.g. documents, quizzes) that need more attention. For each resource
there was computed a context in which a label is defined. The features that describe
108

an instance are nT – number of tests, avgW – average weight of taken tests and fG –
final grade. Table 3 presents few sample contexts.
Table 4. Sample resource features and tag.
id nT avgW fG tag
0 5 0.3 4 yes
1 10 0.5 5 yes
2 60 0.7 8 no
3 65 0.76 7 no
In table 4 may be seen that for resource 1 there were taken 10 tests with an aver-
age weight of 0.5. The final grade was five and thus the recommendation is yes. All
these data represent the training data for the Naive Bayes classifier that will be used
for determining what resourced may be recommended.
The performance of the model was evaluated by using 10-fold cross validation
technique. The results are presented as percentage of correctly classified instances
(78.71%) and incorrectly classified instances (21.19%) and confusion matrix.
Whenever needed, the learner may issue a request for advice. All his performed
activities regarding activities are taken into consideration and the classifier is run such
that a label in created for each resource. Resources that are labelled with yes are rec-
ommended to the learner as needing further study.
When a learner enters the platform, he will automatically be clustered and, thus,
the next clustered with higher value of average coverage is determined. If there is no
better cluster, than the clustering process will be performed for the students that be-
long to the very same cluster, thus obtaining new clusters.
The procedure that determines the advice is:
procedure DetermineAdvice(Learner l,Collection collection)
{
K = classifyLearner (l, collection);
T = determineTargetCluster (K, collection);
for (int s=0; s < NC; s++) {
switch distance( coverage(cs, K), coverage(cs, T) )
case “veryLow”: return NO_ADVICE;
case “low” : return NEED_EXAMPLE;
case “avg” : return NEED_DETAILED_DESCRIPTION;
case “high”: return NEED_OVERVIEW;
}//end for
}//end procedure
The above procedure determines the advice for a learner l having already computed a
collection of clusters named collection. Firstly, it is determined the cluster K to which
the learner l belongs. Cluster K is one of the clusters produced by the clustering proc-
ess. Than it is determined the target cluster T. This is the cluster with higher weight
coverage than K. Once clusters K and T are determined each concept is taken into
consideration. NC represents the number of concepts and s is iterator. For each con-
cept it is computed the distance between the values of coverage for concept cs in both
K and T clusters. If the distance is very low than any advice is issued. If the distance
is low than it seems the learner needs to make small progress in understanding that
109

concept. That is why, he just needs to access the examples document that is assigned
to that concept. If the distance is average than it seems the learner needs to make more
progress in understanding that concept. In this situation the learner is advised to study
the detailed description document that is assigned to that concept. If the distance is
high we may say that learner has no knowledge regarding the discussed concept. In
this situation the advice is to start studying the concept overview.
The distance function makes intensive usage of concept maps. The concept maps
are used for computing the quantity of knowledge a learner has accumulated at a
certain moment in time. The concept map is a graph where nodes are represented by
concepts. Once a user has activity and he has answered tests questions there may be
computed the weight of the graph which represents the quantity of accumulated
knowledge. Thus, for a cluster of learners there may be determined a representative
learner (which is a virtual learner) whose level of accumulated knowledge represents
the average of accumulated knowledge for all learners that belong to that luster. In
this manner, there might be determined a representative learner for all cluster and
thus, an Euclidian distance may be defined.
Once the advising process is finished the user is invited to have spent some time
for actually following the received advice. Once this is accomplished, the testing
activities may resume. All performed activities are again monitored and saved along
with older ones. Whenever the learner seems its appropriate he may ask again for
advice. At this point, the learner is clustered again. This means he is placed in one of
the existing clusters. Determining the advice will follow the same procedure. Hope-
fully, due to previous advice, the learner is in a “better” cluster and thus the advices
are more oriented towards examples. If this is not the situation it means that the
learner has not progressed in improving his knowledge coverage of the concepts and
thus advices regarding a better reading of the overview document are issued.
The analysis process has the goal of determining clusters of users/students based
on their activity. Each user represents an instance for the clustering process and is
represented by a set of parameters. The obtained clusters are used for classifying
students. A student may be “moved” from one cluster to a “better” one by determin-
ing the concepts that are not covered well. This is done by a weight function that
computes a generic weight, which is representative for that cluster. In this way, clus-
ters may be “ordered” and a Euclidian function may be defined.
The clustering process is used for putting together students with the similar activi-
ty. The activity is represented by performed actions of learners within the e-Learning
environment. Once clusters are created there is used a weight function for computing
the representative learner for each cluster. The procedure will recommend concepts
based on the distance function presented further in this section.
Firstly, the parameters that represent a learner and their possible values must be
defined. For this study the parameters are: nLogings – the number of entries on the e-
Learning platform; nTests – the number of tests taken by the learner; noOfSentMes-
sages – the number of sent messages to professors; chapterCoverage – the weighted
chapter coverage from the testing activities. Their computed values a scaled to one of
the following possibilities: VF – very few, F – few, A – average, M – many, VM –
very many. The number of attributes and their meaning has a great importance for the
whole process since irrelevant attributes may degrade classification performance in
sense of relevance. On the other hand, the more attributes we have the more time the
110

algorithm will take to produce a result. Domain knowledge and of course common
sense are crucial assets for obtaining relevant results.
After the parameters have been named they are computed for each learner that
participates in the study. In Figure 3 this step is named Feature Selection and produc-
es the Data for process. Data is represented by the whole history of all users that may
be found in relations of the database (e.g., activity, exam results, test results, messag-
es, etc.) and in semi structured log files. The Feature Selection will produce the set of
instances (sometimes called points) that will represent the input for Clustering Algo-
rithm Selection. Depending on algorithm a number of clusters is obtained each in-
stance being assigned to one or more clusters.
In the next paragraphs there will be described in detail the whole process of know-
ledge discovery. Everything starts with the data from the database of the e-Learning
platform.
The database of the platform contains 21 relations. Among the most important
ones are: user, role, userrole, usersections, sections, questions, testquestions, exam-
questions, testresults, examresults, messages and activity.
The preparation gets data from the database and puts it into a form ready for
processing of the model. Since the processing is done using custom implementation,
the output of preparation step is in the form of an arff file. Under these circumstances,
we have developed an offline Java application that queries the platform’s database
and crates the input data file called activity.arff. This process is automated and is
driven by a property file where there is specified what data/attributes will lay in activ-
ity.arff file.
For a student in our platform we may have a very large number of attributes. Still,
in our procedure we use only four: the number of logings, the number of taken tests,
the number of sent messages and the weighted chapter coverage from the testing ac-
tivities. Here is how the arff file looks like:
- @relation activity
- @attribute nLogings {VF, F, A, M, VM}
- @attribute nTests {VF, F, A, M, VM}
- @attribute noOfSentMessages {VF, F, A, M, VM}
- @attribute chapterCoverage {VF, F, A, M, VM}
- @data
- VF, F, A, A,
- F, A, M, VM,
- A, M, VM, A, V,
- VM, A, VM, M,
As it can be seen from the definition of the attributes, each of them has a set of five
nominal values from which only one may be assigned. The values of the attributes are
computed for each student that participates in the study and are set in the @data sec-
tion of the file. For example, the first line says that the student logged in very few
times, took few tests, sent an average number of messages to professors and had aver-
age chapter coverage.
In order to obtain relevant results, we pruned noisy data. We considered that stu-
dents for which the number of logings, the number of taken tests or the number of
111
sent messages is zero are not interesting for our study and degrade performance; this
is the reason why all such records were deleted.
With this step, we actually accomplished the Feature Selection step from the clus-
tering process. Now we are ready for running the k-Means clustering algorithm.
Running the EM algorithm from Weka [14] package created three clusters. The
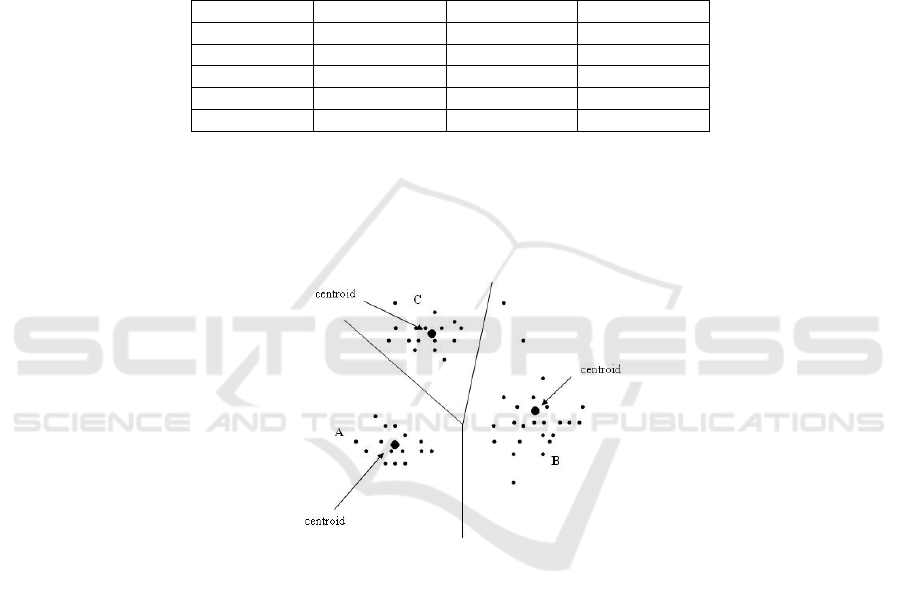
procedure clustered 91 instances (34%) in cluster A, 42 instances (16%) in cluster B
and 135 instances (50%) in cluster C. The following table shows in which cluster the
instances belong after running the EM algorithm.
Table 6. Distribution of instances after EM algorithm.
Instance Cluster A Cluster B Cluster C
1 1 0 0
2 1 0 0
3 0 1 0
… … … …
268 0 0 1
Figure 6 presents the distribution of instances after running EM algorithm, with
centroids marked. The figure is generated by plotting each student as a black dot.
The algorithm has O(n) time complexity, where n is the number of instances in the
dataset. In the performed experiments, we observed that the number of clusters has no
importance regarding algorithm’s complexity.
Fig. 6. Distribution of instances after k-Means algorithm with centroids.
The model validation is accomplished by computing the likelihood of a set of test
data given the model. Weka measures goodness-of-fit by the logarithm of the likelih-
ood, or log-likelihood: and the larger this quantity, the better the model fits the data.
Instead of using a single test set, it is also possible to compute a cross validation esti-
mate of the log-likelihood. For our instances the value of the log-likelihood is -
2.61092, which represents a promising result in the sense that instances (in our case
students) may be classified in three disjoint clusters based on their activity.
When a learner enters the platform, he will automatically be clustered and, thus,
the next clustered with higher value of average coverage is determined. If there is no
better cluster, than the clustering process will be performed for the students that be-
long to the very same cluster, thus obtaining new clusters.
112
8 Software Architecture of Intelligent Recommender System (IRS)
One of the key issues in making the above presented shift a real success resides in the
ability to design a custom knowledge representation model. Therefore, new know-
ledge management technologies are needed to prove the effectiveness of modern e-
Learning environments.
Custom knowledge representation will enable designing context-aware environ-
ments and therefore create the premises for shifting towards intelligent e-Learning
environments.
The benefits of such approach regard helping professors to prepare high quality e-
Learning content. Learners will benefit by being able to access needed learning ma-
terial such that their knowledge level will optimally increase.
This section presents the architecture of the system that will manage and use the
custom knowledge representation model.
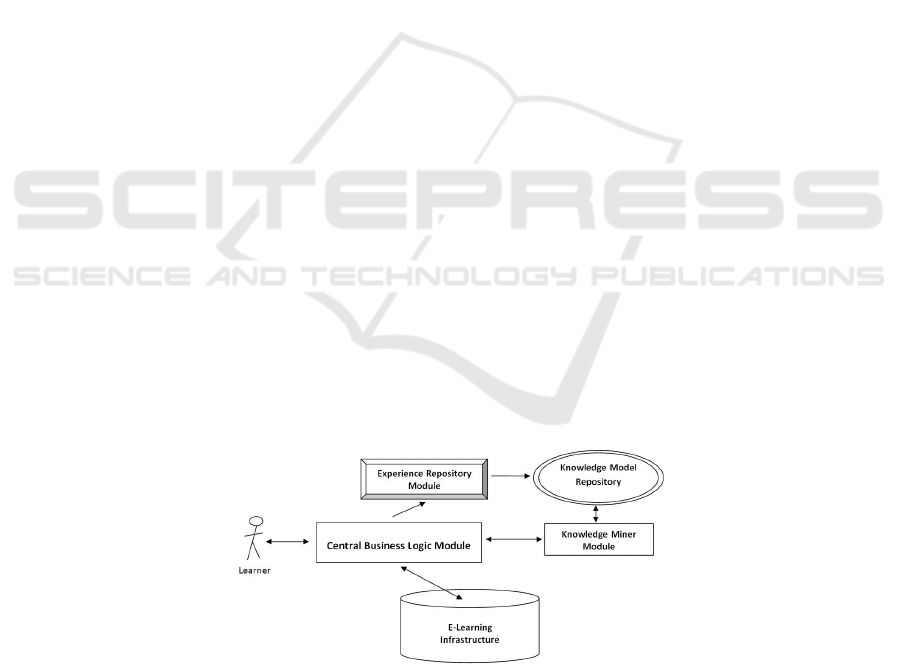
The main components that make up the system are:
Central Business Logic Module – this module contains the logic for accessing the e-
Learning infrastructure and for sending queries and receiving responses from the
Knowledge Miner Module. It also represents the main entry point into the system.
Here is gathered the general operation logic.
Experience Repository Module – this module gathers in a structured format all the
data regarding the actions that were performed by learners.
Knowledge Model Repository – this module manages the current knowledge model
representation. This model is used whenever the intelligent character of an action is
needed.
Knowledge Miner Module - this module gathers the business logic for querying the
knowledge model repository.
e-Learning Infrastructure Module – this module represents the classical view of an
e-Learning environment.
The proper operation of central business logic module and experience repository
module is driven by an experience properties file. This file contains the definitions of
the actions that are to be logged as experience during the operation of the system.
Knowledge model repository functionality is managed by a properties file which
specifies the employed technique for building the model. This properties file has as
input the properties file that sets up the experience repository module.
Fig. 7. System’s architecture.
113

Knowledge miner module runs according with the specifications set up by the data
analyst. The specifications regard the specific educational goals required by the ad-
ministrators of the e-Learning environment.
E-learning infrastructure represents the classical view of an e-Learning system. It
gathers all the assets managed by e-learning environment: users (e.g. learners, profes-
sors, and administrators), disciplines, chapters, course documents, quizzes. It also
embeds the needed functionalities for proper running, like security, course download-
ing, communication, testing or examination.
Central business logic module along with e-Learning infrastructure represents the
classical structure of an e-Learning environment. Experience repository module,
knowledge model repository and knowledge miner module may be regarded as an
intelligent component that runs along the e-Learning environment in order to enhance
it.
9 Conclusions and Future Work
We have created a procedure of data analysis, which may be used for improving the
level of acquired knowledge of a student.
An e-Learning platform has been set up such that a set of students may study a
discipline that is well structured. This means that the discipline is divided into chap-
ters and that each chapter has assigned a concept map. More than this, each concept
defined in the concept map has assigned a set of documents and a set of quizzes. The
documents that are assigned are: overview, detailed description and examples.
The experiment is performed on 268 students that used Tesys e-Learning platform.
The platform on which the study may be performed needs built-in capabilities of
monitoring activities performed by learners. The business goal of the platform is to
give students the possibility to download course materials, take tests or sustain final
examinations and communicate with all involved parties. To accomplish this, four
different roles were defined for the platform: sysadmin, secretary, professor and stu-
dent.
The process’s goal is improve the level of acquired level by custom advising re-
garding the concepts that need further attention. An off-line application was devel-
oped for creating the input data files that are analyzed. Data analysis is done using k-
Means clustering algorithm. The main goal of the procedure is to create clusters of
students based on their recorded activity.
For k-Means clustering we have computed determined three clusters. The obtained
validation values of log- likelihood show a success in clustering users.
Cross-validation technique proved that obtained models may perform in the same
manner on new data. The obtained results show that using k-Means algorithm pro-
vides sound results.
The experiment proves that machine learning algorithms and concept maps may
be successfully used for improving quality of learning. Still, further refines of the
procedure may be needed. Improvement in structuring the discipline regards obtaining
more adequate concept maps.
Improvement regarding the analysis process may be done using different strate-
gies. Different data source may be considered. Different clustering procedures or even
114

different machine learning algorithms may also be considered. Having this in mind,
different goals may be taken into consideration.
Learner’s characterization may have a predictive value in the sense that, from the
activities a student has made there, conclusions about his learning proficiency might
be pulled out. On the other hand, platform’s characterization may have as the result an
estimation of the capability of an e-learning system to grade and order students ac-
cording to their accumulated knowledge. This analysis is critical for having as a con-
clusion that a system can support generalized tests.
Further experiments need to be run with data obtained from the same platform se-
tup (same disciplines, test and exam questions, etc.) but with other students. In future
we will try to follow the same analysis process with data from other platforms.
This business logic of generating advice considers that target cluster the cluster
with next immediate higher concept coverage. A good study may be done by always
considering as target cluster the cluster with best coverage results. This means that the
learner is in a position to have a more rapid learning curve.
The main drawback of the approach proposed in the study regards the complexity
of the procedure itself. The main steps (1) data collection, (2) data filtering (3) feature
selection (4) running the algorithms and (5) having and interpreting results represent a
distinct process that needs custom setting. Automation of the process and integration
within an e-Learning platform is the final goal.
Acknowledgements. This work was supported by the strategic grant
POSDRU/89/1.5/S/61968, Project ID61968 (2009), co-financed by the European
Social Fund within the Sectorial Operational Program Human Resources Develop-
ment 2007 – 2013.
References
1. M. Sullivan, “Collaboration: teacher pedagogy, student practice”, National Teaching and
Learning Forum, Vol. 7 No. 5, pp. 4–6, 1988.
2. H. Varenne, “On Pedagogical Authority: One Teacher’s Choice”, (Online). Available:
http://varenne.tc.columbia.edu/hv/pol/pedagog_author.html (last access: December 12,
2009).
3. WISE, (Online), Available: http://wise.berkeley.edu (last access: December 12, 2009)
4. BIOKIDS, (Online), Available: http://www.biokids.umich.edu (last access: December 12,
2009]
5. THINKERTOOLS, (Online), Available: http://thinkertools.org/ (last access: December 12,
2009]
6. MAC, (Online), Available: http://mac.concord.org (last access: December 3, 2009)
7. J. L. Kolodner, P. J. Camp, D. Crismond, B. Fasse, J. Gray, J. Holbrook, S. Puntambekar
and M. Ryan, “Problem-based learning meets case-based reasoning in the middle-school
science classroom: Putting learning by design into practice”, The Journal of the Learning
Sciences, 12 (4), pp. 495-547, 2003.
8. S. Guha, R. Rastogi and K. Shim, “ROCK: A Robust Clustering Algorithm for Categori-cal
Attributes”, In Proceedings of the IEEE Conference on Data Engineering, Sydney, Austral-
ia, pp. 512-521, 1999.
115

9. M. J. A Berry and G. Linoff, Data Mining Techniques For Marketing, Sales and Customer
Support. John Wiley & Sons, Inc., USA, 1996.
10. M. U. Fayyad, G. Piatesky-Shapiro, P. Smuth and R. Uthurusamy, Advances in Knowledge
Discovery and Data Mining. AAAI Press, 1996.
11. I. H. Witten and E. Frank, Data Mining – Practical Machine Learning Tools and Tech-
niques with Java Implementations, Morgan Kaufmann Publishers, 2000.
12. M. Halkidi, M. Vazirgiannis and I. Batistakis, “Quality Scheme Assessment in the Cluster-
ing Process”, Proceedings of PKDD, Lyon, France, 2000.
13. Weka, Available: www.cs.waikato.ac.nz/ml/weka
14. J. D. Novak, “Learning, Creating, and Using Knowledge: Concept Maps as Facilitative
Tools in Schools and Corporations”, Mahwah, NJ: Lawrence Erlbaum Associates, 1998.
15. J. Srivastava, R. Cooley, M. Desphande and P.N. Tan, “Web usage mining: Discovery and
applications of usage patterns from web data”. SIGKDD Explorations, 2000.
16. R. Cooley, B. Mobasher and J. Srivastava, “Data preparation for mining World Wide Web
browsing patterns”, Knowledge and Information Systems, 1999.
17. O. R. Zaiane, “Building a recommender agent for e-Learning systems”, Proc. of 7th Int.
Conf. On Computers in Education, Acuckland, New Zeeland, 2002.
18. L. Guo, X. Xiang and Y. Shi, “Use web usage mining to assist background online e-
Learning assessment”, 4th IEEE ICALT, 2004.
19. W. Abramovicz, T. Kaczmarek and M. Kowalkiewicz, “Supporting topic map creation
using data mining techniques”, Australian Journal of Information Systems, 2004.
20. J. Han and M. Kamber, Data Mining Concepts and Techniques, Morgan Kaufman, San
Francisco, 2001.
21. R. Srikant and R. Agrawal, “Mining sequential patterns: Generalizations and performance
improvements”, EDBT: Proc. of teh 5th Int. Conf. On Extending Database Technologies,
1995.
22. P. N. Tan, V. Kumar and J. Srivastava, “Selecting the right objective measure for associa-
tion analysis”, Information Systems, 2004.
23. R. Agrawal and R. Srikant, “Fast Algorithms for Mining Association Rules”, Proc. of the
20th Int. Conf. on Very Large Databases, Santiago, Chile, 1994.
24. W. Lin, S.A. Alvarez and C. Ruiz, “Efficient adaptive-support association rule mining for
recommender systems”, Data Mining and Knowledge Discovery, 2002.
25. E. Spertus and L. Stein, “A hyperlink-based recommender system written in squeal”, Proc.
ACM CIKM’98 Workshop on Web Information and Data Management, 1998.
26. B. Mobasher, “Data Mining for Web Personalization”, The Adaptive Web: Methods and
Strategies of Web Personalization, Lecture Notes in Computer Science, New York, 2006,
Vol. Springer-Verlag, Berlin-Heidelberg.
27. O. Nasraoui, “World Wide Web Personalization”, Invited chapter in “Encyclopedia of Data
Mining and Data Warehousing”, 2005, J. Wang, Ed, Idea Group.
28. O. R. Zaiane, “Building a Recommender Agent for e-Learning Systems”, in Proc. of the 7th
International Conference on Computers in Education, Auckland, New Zealand, December,
2002, 3 – 6, pp 55-59.
29. C. Romero, S. Ventura, “Educational Data Mining: a Survey from 1995 to 2005,” Expert
Systems with Applications. Elsevier 1:33 (2007) 135-146.
30. C. Romero, S. Ventura, J. A. Delgado and P. D. Bra, “Personalized Links Recommenda-
tion-Based on Data Mining in Adaptive Educational Hypermedia Systems,” in Creating
New Learning Experiences on a Global Scale, Springer Berlin /Heidelberg(2007), pp.292-
306.
116
