
WHICH RESOLUTION FOR RELIABLE ECG P-WAVE
ANALYSIS IN ATRIAL FIBRILLATION?
Federica Censi, Giovanni Calcagnini, Michele Triventi, Eugenio Mattei, Pietro Bartolini
Italian National Institute of Health, Viale Regina Elena 299, 00161 Rome, Italy
Ivan Corazza, Giuseppe Boriani
Policlinico S. Orsola-Malpighi, University of Bologna, Via Massarenti, 9, 40138 Bologna, Italy
Keywords: Atrial fibrillation, ECG analysis, P-wave, Signal resolution.
Abstract: P-wave analysis is becoming more and more used to help indentifying patients at risk for AF. Particularly,
precise measurement of P-wave duration is an important factor in determining the risk of atrial arrhythmias.
However, the methods to extract P-wave duration must be precise and reliable. Automatic analysis of P-
wave must take into account technical aspects, one of those being the bit resolution. The aim of this
manuscript is to investigate the effects of amplitude resolution of ECG acquisition systems on P-wave
analysis. Starting from ECG recorded by an acquisition system with a LSB of 31 nV (24-bit on an input
range of 524mVpp), we reproduced ECG signal as acquired by systems with lower resolution (16, 15, 14,
13 and 12 bit). We found that, when LSB is of the order of 128 µV (12 bit), a single P-wave is not
recognizable on ECG (figure 1, upper panel). However, when averaging is applied, a P-wave template can
be extracted, apparently suitable for P-wave analysis. Results obtained in terms of P-wave duration revealed
that at lowest resolution (from 12 to 14 bit) the error on P-wave duration estimation is important and could
lead to misleading results. However, the resolution used nowadays in modern electrocardiographs (15 and
16 bit) lead to results rather similar to those obtained with higher resolution.
1 INTRODUCTION
Analysis of P-wave is becoming more and more
used for gathering information about the
predisposition of patients to atrial tachycardia and
atrial fibrillation (Censi et al, 2007; Dilaveris et al.,
1998; Hayashida et al., 2005; Ozdemir et al., 2004).
The focus on P–wave is justified by its being
representative of atrial conduction: a longer and
more fragmented P-wave is related to obstacles,
blocks and defects which provoke atrial electrical
path to change and which are considered responsible
for the promotion of atrial tachycardia and
fibrillation.
The interest in the analysis of the P-wave has
increased in the last decades; different methods are
used, from manual analysis based on visual
inspection to automatic processing techniques, by
which reliable, more reproducible and objective
measures can be obtained. Indeed, manual analysis
of P-wave allows to extract quantitative but
operator-dependant parameters such as P-wave
duration and qualitative parameters such as
classification of morphological features
(monophasic, biphasic, etc…). Signal processing
techniques allow to obtain reliable and more
reproducible quantification of P-wave duration,
quantitative measures of P-wave morphology and
quantification of other P-wave features not
distinguishable by visual inspection (e.g. root mean
square of the last 20 ms of the P-wave) However,
even when P-wave is automatically processed, little
care is paid to the technical specifications of the
acquisition system, particularly to its amplitude
resolution, i.e. the value of the less significant bit
(LSB).
The aim of this manuscript is to investigate the
effects of amplitude resolution of ECG acquisition
systems on P-wave analysis. Starting from ECG
recorded by an acquisition system with a LSB of 31
nV (24-bit on an input range of 524mVpp), we
reproduced ECG signal as acquired by systems with
lower resolution (16, 15, 14, 13 and 12 bit).
385
Censi F., Calcagnini G., Triventi M., Mattei E., Bartolini P., Corazza I. and Boriani G..
WHICH RESOLUTION FOR RELIABLE ECG P-WAVE ANALYSIS IN ATRIAL FIBRILLATION?.
DOI: 10.5220/0003091603850388
In Proceedings of the International Conference on Bio-inspired Systems and Signal Processing (BIOSIGNALS-2011), pages 385-388
ISBN: 978-989-8425-35-5
Copyright
c
2011 SCITEPRESS (Science and Technology Publications, Lda.)
2 METHODS AND MATERIALS
2.1 Real High Resolution ECG
We started from ECG recordings obtained by using
the ActiveTwo system by Biosemi. This acquisition
system provides a 24 bit A/D conversion over an
input range of 524 mVpp; thus the LSB is 31 nV. In
this work we analyzed 160 ECG recordings obtained
from 10 patients (16 leads/patient).
2.2 Simulate Lower Resolution ECG
From 24-bit ECG signal, new files containing the
ECG signal at lower resolutions were generated by
rounding the ECG values to the nearest integer
value. Particularly, we reproduced A/D conversion
at 16 bit, 15 bit, 14 bit, 13 bit and 12 bit. This
resolution yields to LSB values as reported in table
1, given the input range of 524mVpp.
Table 1: LSB values obtained using 12,13,14,15 and 16 bit
over the input range of 524mVpp.
Number of bit Value of LSB (mV)
16 8 µV
15 16 µV
14 32 µV
13 64 µV
12 128 µV
2.3 Quantification of P-wave Features
To evaluate the difference in P-wave features, we
automatically quantified P-wave duration and
morphology from P-wave template extracted by
averaging technique using specific algorithms.
Every lead signal was pre-processed and analysed to
extract the average P-wave characteristic. The first
step is to detect P-waves from the acquired signals
P-waves. Secondly, a beat-by-beat linear piecewise
interpolation was used to remove baseline wander,
on each P-wave. Then, the averaging procedure is
performed to obtain a P-wave template. Ectopic
atrial signals or P-waves with excessive noise were
excluded by conventional template matching of each
P-wave, with an exclusion criterion of cross-
correlation coefficient lower than 0.9 (cross-
correlation threshold). The averaging procedure
went on until 200 beats were included. If the
residual noise level remained at more than 1V
even after averaging of 200 beats, averaging
procedure continued until the noise level reached a
value lower than 1 V. If it was impossible, the lead
was excluded from the study. Residual noise was
measured in the isoelectric segment before the P-
wave (TP track).
For each P-wave template, P-wave duration has
been automatically calculated as the time between
the onset and the offset of the P-wave. P-wave onset
is computed as the first point, among 20 consecutive
points starting from the beginning of the P-wave,
higher than 3 times the residual noise standard
deviation. Offset was analogously defined
considering the first point, among 20 consecutive
samples, starting from the end of the P-wave
window and going backward, where the signal level
rises above the same threshold.
Morphological parameters were extracted
according to the Gaussian function decomposition
described in (Uhley, 2001).
3 RESULTS
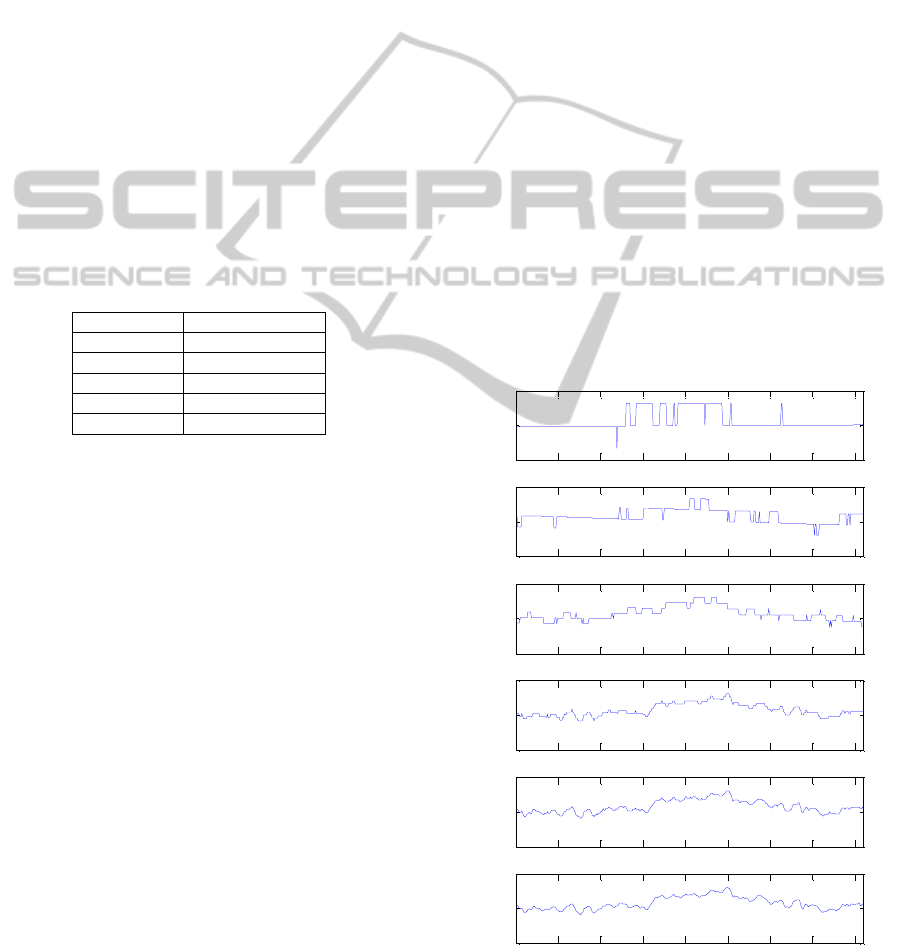
Figure 1 shows an example of the same P-wave as
visualized using 12, 13, 14, 15, 16 and 24 bit. While
the signals obtained at 15 and 16 bit are visually
comparable to the highest resolution (24 bit), the
lower resolutions seem not to be suitable for a P-
wave detection and analysis.
[samples]
[µV]
[µV]
[µV]
[µV]
[µV]
[µV]
0 50 100 150 200 250 300 350 400
-0.2
0
0.2
0 50 100 150 200 250 300 350 400
-0.2
0
0.2
0 50 100 150 200 250 300 350 400
-0.2
0
0.2
0 50 100 150 200 250 300 350 400
-0.2
0
0.2
0 50 100 150 200 250 300 350 400
-0.2
0
0.2
0 50 100 150 200 250 300 350 400
-0.2
0
0.2
Figure 1: An example of the same P-wave as visualized
using 12, 13, 14, 15, 16 and 24 bit.
BIOSIGNALS 2011 - International Conference on Bio-inspired Systems and Signal Processing
386
When averaging is performed, the criterion of
summing up at least 200 beats having a cross-
correlation threshold higher than 0.9 (template
matching) is no longer applicable at all resolutions.
Indeed the resolutions of 14, 13 and 12 bit need a
correlation threshold lower than 0.9 (until 0.5) for a
template to be extracted using no more than 150
beats. Using these less restrictive criteria, a P-wave
template can be obtained at all resolutions
apparently suitable for P-wave analysis.
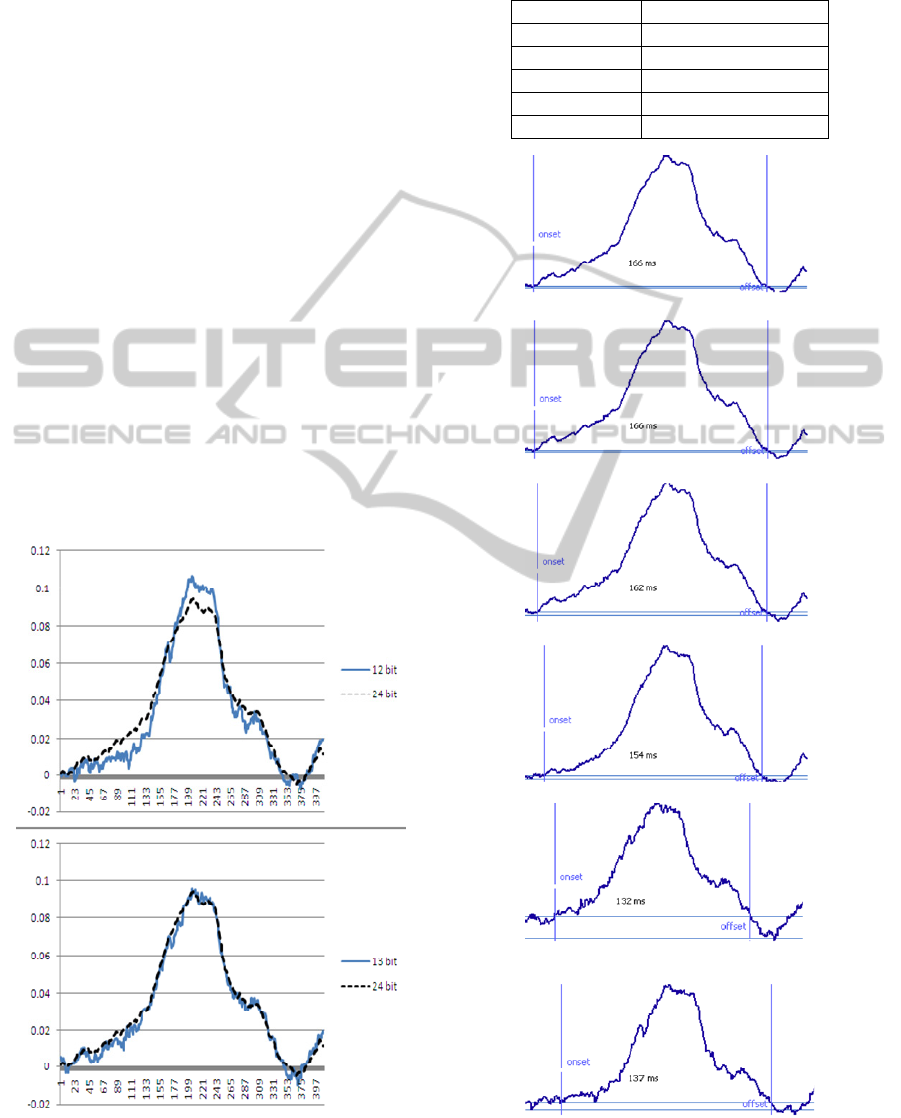
Figure 2 shows the P-wave templates obtained
for the 12-bit and 13-bit simulated ECG, compared
to the one obtained with the best resolution (24 bit,
dashed line). 12-bit resolution appears to be quite
different from the 24-bit ECG signal, in terms of
onset, offset and fragmentation.
Figure 3 shows the automatic computation of P-
wave duration, according to the algorithm described
in the previous section. Since P-wave template at
lower resolutions are quite more noisy than at higher
resolutions, P-wave duration resulted to be
significantly lower for 14 bit, 13 bit and 12 bit ECG
signals.
Table 2 shows the percentage differences for P-
wave duration measurements, for all bit resolutions
tested respect to the highest resolution of 24 bit.
[µV]
[µV]
Figure 2: P-wave templates obtained for the 12-bit and 13-
bit simulated ECG, compared to the one obtained with the
best resolution (24 bit, dashed line).
Table 2: Percentage differences for P-wave duration
measurements for all bit resolutions respect to the highest
resolution of 24 bit.
Number of bit Percentage difference
16 0
15 -1.2%
14 -6.4%
13 -15.2%
12 -18.1%
1
5
bit
1
6
bit
2
4
bit
12
bit
13 bit
1
4
bit
Figure 3: Automatic computation of P-wave duration for
all bit resolutions.
WHICH RESOLUTION FOR RELIABLE ECG P-WAVE ANALYSIS IN ATRIAL FIBRILLATION?
387

As far as quantification of morphological features is
concerned, we found that it was not significantly
affected by the ECG resolution.
4 DISCUSSION
P-wave analysis is becoming more and more used to
help indentifying patients at risk for AF.
Particularly, precise measurement of P-wave
duration is an important factor in determining the
risk of atrial arrhythmias.
Some of these analysis is made manually by
expert cardiologist (visual inspection). Automatic
analysis is also performed, using converted digital
ECG signals with variable number of bits.
Commonly used electrocardiographs convert the
signal using 16 or 15 bit, even if some analysis are
made on ECG converted at lower resolution (12 bit).
The LSB of such instruments, given an input
dynamic of some mV, is in the range 5-15 µV.
Given the large number of experimental
evidences on the association between P-wave
prolongation and AF, Uhley suggested to design
ECG machines in order to automatically calculate
and display P-wave duration (Uhley, 2007).
However, the methods to extract P-wave duration
must be precise and reliable. Automatic analysis of
P-wave must take into account technical aspects, one
of those being the bit resolution. In this paper we
investigate the effect of bit resolution of ECG
signals on automatic P-wave analysis. We started
from ECG signals acquired using a high resolution
system having 24 bit resolution (corresponding to a
LSB of 31 nV). We then obtained down-resolved
ECG, simulating ECG acquisition using 16 bit, 15
bit, 14 bit, 13 bit and 12 bit. We found that, when
LSB is higher than 100 µV, a single P-wave is not
recognizable on ECG (figure 1, upper panel).
However, when averaging is applied, a P-wave
template can be extracted, apparently suitable for P-
wave analysis. Results obtained in terms of P-wave
duration revealed that at lowest resolution with LSB
higher than 30 µV, the error on P-wave duration
estimation is important and could lead to misleading
results. In conclusion, the resolution used nowadays
in modern electrocardiographs (about 5 µV) lead to
results rather similar to those obtained with higher
resolution.
REFERENCES
Censi F., Calcagnini G., Ricci C., Ricci R. P., Santini M.,
Grammatico A., Bartolini P. P-wave morphology
assessment by a gaussian functions-based model in
atrial fibrillation patients. IEEE Trans Biomed Eng.
2007 Apr; 54(4):663-72.
Dilaveris P., Gialafos E., Sideris S., Theopistou A.,
Andrikopoulos G., Kyriakidis M., Gialafos J., et al.
Simple electrocardiographicmarkers for the prediction
of paroxysmal idiopathic atrial fibrillation. Am Heart J
1998; 135:733–738.
Hayashida N., Shojima T., Yokokura Y., et al. P-wave
signal-averaged electrocardiogram for predicting atrial
arrhythmia after cardiac surgery. Ann Thorac Surg
2005;79:859-64.
Ozdemir O., Soylu M., Demir A. D., Topaloglu S., Alyan
O., Turhan H., Bicer A., et al. P-wave durations as a
predictor for atrial fibrillation development in patients
with hypertrophic cardiomyopathy. Int J Cardiol
2004; 94:163–166.
Uhley H. Determination of risk for atrial fibrillation
utilizing precise P wave duration-measuring
methodology. Prev Cardiol 2001; 4:81–83.
Uhley H. It is time to include P-wave duration. Pacing
Clin Electrophysiol. 2007 Mar; 30(3):293-4. No
abstract available.
BIOSIGNALS 2011 - International Conference on Bio-inspired Systems and Signal Processing
388
