
MODELING CELL PROLIFERATION ACTIVITY OF HUMAN
INTERLEUKIN-3 UPON SINGLE RESIDUE REPLACEMENTS
Majid Masso and Iosif I. Vaisman
Department of Bioinformatics and Computational Biology, George Mason University
10900 University Blvd. MS 5B3, Manassas, Virginia, U.S.A.
Keywords: Delaunay tessellation, Statistical potential, Computational mutagenesis, Structure-function relationships,
Random forest supervised classification, Prediction.
Abstract: The signaling molecule human interleukin-3 (IL-3) is responsible for promoting the growth of a wide range
of hematopoietic cell lineages in the bone marrow. In this study, we apply an in silico mutagenesis
technique to investigate the effects of single amino acid substitutions in the IL-3 protein on cell proliferation
activity. The computational mutagenesis, which utilizes the IL-3 protein structure as well as a knowledge-
based, four-body statistical potential, empirically quantifies environmental perturbations at the mutated
residue position in IL-3 and at all neighboring positions in the folded structure. In particular, mutated
position perturbation scores alone are capable of characterizing IL-3 residues grouped by physicochemical,
functional, or structural properties. Additionally, these scores elucidate an IL-3 structure–function
relationship based on a collection of 630 single residue replacements for which activity changes were
experimentally measured. A random forest classifier trained on this dataset of experimental mutants, whose
respective feature vectors include environmental changes at the mutated position and at six nearest
neighbors in the IL-3 structure, achieves 80% accuracy and outperforms related state-of-the-art methods.
1 INTRODUCTION
Human interleukin-3 (IL-3) is a short-chain, bundled
four-helical cytokine that is produced primarily by
activated T-cells and acts in the bone marrow to
promote the growth of most precursor blood cell
lineages (Bagley et al., 1996, Feng et al., 1996,
Klein et al., 1997, Olins et al., 1995). It is a
relatively small signaling protein consisting of 133
amino acid residues (Figure 1A) that most closely
resembles granulocyte-macrophage colony
stimulating factor (GM-CSF) and IL-5, both of
which also possess four-helical bundles and belong
to the same family of short-chain cytokines (Bagley
et al., 1996, Feng et al., 1996). Unlike the other
members of this family, a short fifth α-helix is also
apparent in the IL-3 structure (Feng et al., 1996,
Klein et al., 1997). Cell proliferation activity is
initiated via the binding of IL-3 by a heterodimeric
IL-3Rα/Rβ transmembrane receptor on target cells
(Bagley et al., 1996, Klein et al., 1997). IL-3
specifically binds the Rα receptor subunit with low-
affinity, and it otherwise displays no affinity for the
Rβ chain; high-affinity IL-3 binding requires both
receptor subunits and the formation of an IL-3-IL-
3Rα/Rβ ternary complex (Bagley et al., 1996, Klein
et al., 1997). Signal transduction is subsequently
mediated by the Rβ receptor, whereby tyrosine
phosphorylation of the Rβ cytoplasmic domain by
JAK2 kinase is followed by induction of the STAT5
transcriptional pathway (Bagley et al., 1996, Feng et
al., 1996, Klein et al., 1997).
A solution structure has been determined for a
multiply substituted and truncated variant of human
IL-3 consisting of residue positions 14 – 125 (Feng
et al., 1996). The NMR coordinates, deposited into
the Protein Data Bank (PDB) under accession code
1jli (Berman et al., 2000), provide a minimized
average structure obtained from a family of 25
convergent structures with an average backbone
root-mean-square deviation of 0.88±0.15 angstroms
(Feng et al., 1996). Although a total of 14 residue
changes were introduced into the truncated protein
in order to make it sufficiently soluble and stable for
NMR studies, a cell proliferation assay revealed the
variant to be fully active (Feng et al., 1996).
Additionally, the results of saturation (Olins et al.,
1995) and site-directed (Bagley et al., 1996)
93
Masso M. and I. Vaisman I..
MODELING CELL PROLIFERATION ACTIVITY OF HUMAN INTERLEUKIN-3 UPON SINGLE RESIDUE REPLACEMENTS.
DOI: 10.5220/0003112700930101
In Proceedings of the International Conference on Bioinformatics Models, Methods and Algorithms (BIOINFORMATICS-2011), pages 93-101
ISBN: 978-989-8425-36-2
Copyright
c
2011 SCITEPRESS (Science and Technology Publications, Lda.)

mutagenesis experiments on IL-3 have been reported
in the literature, whereby cell proliferation assays
were used for measuring the activity associated with
a total of 630 single residue substitutions in the
native protein. The synthesized IL-3 mutants were
subsequently categorized based on their degree of
activity relative to that of the wild type protein.
In this study, we implement a computational
mutagenesis procedure for representing mutants of
human IL-3 due to single amino acid replacements.
The method utilizes a coarse-grained depiction of
protein structure as a collection of constituent amino
acid residue Cα coordinates in 3-dimensional (3D)
space. For each structure, the points serve as vertices
for a 3D tetrahedral tiling known as a Delaunay
tessellation (de Berg et al., 2008); hence, every
tetrahedron identifies a quadruplet of residues at the
vertices. Initially, a large and diverse set of protein
structures is tessellated, from which an amino acid
four-body potential is subsequently developed based
on statistical analysis of the residue quadruplets
collectively generated by the tetrahedra. Next, we
describe the in silico mutagenesis technique and how
its application to a protein such as IL-3 requires both
tessellation of its 3D structure and use of the four-
body statistical potential. For each single residue
replacement in IL-3, the method quantifies ensuing
environmental perturbations at the mutated position
and at structurally nearby positions that form a local
neighborhood as identified by the tessellated protein
structure. As will be shown in this manuscript, these
perturbation scores elucidate IL-3 structure-function
relationships and are valuable for developing a
predictive model of mutant IL-3 activity based on
implementation of a random forest classifier.
2 MATERIALS AND METHODS
2.1 Experimental Data
Theoretically, there are a total of 19 × 112 = 2128
possible single residue substitutions that can be
introduced into positions 14 – 125 of the available
human IL-3 structure. The principal dataset for this
study contains 630 of these IL-3 mutants,
representing amino acid replacements distributed
throughout the primary sequence of the protein at all
but 12 positions. Biological activity of these
experimentally synthesized IL-3 mutants was
determined via cell proliferation assays that
measured the incorporation of [
3
H] thymidine into
either AML193.1.3 (Olins et al., 1995) or TF-1
(Bagley et al., 1996) erythroleukemic cell lines.
Figure 1: (A) Ribbon diagram of human interleukin-3 (IL-
3) based on PDB accession code 1jli (Pettersen et al.,
2004). (B) Delaunay tessellation of IL-3 using Cα vertices
generates a convex hull of tetrahedral simplices
.
Mutant IL-3 activity was reported as a
percentage of the wild type (wt) protein,
summarized by the following categorical
distribution: 27 “increased activity” mutants (>
100% wt), 373 “full activity” mutants (20 – 100%
wt), 75 “moderate activity” mutants (5 – 19% wt),
and 155 “low activity” mutants (< 5% wt). As a two-
class system of IL-3 mutants, we consider the
following subsets: 400 that are “unaffected”
(“increased” and “full” combined) and 230 that are
“affected” (“moderate” and “low” combined) by
their respective residue substitutions.
2.2 Delaunay Tessellation and the
Four-Body Statistical Potential
The Delaunay tessellation of a set of points P = {x
1
,
x
2
, x
3
, …, x
N
} in 3D Euclidean space yields a convex
hull of space-filling, non-overlapping, irregular
tetrahedra whose combined vertices consist of
precisely all elements of P (Figure 1B). Two
adjacent tetrahedral simplices in a tessellation may
share a triangular face (three out of four points in
common), a linear edge (two points in common), or
a single vertex. Provided that no three points of P
are collinear, no four points are coplanar or on the
same circle, and no five points are on the same
sphere, there exists a unique Delaunay tessellation of
P (de Berg et al., 2008). The technique is applied to
a protein structure by initially abstracting to points
the constituent amino acids, which for this study are
selected to be the Cα atomic coordinates, to yield a
coarse-grained representation of the protein. Each of
the simplices in the ensuing protein structure
tessellation objectively identifies at the vertices a
quadruplet of structurally nearest neighbor amino
acid residues. To ensure only biochemically feasible
quadruplet interactions, all protein structure
tessellations are modified by the removal of edges
longer than 12 angstroms (Figure 2A). Delaunay
tessellation implementations and visualizations, and
all subsequent data analyses are performed using a
BIOINFORMATICS 2011 - International Conference on Bioinformatics Models, Methods and Algorithms
94
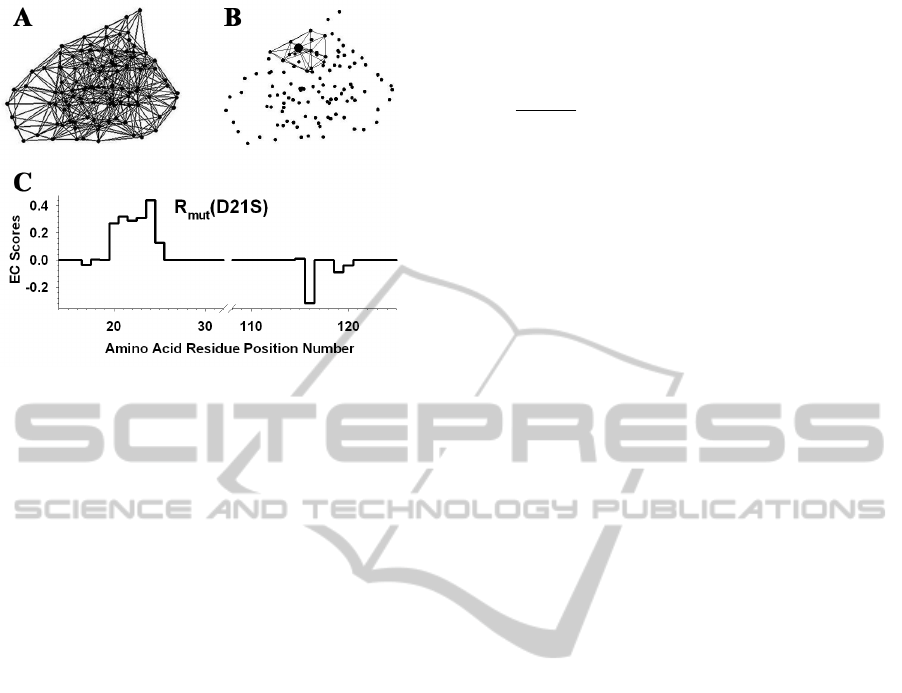
Figure 2: (A) Delaunay tessellation of IL-3 subject to an
edge length cutoff of 12 angstroms. (B) Subset of 14
tetrahedral simplices that share the Cα vertex of amino
acid residue D21 (enlarged relative to the others). There
are a total of 11 other vertices among these simplices, and
the residues they represent form the neighborhood of D21.
(C) R
mut
vector for the D21S mutant of IL-3. The nonzero
EC value at position 21 is the residual score of the D21S
mutant, and the other 11 nonzero EC scores identify the
D21 neighborhood positions.
combination of Qhull (Barber et al., 1996), Matlab
(Version 7.0.1.24704 (R14) Service Pack 1), and an
ad hoc suite of Java and Perl codes.
The amino acid building blocks of proteins form
a K = 20 letter alphabet A. The number of r = 4 letter
subsets (quadruplets) of A that can be enumerated,
assuming permutations of four letters in a quadruplet
do not constitute new subsets but that a quadruplet
may contain repeats of the same letter, is given by
.8855
4
14201
=
⎟
⎟
⎠
⎞
⎜
⎜
⎝
⎛
−+
=
⎟
⎟
⎠
⎞
⎜
⎜
⎝
⎛
−+
r
rK
These conditions reflect the facts that ordering is not
taken into account when four amino acids are
identified at the vertices of simplices in protein
structure tessellations, and that the same amino acid
may appear multiple times in a protein chain and in
structurally close proximity to form the vertices of a
simplex. Since on average only a few hundred
simplices and their respective quadruplets are
encountered when a single protein is tessellated, a
diverse dataset of 1417 high-resolution protein
structures with low sequence and structure similarity
was selected for tessellation using the PISCES
server (Wang and Dunbrack, 2003) in order to
reliably calculate simplicial nearest neighbor relative
frequencies of occurrence f
ijkl
for all 8855 possible
quadruplets (i, j, k, l) in protein structure space. A
rate expected by chance for the quadruplets is
obtained from the multinomial reference distribution
()
.4 and 1 where,
!
!4
20
1
20
1
20
1
20
1
===
∑∑
∏
∏
==
=
=
n
n
n
n
n
t
n
n
n
ijkl
taa
t
p
n
In the above formula, a
n
represents the proportion of
amino acids of type n in the 1417 tessellated protein
structures, and t
n
is the number of occurrences of
amino acid n in the quadruplet. Through an
application of the inverse Boltzmann principle from
statistical mechanics (Sippl, 1993), a knowledge
based statistical potential of quadruplet interaction is
given by the log-likelihood score s
ijkl
= log (f
ijkl
/
p
ijkl
), and the collection of 8855 quadruplet types
together with their respective scores defines the
four-body statistical potential (Carter et al., 2001).
2.3 Computational Mutagenesis
With the Delaunay tessellation of the human IL-3
protein structure, the four-body statistical potential
can be used to assign a score to each of the
constituent tetrahedral simplices equivalent to that of
the amino acid quadruplet identified at its four
vertices. Since each amino acid vertex is generally
shared by a number of adjacent tetrahedral
simplices, the residue participates in multiple nearest
neighbor quadruplets. All amino acids represented at
the other vertices of these simplices collectively
form a neighborhood of that shared residue, and any
position in a protein structure tessellation rarely has
fewer than six neighbors (Figure 2B). Although
amino acids positions in the neighborhood are all
structurally near their shared residue in 3D
Euclidean space, they are often distant from the
shared residue in primary sequence. For an amino
acid at primary sequence position i in the protein,
the residue environment score q
i
is defined as the
sum of scores of all tetrahedral simplices that share
its Cα vertex (Carter et al., 2001, Zhang et al., 2008).
The environment scores of all amino acids in the
native protein can be arranged to form a 3D-1D
potential profile (Bowie et al., 1991) vector Q
wt
=
<q
1
, q
2
, q
3
, …, q
N
>, where the translation i = i – 13
has been applied to the residue positions 14 – 125 of
the human IL-3 structure, and N = 112. A similar
profile Q
mut
can be obtained for any IL-3 mutant due
to a residue substitution at some position j, by first
replacing the identity of the amino acid accordingly
at the vertex representing position j in the
tessellation, and then recalculating all the residue
MODELING CELL PROLIFERATION ACTIVITY OF HUMAN INTERLEUKIN-3 UPON SINGLE RESIDUE
REPLACEMENTS
95

environment scores. However, the only environment
scores that are actually altered occur at the mutated
position j and at those that form its neighborhood in
the tessellation. The difference R
mut
= Q
mut
– Q
wt
=
< EC
1
, EC
2
, EC
3
, …, EC
N
> is a sparse mutant vector
that quantifies relative environmental changes or
perturbations EC
i
= q
i,mut
– q
i,wt
at every residue
position i in the protein due to the mutation (Carter
et al., 2001, Zhang et al., 2008). Since the only
nonzero EC components of R
mut
occur at mutated
position j and at positions in its neighborhood,
important local effects of a mutation are effectively
modelled; however, long-range consequences at
structurally distant protein positions are excluded
(Figure 2C). We refer to the EC
j
component in the
vector R
mut
at the mutational epicenter j as the
mutant residual score, due to its significance as a
summary measure of the relative change in mutant
IL-3 sequence-structure compatibility from that of
the native protein. Finally, a comprehensive
mutational profile (CMP) for IL-3 is a vector
obtained by calculating at each position the mean of
residual scores associated with all 19 amino acid
replacements, where each component is a CMP
score for the corresponding position (Carter et al.,
2001, Zhang et al., 2008).
Conformational changes are effectively
accounted for by this computational mutagenesis,
both implicitly, through the four-body potential and
the perturbation vectors R
mut
, and explicitly, due to
the use of only coarse-grained Cα representations of
structures and the fact that Delaunay tessellations are
robust to small shifts in the Cα coordinates. Hence, a
solved structure for every human IL-3 mutant is not
required, and tessellation of the only available IL-3
structure suffices. Moreover, these conditions
suggest that despite the fact that this IL-3 structure
contains 14 residue changes, its tessellation can be
used to represent that of the wild type protein by
altering the identities of the amino acids at the
corresponding vertices to those found in the native
IL-3 protein. With these initial alterations, Q
wt
can
then be computed for wild type IL-3, followed by
3D-1D potential profiles Q
mut
and perturbation
vectors R
mut
for all single residue mutants.
2.4 Random Forest Classification and
Evaluation of Performance
A feature vector is generated for each single point
human IL-3 mutant whose input attributes
(independent variables or predictors) include the
mutated position number, the identities of the native
and replacement amino acids at the mutated
position, the residual score (i.e., EC score at the
mutated position), and the EC scores at the six
nearest neighborhood positions ordered nearest to
farthest based on 3D Euclidean distance of each
neighbor from the mutated position. Next, we
include the ordered amino acid identities at the six
nearest neighbors as well as their ordered primary
sequence locations relative to the mutated position
(i.e., difference between neighbor and mutated
position numbers). Finally, the following input
attributes are added as feature vector components:
(1) The computed mean volume and mean
tetrahedrality for the set of Delaunay simplices that
utilize the mutated position as a vertex;
(2) The secondary structure {H, helix; C, coil} at
the mutated position;
(3) Depth {S, surface; U, undersurface; B, buried}
at the mutated position (tessellation-based surface
accessibility). Surface positions participate as one
of three vertices defining a triangular facet for
exactly one tetrahedron in the tessellation.
Undersurface positions are defined as non-surface
positions that share an edge with a surface
position. All other positions are buried;
(4) A count of the number of simplex edges the
mutated position shares with surface positions
(zero by definition for buried positions).
The mutant IL-3 activity class defines the output
attribute (dependent variable) associated with each
feature vector.
The supervised classification scheme that we
employ for this study is an implementation of Leo
Breiman’s random forest (RF) algorithm (Breiman,
2001), available as part of the WEKA suite of
machine learning tools (Frank et al., 2004). The RF
algorithm incorporates a bagging (bootstrap
aggregating) procedure to train an ensemble of
classification trees, and predictions are based on a
majority vote. The split at each node encountered in
the growing trees is based on a fixed-size random
subset of the predictor attributes. Also, though all
trees are unpruned, the algorithm does not overfit
regardless of the number of selected trees.
Generally, the RF algorithm performs better than
other supervised classification methods (Bordner,
2008, Qi et al., 2006). We fix the adjustable RF
parameters in this study at 100 trees, and 5 input
attributes are randomly selected for splitting at each
tree node.
RF performance on the dataset of IL-3 mutant
feature vectors is evaluated by using stratified
tenfold cross-validation (10 CV), leave-one-out
cross-validation (LOOCV), and stratified random
split (66% of dataset for model training and 34% for
BIOINFORMATICS 2011 - International Conference on Bioinformatics Models, Methods and Algorithms
96
testing). Given TP (TN) = total number of correctly
predicted “unaffected” or “U” (“affected” or “A”)
mutants and FN (FP) = total number of respectively
misclassified mutants, the overall accuracy is
defined as Q = (TP + TN) / (TP + FN + FP + TN).
For the “unaffected” class, S(U) = sensitivity = TP /
(TP + FN) and P(U) = precision = TP / (TP + FP),
while for the “affected” class, S(A) = TN / (TN +
FP) and P(A) = TN / (TN + FN). Finally, the
balanced error rate (BER) and balanced accuracy
rate (BAR), calculated as BER = 0.5 × [FN / (FN +
TP) + FP / (FP + TN)] and BAR = 1 – BER,
Matthew’s correlation coefficient (MCC), given by
,
FP)FN)(TNFP)(TNFN)(TP(TP
FNFP-TNTP
MCC
++++
××
=
and area (AUC) under the receiver operating
characteristic (ROC) curve provide alternative
measures that are especially useful for unbalanced
classes. A chi-square test can be applied to assess
MCC statistical significance, where the test statistic
is given by χ
2
= M × MCC
2
(M = number of
predictions) with one degree of freedom (Baldi et
al., 2000). An ROC curve is a plot of true positive
rate (sensitivity) versus false positive rate (1 –
specificity), and AUC is equivalent to the non-
parametric Wilcoxon-Mann-Whitney test of ranks
(Fawcett, 2003). An AUC value near 0.5 suggests
the trained model will not perform better than
random guessing, while a value of 1.0 indicates a
perfect classifier.
3 RESULTS AND DISCUSSION
3.1 Human IL-3 Structure-Function
Relationships
We begin by generating perturbation vectors R
mut
for all 2128 mutants of human IL-3 due to single
residue substitutions at positions 14 – 125, from
which residual scores are obtained for the 630
mutants of IL-3 with experimentally classified
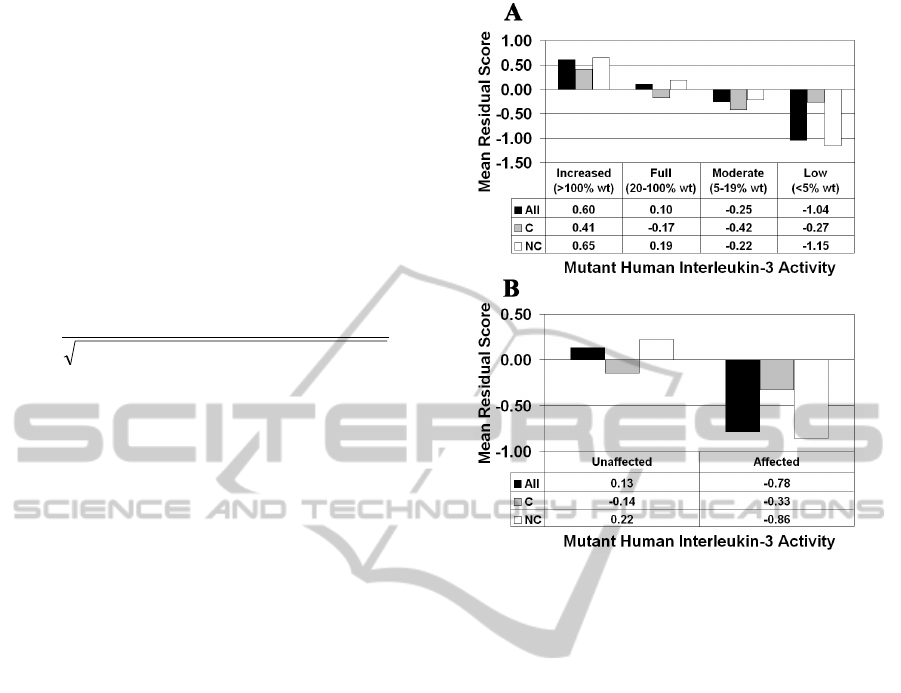
activity. Next, a mean residual score is calculated for
the IL-3 mutants in each of the four activity
categories and reflects a clear trend (Figure 3A),
whereby increasingly detrimental effects on
structure (i.e., decreasing mean residual scores) are
associated with higher levels of functional
impairment (i.e., diminished levels of activity).
Moreover, based on six separate t-test applications, a
statistically significant difference exists between
Figure 3: Human IL-3 structure-function correlation based
on (A) four mutant activity categories and (B) two
functional classes (C / NC = conservative / non-
conservative amino acid substitutions).
mean residual scores associated with each pair of
activity classes in Figure 3A (p < 0.05 in all cases).
The mutants in each class of Figure 3A are
further categorized based on whether the residue
replacements are conservative (C) or non-
conservative (NC) relative to the native amino acids,
and mean residual scores are computed for each of
these subgroups. With the 20 amino acids clustered
into six groups as {(A,S,T,G,P), (D,E,N,Q),
(R,K,H), (F,Y,W), (V,L,I,M), (C)} based on
similarities in physicochemical properties, intraclass
residue replacements are considered conservative
while interclass substitutions are non-conservative
(Dayhoff et al., 1978). Note that the overall trend is
driven by NC mutations, since C substitutions
minimally impact sequence-structure compatibility
regardless of the impact on activity. All results based
on four mutant activity categories are identically
replicated when we consider the case of two
(unaffected / affected) functional classes (Figure
3B), as defined in the Materials and Methods, and
the difference in mean residual scores for this class
pair is also statistically significant (p < 0.0001).
We alternatively consider distribution of the 630
experimental IL-3 mutants in a contingency table
MODELING CELL PROLIFERATION ACTIVITY OF HUMAN INTERLEUKIN-3 UPON SINGLE RESIDUE
REPLACEMENTS
97
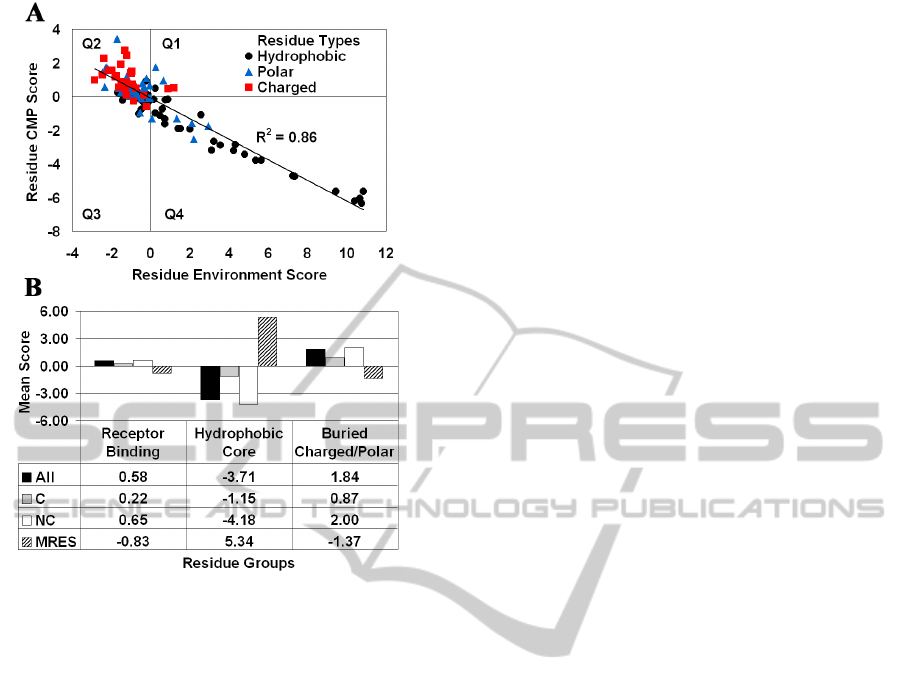
Figure 4: (A) CMP – potential profile correlation plot for
IL-3 segregates residues by polarity. (B) Effective
discrimination of the functional and structural roles carried
out by groups of IL-3 amino acid positions.
based on their activity (out of four classes) as well as
their residual scores. Using two categories of
residual scores (negative, non-negative), a chi-
square test applied to the resulting 4×2 table leads us
to reject the null hypothesis that no association
exists between activity level and residual scores (p <
0.01). Based on four residual score categories
(interval boundaries at -0.5, 0, and 0.5), a 4×4 table
is generated that yields a similar result (p < 0.0001).
3.2 Classification of Human IL-3
Residue Positions
A strong inverse correlation (R
2
= 0.86) exists
between the CMP profile for human IL-3, obtained
by averaging the residual scores of all amino acid
replacements at each position, and the 3D-1D
potential profile of the protein, which provides an
environment score for each position (Figure 4A). By
separately averaging residual scores of the non-
conservative (NC) and conservative (C) substitutions
at each position, a modified NC-CMP profile is
computed that is equally inversely correlated with
the 3D-1D potential profile (R
2
= 0.87) and reflects
the significant contribution of NC substitutions,
while a markedly diminished correlation is observed
with the modified C-CMP profile (R
2
= 0.42). The
plot in Figure 4A for 112 residue positions of human
IL-3 reveals a clustering according to polarity, with
the vast majority of the charged and hydrophobic
amino acids occupying quadrants 2 and 4,
respectively, and polar residues scattered within a
relatively close range of the origin.
In total, 16 residue positions in human IL-3 have
been determined to be involved in binding to the IL-
3R cell surface receptor: S17, N18, D21, E22, T25,
G42, E43, Q45, D46, M49, R94, P96, R108, F113,
K116, and E119 (Bagley et al., 1996, Klein et al.,
1997). Additionally, based on solvent accessible
surface area (http://curie.utmb.edu/getarea.html)
calculations, the 24 positions most buried in the IL-3
structure consist of 18 hydrophobic residues, with
the remaining six amino acids being either charged
or polar. We characterize each of these three groups
based on both the mean of the residue environment
scores (MRES) of the positions in the group, as well
as the mean of the mutant residual scores (All, C,
NC) for all 19 residue replacements at all positions
in the group combined (Figure 4B). Figure 4B
clearly shows that our computational
characterization effectively distinguishes these
functional and structural groups of amino acid
positions from one another.
3.3 Prediction of Human IL-3
Activity Changes
As detailed earlier in the Materials and Methods, we
first derive feature vectors for all 2128 mutants of
human IL-3 due to single residue substitutions at
positions 14 – 125, each of which includes only
seven of the EC components selected from the
corresponding perturbation vector R
mut
as well as
other predictors. In particular, we first consider
feature vectors for the 630 experimental mutants of
IL-3, each of which also has an output attribute
classifying activity as either “unaffected” or
“affected”. Performance of the random forest (RF)
algorithm on this training set is evaluated based on
running ten iterations each of 10-fold cross-
validation (CV) and 66/34 stratified random split, as
well as leave-one-out CV (LOOCV), with relatively
consistent results across all three testing methods
(Table 1). All MCC values are statistically different
from zero (p < 0.0001), indicating that predictions
are notably more correlated with the data compared
to random guessing. Table 1 also reveals that our
method outperforms by wide margins those of the
BIOINFORMATICS 2011 - International Conference on Bioinformatics Models, Methods and Algorithms
98

SIFT (http://sift.jcvi.org/) (Ng and Henikoff, 2006)
and SNAP (http://cubic.bioc.columbia.edu/services/)
(Bromberg and Rost, 2007) state-of-the-art servers
that utilize information derived from multiple
sequence alignments. Since our model does not
incorporate evolutionary information, it serves as an
orthogonal approach that is complementary to these
other methods.
Table 1: RF model performance and comparisons with
other methods.
Method Q MCC BER AUC
10-fold
CV*
0.79±0.01 0.54±0.01 0.23±0.01 0.83±0.01
66/34
split*
0.79±0.02 0.53±0.05 0.24±0.02 0.84±0.02
LOOCV 0.80 0.55 0.23 0.83
SIFT 0.59 0.26 0.37 ---
SNAP 0.68 0.33 0.33 ---
* average over ten iterations.
Figure 5: (A) Distribution of 10-fold CV RF prediction
performance over 1,000 permutations (random shuffles) of
the mutant IL-3 activity class labels. (B) Learning curves.
Error bars represent ± 1 std. dev. from the mean.
For a systematic approach to assessing the
statistical significance of our results in Table 1, we
generate 1,000 activity class label permutations
(random shuffles) and calculate the 10-fold CV
performance in each case based on the RF algorithm.
The distributions of MCC and BAR accuracy
measurements (Figure 5A) are narrowly centered
around zero and 0.5, respectively (MCC = 0.00 ±
0.04, BAR = 0.50 ± 0.02), with no permutation
accuracy near those obtained using the original
arrangement of the class labels (Table 1: MCC =
0.54 ± 0.01, and BAR = 1 – BER = 0.77 ± 0.01), so
the p-value for predictive power is less than 0.001.
Next, we undertake a detailed evaluation of the
LOOCV predictions on the 630 mutants of human
IL-3 in order to assess the strengths and weaknesses
of our methodology. In particular, the approach
performs best when polar and charged amino acids
are replaced with apolar residues, and vice versa,
while the least accurate predictions occur with
residue substitutions of the same polarity (Table 2).
Additionally, although overall accuracy (Q) for
surface position mutations appears to surpass that of
buried positions (Table 3), contradicting
observations noted by other researchers (Bromberg
and Rost, 2007, Capriotti et al., 2006), the surface
mutations constitute a smaller percentage of the
dataset, and their lower correlation coefficient
(MCC) suggests those correct predictions may be
more biased toward one activity class at the expense
of the other. Finally, there are nearly twice as many
mutations in helices as there are in coils, and the
helix mutation predictions are more accurate.
Table 2: LOOCV prediction performance based on side
chain polarities of the native and new amino acids at the
mutated position.
native / new
Polar Apolar Charged
Q MCC Q MCC Q MCC
Polar 0.71 0.16 0.85 0.47 0.80 0.24
Apolar 0.84 0.69 0.70 0.39 0.88 0.76
Charged 0.83 0.65 0.90 0.80 0.59 0.18
Table 3: LOOCV prediction performance based on depth
and secondary structure.
Depth Q MCC %
Buried 0.78 0.56 42
Undersurface 0.77 0.50 27
Surface 0.84 0.48 31
Secondary Structure Q MCC %
Helix 0.80 0.58 64
Coil 0.79 0.48 36
% refers to the proportion of IL-3 mutants in the dataset.
In order to assess the influence of dataset size on
trained RF model performance, learning curves are
provided in Figure 5B. We begin by applying RF
learning and 10-fold CV to each of 10 stratified
MODELING CELL PROLIFERATION ACTIVITY OF HUMAN INTERLEUKIN-3 UPON SINGLE RESIDUE
REPLACEMENTS
99
random samples of 100 dataset mutants, where each
subset is selected from among all 630 experimental
human IL-3 activity mutants, and mean performance
and standard deviation (std. dev.) is calculated.
Subsequent iterations involve incrementing by 50
mutants the size of the sampled datasets. The
learning curves do not appear to reach plateaus as
they approach the full dataset size of 630 mutants,
suggesting that the current RF model may be
improved upon by enlarging the training set through
possible future availability of experimental activity
data for additional IL-3 mutants.
The CfsSubsetEval attribute evaluator program in
WEKA is a tool for identifying the most influential
feature vector attributes (Frank et al., 2004). The
method evaluates various subsets of the attributes for
how highly correlated the predictors in each subset
are with the unaffected / affected activity classes
while also displaying low intercorrelation with one
another. The BestFirst search program in WEKA is
concurrently used to select the subsets for evaluation
based on a greedy hill-climbing approach, whereby
starting with a random selection of attributes, a bi-
directional search ensues in which all possible
additions or deletions of single attributes are
examined at each step (Frank et al., 2004). The
procedure is augmented with backtracking, whereby
a maximum of five consecutive, non- improving
attributes are allowed. The following ten attributes
are identified as the most highly ranked predictors:
position number; residual score; EC scores at the
second, third, and fifth nearest neighbors; primary
sequence locations of the fourth and sixth nearest
neighbors relative to the mutated position; amino
acid identity at the sixth nearest neighbor to the
mutated position; mean volume; and mean
tetrahedrality. These ten attributes span the diversity
of predictors considered in this study, underscoring
the importance of the collective set of features.
Finally as an important practical application, we
employ the RF model learned from the entire
training set of 630 mutants of human IL-3 in order to
predict the unaffected / affected class memberships
of all remaining 1498 uncharacterized single residue
IL-3 mutants. In particular, we form a test set that
contains feature vector input attributes for the 1498
mutants of IL-3 that remain to be predicted, each of
which has an unknown unaffected / affected activity
class output attribute. Based on the signals encoded
by the input attributes of their feature vectors, the
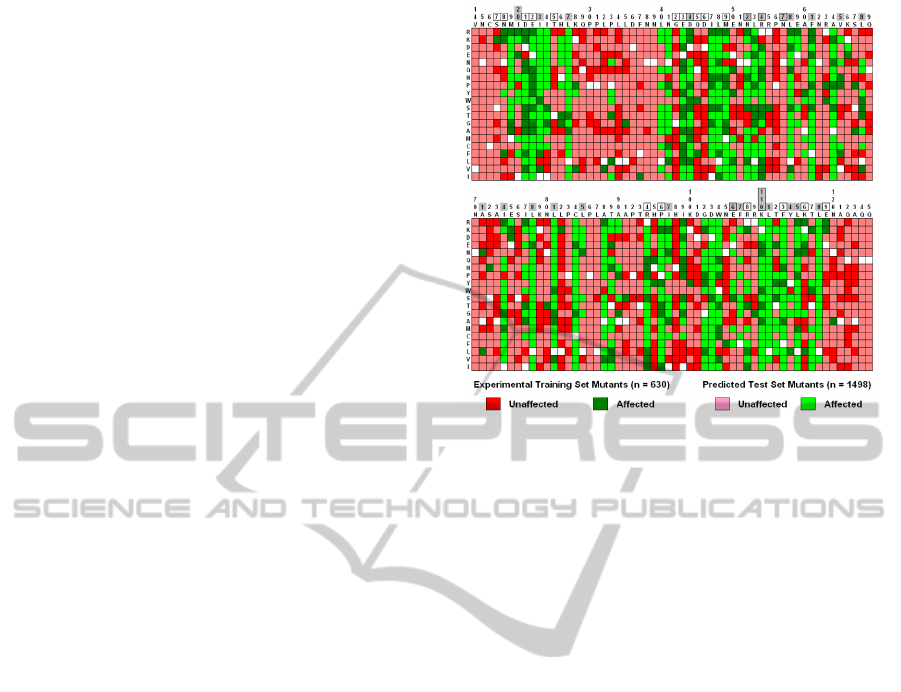
Figure 6: Human IL-3 mutational array (red = unaffected,
green = affected, white = self-substitutions; darker colors
= experimental, lighter = predicted; boxed numbers =
receptor binding, shaded = hydrophobic core, both shaded
and boxed = buried charged / polar).
RF model generates a class prediction for every IL-3
mutant in the test set. All experimental and predicted
IL-3 mutants are pooled into the array shown in
Figure 6, which concisely summarizes overall
protein mutational patterns. Columns represent
residue positions in IL-3, and rows represent the 20
possible amino acid replacements, arranged from top
to bottom in order of increasing hydrophobicity
(Kyte and Doolittle, 1982). Notably, at nearly all
receptor-binding positions for which a number of
amino acid substitutions are known to affect activity,
predictions match experimental IL-3 mutant data.
4 CONCLUSIONS
This study demonstrates the utility of a
computational mutagenesis methodology, based on
implementations of a four-body potential and the
Delaunay tessellation of protein structure, for
modeling single residue replacements in the human
interleukin-3 (IL-3) cytokine. For each IL-3 mutant,
the approach quantifies environmental perturbation
at the mutated position (i.e., the residual score) and
at all positions in its neighborhood, as defined by the
tessellation of the IL-3 protein structure. Published
experimental data include relative changes in cell
proliferation activity for 630 single residue
substitutions of IL-3, representing nearly 30% of all
such mutants in the protein. An IL-3 structure-
BIOINFORMATICS 2011 - International Conference on Bioinformatics Models, Methods and Algorithms
100

function relationship is elucidated with this
collection of mutants by comparing their residual
scores (measures of relative changes to sequence-
structure compatibility) with their relative activity
changes (measures of relative functional changes).
More generally, residual scores are also useful for
naturally clustering IL-3 amino acid positions based
on their polarity, as well as for distinguishing
residue groups based on their functional or structural
roles. The experimental IL-3 mutants are
subsequently represented as feature vectors, with
input attributes that include the residual score,
ordered perturbation scores for the six structurally
closest positions in the local neighborhood of the
mutated position, and additional components based
on sequence and structure, as well as an activity
category (unaffected / affected) output attribute. This
collection of feature vectors is used to train a
random forest classifier, which displays up to 80%
accuracy for mutant IL-3 activity prediction and
outperforms other well-known methods. To assist
researchers in prioritizing future IL-3 mutagenesis
experiments, activity predictions based on the
trained model are provided for all 1498 unexplored
single residue IL-3 mutants.
REFERENCES
Bagley, C. J., Phillips, J., Cambareri, B., Vadas, M. A. and
Lopez, A. F. (1996) J Biol Chem, 271, 31922-31928.
Baldi, P., Brunak, S., Chauvin, Y., Andersen, C. A. and
Nielsen, H. (2000) Bioinformatics, 16, 412-424.
Barber, C. B., Dobkin, D. P. and Huhdanpaa, H. T. (1996)
ACM Trans Math Software, 22, 469-483.
Berman, H. M., Westbrook, J., Feng, Z., Gilliland, G.,
Bhat, T. N., Weissig, H., Shindyalov, I. N. and
Bourne, P. E. (2000) Nucleic Acids Res, 28, 235-242.
Bordner, A. J. (2008) Bioinformatics, 24, 2865-2871.
Bowie, J. U., Luthy, R. and Eisenberg, D. (1991) Science,
253, 164-170.
Breiman, L. (2001) Machine Learning, 45, 5-32.
Bromberg, Y. and Rost, B. (2007) Nucleic Acids Res, 35,
3823-3835.
Capriotti, E., Calabrese, R. and Casadio, R. (2006)
Bioinformatics, 22, 2729-2734.
Carter, C. W., Jr., LeFebvre, B. C., Cammer, S. A.,
Tropsha, A. and Edgell, M. H. (2001) J Mol Biol, 311,
625-38.
Dayhoff, M. O., Schwartz, R. M. and Orcut, B. C. (1978)
In Atlas of Protein Sequence and Structure, Vol. 5
(Ed, Dayhoff, M. O.) National Biomedical Research
Foundation, Washington D.C., pp. 345-352.
de Berg, M., Cheong, O., van Kreveld, M. and Overmars,
M. (2008) Computational Geometry: Algorithms and
Applications, Springer-Verlag, Berlin.
Fawcett, T. (2003) In Technical Report HPL-2003-4.
Hewlett-Packard Labs, Palo Alto.
Feng, Y., Klein, B. K. and McWherter, C. A. (1996) J Mol
Biol, 259, 524-541.
Frank, E., Hall, M., Trigg, L., Holmes, G. and Witten, I.
H. (2004) Bioinformatics, 20, 2479-2481.
Klein, B. K., Feng, Y., McWherter, C. A., Hood, W. F.,
Paik, K. and McKearn, J. P. (1997) J Biol Chem, 272,
22630-22641.
Kyte, J. and Doolittle, R. F. (1982) J Mol Biol, 157, 105-
132.
Ng, P. C. and Henikoff, S. (2006) Annu Rev Genomics
Hum Genet, 7, 61-80.
Olins, P. O., Bauer, S. C., Braford-Goldberg, S., Sterbenz,
K., Polazzi, J. O., Caparon, M. H., Klein, B. K.,
Easton, A. M., Paik, K., Klover, J. A. and et al. (1995)
J Biol Chem, 270, 23754-23760.
Pettersen, E. F., Goddard, T. D., Huang, C. C., Couch, G.
S., Greenblatt, D. M., Meng, E. C. and Ferrin, T. E.
(2004) J Comput Chem, 25, 1605-1612.
Qi, Y., Bar-Joseph, Z. and Klein-Seetharaman, J. (2006)
Proteins, 63, 490-500.
Sippl, M. J. (1993) J Comput Aided Mol Des, 7, 473-501.
Wang, G. and Dunbrack, R. L., Jr. (2003) Bioinformatics,
19, 1589-1591.
Zhang, S., Kaplan, A. H. and Tropsha, A. (2008) Proteins,
73, 742-53.
MODELING CELL PROLIFERATION ACTIVITY OF HUMAN INTERLEUKIN-3 UPON SINGLE RESIDUE
REPLACEMENTS
101
