
DETECTION OF GLYCATED HEMOGLOBIN USING
3-AMINOPHENYLBORONIC ACID MODIFIED GRAPHENE OXIDE
Siva Rama Krishna V., Bharadwaj Amrutur, Navakanta Bhat
Department of Electrical Communication Engineering & Center for Excellence in Nanoelectronics
Indian Institute of Science, Bangalore, India
Chakra Pani K., Sampath Srinivasan
Department of Inorganic Physical Chemistry, Indian Institute of Science, Bangalore, India
Keywords:
Graphene oxide, 3-Aminophenylboronic acid, Glycated hemoglobin, IR spectroscopy, Electrochemical
impedance spectroscopy.
Abstract:
This paper presents the chemical synthesis of 3-Aminophenylboronic acid (APBA) modified graphene oxide
(GO) and its application to the electrochemical detection of glycated hemoglobin (GHb). The compound
(GO-APBA) was synthesized by forming an amide linkage between the amino group (-NH
2
) of APBA and
the carboxylic group (-COOH) of GO. The compound was characterized using IR spectroscopy. Detection of
GHb was carried out using Electrochemical Impedance Spectroscopic (EIS) measurements with GO-APBA
modified glassy carbon electrode as the working electrode.
1 INTRODUCTION
Affinity of glycated proteins and saccharides towards
boronic acid compounds is exploited quite exten-
sively in designing sensors for them (Takahashi and
Anzai, 2005; Fang et al., 2004; Zhao et al., 2009;
Rohovec et al., 2003; Liu et al., 2006; Son and
Yoon, 2008). The cis-diol bonds of these compounds
interact with boronic acids to form boronate esters
(Springsteen and Wang, 2002). D-glucose, the pri-
mordial saccharide in blood, undergoes a slow non-
enzymatic irreversiblereaction with hemoglobin (Hb)
to form glycated hemoglobin. The reaction hap-
pens throughout the life cycle time of erythrocyte
(RBC), which is 120 days. Measuring the concen-
tration of glycated hemoglobin as a percentage of to-
tal hemoglobin gives the average value of glucose
present in the blood over 120 days. The clinical ref-
erence range is between 4 and 20% with 4-6% being
considered as normal. Glycated hemoglobin test is
considered as gold standard for the long term moni-
toring of diabetes (Peterson et al., 1998). A dispos-
able, low cost biosensor will be handy in achieving
glycemic control, thereby reducing the risk of cardio-
vascular, retinal, renal complications that occur due to
improper control of glycemia. The present clinical
methods of measuring GHb include immunoassay,
ion-exchange chromatography (Halwachs-Baumann
et al., 1997), electrophoresis (Menard et al., 1980),
boronate affinity chromatography (Fl¨uckiger et al.,
1984), and high pressure liquid chromatography
along with electrospray ionization mass spectrome-
try (Jeppsson et al., 2002). The equipments used in
these techniques are bulky and the procedures are
time consuming and are not cost effective. Frank
Frantzen et al., have reported a table top GHb mea-
surement unit based on boronate affinity and col-
orimetry (Frantzen et al., 1997). This is also not cost
effective due to the use of optics. Electroanalytical
techniques have a unique advantage of having elec-
trical signals as both input and output. A dispos-
able sensor with a handheld electronic device similar
to that of a glucometer can be easily achieved using
this sensing methodology. Liu et al., have used fer-
roceneboronic acid to detect GHb(Liu et al., 2006).
The whole process is based on adsorption of Hb/GHb
onto Zirconia nanoparticles and is time consuming.
Son et al., have fabricated a lab on chip for the de-
termination of GHb (Son and Yoon, 2008). They
used m-aminophenyl boronic acid agarose beads to
bind GHb. The chip involves a complex fabrication
process. Park et al., formed a self assembled mono-
109
V. S., Amrutur B., Bhat N., K. C. and Srinivasan S..
DETECTION OF GLYCATED HEMOGLOBIN USING 3-AMINOPHENYLBORONIC ACID MODIFIED GRAPHENE OXIDE.
DOI: 10.5220/0003125401090113
In Proceedings of the International Conference on Biomedical Electronics and Devices (BIODEVICES-2011), pages 109-113
ISBN: 978-989-8425-37-9
Copyright
c
2011 SCITEPRESS (Science and Technology Publications, Lda.)
layer of thiophene-3-boronic acid to detect GHb. The
substrate used was gold which is not suited for low
cost applications. Carbon-based materials are bio-
compatible and cost effective. They have been ex-
tensively used in various electroanalytical techniques
to detect bio-molecules (Privett et al., 2008). Among
these, graphene has received much attention due to
its extraordinary electrical, thermal and mechanical
properties (Geim and MacDonald, 2007; Geim and
Novoselov, 2007). Graphene and its oxidized form,
graphene oxide (GO) have been extensively explored
for sensor applications (Schedin et al., 2007; Zuo
et al., 2009; Sun et al., 2008). GO has hydroxyl and
epoxy functional groups on the hexagonal network of
carbon atoms with carboxyl groups at the edges. The
presence of carboxylic group provides the possibility
of amide bond formation with an amine group. In this
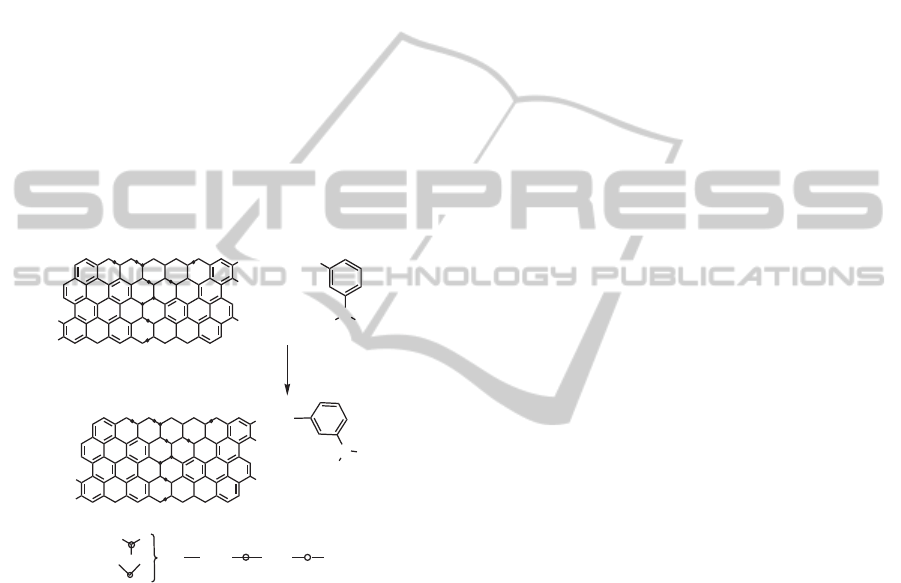
work 3-aminophenylboronic acid (APBA) is chemi-
cally attached to carboxyl groups of GO as shown in
the Figure 1 and used in the detection of GHb.
COOH
COOH
COOH
HOOC
HOOC
=
OH
=
B
OHHO
H
2
N
CONH
COOH
COOH
HOOC
HOOC
B
OH
HO
+
EDC
GO
APBA
Figure 1: Schematic representation of amide linkage forma-
tion enabled by coupling reagent EDC.
2 EXPERIMENTAL
2.1 Chemicals
Natural graphite was obtained from Stratmin
graphite co., USA., N-(3-Dimethylaminopropyl)-
N’-ethylcarbodiimide hydrochloride (EDC), 3-
AminoPhenylboronic acid (APBA) were procured
from Sigma, USA. All other chemicals were procured
from Merck, India and used without further purifica-
tion. All the solutions and buffers were prepared in
Millipore water with 18MΩ-cm resistivity.
2.2 Apparatus and Measurements
FTIR measurements were carried using Perkin Elmer
FT-IR Spectrometer. UV-Vis spectroscopy was car-
ried out using Perkin Elmer 35 UV-Vis spectrom-
eter. EIS measurements were carried out using
electrochemical workstation CHI660C, CH instru-
ments, USA. The electrochemical system used con-
sists of modified glassy carbon electrode as the work-
ing electrode, platinum foil as the counter electrode,
standard calomel electrode (SCE) as the reference
electrode and 0.15 mM phosphate buffer (pH 8.0) as
the supporting electrolyte.
2.3 Synthesis
Graphene oxide was synthesized from exfoliated
graphite using modified Hummers method (Ramesh
et al., 2004). Chemical modification of GO with
APBA was carried out as follows. Required amount
of GO and EDC were added to DI water and was
stirred continuously for 36 hrs. EDC is a coupling
reagent which aids in the formation of amide bond.
After the stirring, of APBA was added to the mixture
and stirred at room temperature for another 24 hrs.
The suspension was filtered and washed several times
with water and ethanol, to remove any physically ad-
sorbed APBA. The material was then dried in vacuum
using silicagel. The product was then characterized
using IR spectroscopy. For the EIS measurements, the
compound was dispersed in DI water and drop coated
onto a cleanly polished glassy carbon electrode.
2.4 Electrochemical Impedance
Spectroscopy
A glassy carbon electrode (GCE) (3mm dia.) was pol-
ished with 0.05µm alumina and washed thoroughly
with DI water. Depending on the experiment GO or
GO-APBA dispersion was drop cast on the electrode
and was allowed to dry for 2 hours. Impedance mea-
surements were carried out in 0.15 mM phosphate
buffer (pH 8.0, 3mL volume) containing 2.5 mM each
of K
4
Fe(CN)
6
and K
3
Fe(CN)
6
.The modified GCE
was used as working electrode. A potential of 0.2V
was applied between the working electrode and the
SCE. The impedance offered by the electrode for the
electron transfer was measured between the working
and counter electrodes. Freshly prepared hemoglobin
of known concentration was added in 30 µl steps to
this solution. Nyquist plots and the extraction of elec-
trical parameters were done using the software pro-
vided by the CH instruments.
BIODEVICES 2011 - International Conference on Biomedical Electronics and Devices
110
2.5 Hemoglobin Preparation
Ethylenediaminetetraacetic acid (EDTA) coated
blood sample pool of diabetic patients were collected
from Health Centre of Indian Institute of Science.
Plasma and leukocytes were removed by centrifuging
the sample at 5000 rpm for 5 min. The supernatant
was discarded. The remaining erythrocyte cells were
washed three times with 0.9% NaCl. The cells were
then lysed by adding 8 volumes of ice cold DI water
to one volume of cell solution. After lysis, the mix-
ture was centrifuged at 12000 rpm for 10 min. The
cell debris settles at the bottom of the centrifuge tube.
The supernatant was collected, labeled and stored at
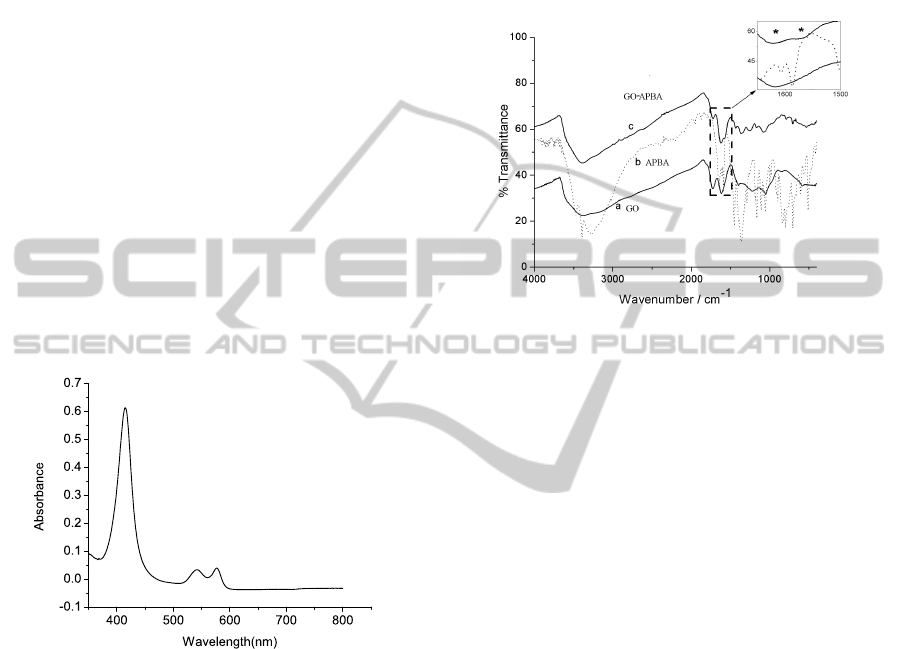
-20°Cfor further use. UV-Visible spectroscopy was
carried to find out the concentration of hemoglobin.
Based on the absorbance at 541nm Figure 2 and
Beer-Lambart’s law, the concentration of hemoglobin
was found to be 240 µM (Faniran and Shurvell,
1968). Based on the measurements carried in the
health centre, the glycated hemoglobin was found out
be 8% of the total hemoglobin.
Figure 2: UV-Visible Spectrum of Hb.
3 RESULTS & DISCUSSION
3.1 IR Spectroscopy
IR spectroscopy was carried out to confirm the forma-
tion of amide bond between the amine group of APBA
and carboxylic group of GO. Figure 3 shows the IR
spectra of all the compounds. The region of interest
is between 1640 cm
−1
and 1580 cm
−1
. In the case
of GO, the band at 1617 cm
−1
corresponds to aro-
matic C=C stretching (Faniran and Shurvell, 1968).
In APBA the bands at 1608 cm
−1
and 1586 cm
−1
cor-
respond to C=C stretching as well as N-H stretching
(Faniran and Shurvell, 1968; Silverstein and Bassler,
1962). In the case of the synthesized compound new
bands appearing at 1625 cm
−1
and 1580 cm
−1
cor-
respond to amide-I band and amide-II stretching re-
spectively (Silverstein and Bassler, 1962). This con-
firms the covalent modification of GO with APBA.
The other bands also match with the existing litera-
ture values (Silverstein and Bassler, 1962; Park et al.,
2009; Bard and Faulkner, 2006).
Figure 3: IR spectrum of (a) GO , (b) APBA (c) GO-APBA;
( Inset: Expanded region 1650 cm
−1
to 1500 cm
−1
. The
amide bands are labeled with a ‘
*
’).
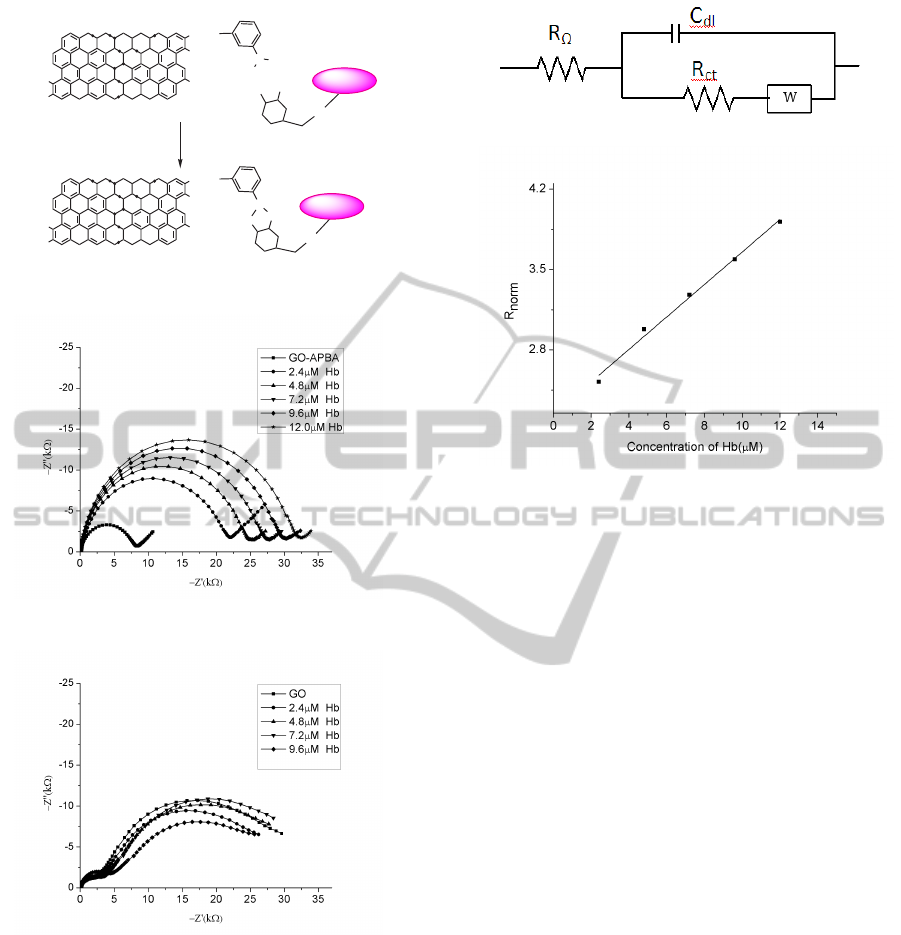
3.2 Electrochemical Impedance
Spectroscopy: Detection of GHb
The interaction of GHb with GO-APBA compound
is shown in Figure 4. When GO-APBA modified
glassy carbon is used as working electrode GHb
gets immobilized on to the electrode surface through
affinity of cis-diol bonds of glucose to boronic
acid moiety. The chemical adsorption of GHb in-
hibits the electron transfer rate of the redox cou-
ple [Fe(CN)
6
]
3−
/[Fe(CN)
6
]
4−
thereby increasing the
charge transfer resistance (R
ct
). The Nyquist plots
are shown in Figure 5. The diameter of the semicir-
cle which is R
ct
, increases with increase in the con-
centration of Hb. In order to eliminate the possible
reason that physisorption may play a role in increase
R
ct
, an experiment was perfomed using GO modified
GCE. The corresponding Nyquist plots are shown in
the Figure 6. The variation in R
ct
is small and is
not systematic in this case. This proves that the in-
crease in the charge transfer resistance is only due to
the chemisorption of GHb onto the electrode surface.
Hence this method can be used for detecting GHb.
3.3 Linearity
R
ct
is calculated from Nyquist plots by fitting the
curve with parameters in the Randles circuit shown
in Figure 7 (Bard and Faulkner, 2006). R is the so-
lution resistance and C
dl
is the double layer capaci-
DETECTION OF GLYCATED HEMOGLOBIN USING 3-AMINOPHENYLBORONIC ACID MODIFIED GRAPHENE
OXIDE
111
CONH
COOH
COOH
HOOC
HOOC
B
OH
HO
NH
HO
OH
+
Hb
CONH
COOH
COOH
HOOC
HOOC
B
NH
O
O
Hb
GO-APBA
GHb
Figure 4: Schematic representation of GO-APBA and GHb
interaction.
Figure 5: Impedance data obtained for GO-APBA modified
GCE before and after the addition of Hb.
Figure 6: Impedance data obtained for GO modified GCE
before and after the addition of Hb.
tance. The values of R
ct
with Hb were normalized to
R
c
t without Hb and are denoted by R
norm
. The varia-
tion of R
norm
with respect to the concentration of Hb
is shown in Figure 8 and it is linear. The concentra-
tion of Hb used in the present studies are in µM range
which implies that the concentration of GHb is in the
range of nM (8% of Hb).
Figure 7: Randles’ Circuit.
Figure 8: Variation of normalized charge transfer resistance
with respect to concentration of Hb.
4 CONCLUSIONS
Chemical synthesis of APBA modified GO was car-
ried out and was characterized with IR spectroscopy.
GCE surface modified with GO-APBA complex was
used to detect GHb using EIS. EIS results indicate
good sensitivity and linearity in the electrochemical
activity of GHb with respect to its concentration. En-
couraged by these results, we are currently fabricating
and testing GO-APBA modified screen printing elec-
trodes. Our efforts in this direction will result in a low
cost disposable GHb sensor.
ACKNOWLEDGEMENTS
we acknowledge sponsorship of this project by Soci-
ety for Biomedical Technology (SBMT), Bangalore,
India.We also acknowledgethe help from HealthCen-
tre, Indian Institute of Science four supporting us by
giving necessary blood samples for our experiments.
REFERENCES
Bard, A. and Faulkner, L. (2006). Electrochemical methods:
fundamentals and applications. Wiley.
Fang, H., Kaur, G., and Wang, B. (2004). Progress in
boronic acid-based fluorescent glucose sensors. Jour-
nal of Fluorescence, 14(5):481–489.
BIODEVICES 2011 - International Conference on Biomedical Electronics and Devices
112

Faniran, J. and Shurvell, H. (1968). Infrared spectra
of phenylboronic acid (normal and deuterated) and
diphenyl phenylboronate. Canadian Journal of Chem-
istry, 46(12):2089–2095.
Fl¨uckiger, R., Woodtli, T., and Berger, W. (1984). Quantita-
tion of glycosylated hemoglobin by boronate affinity
chromatography. Diabetes, 33(1):73.
Frantzen, F., Grimsrud, K., Heggli, D., Faaren, A., Lovli, T.,
and Sundrehagen, E. (1997). Glycohemoglobin filter
assay for doctors’ offices based on boronic acid affin-
ity principle. Clinical chemistry, 43(12):2390.
Geim, A. and MacDonald, A. (2007). Graphene: Exploring
carbon flatland. Physics Today, 60:35.
Geim, A. and Novoselov, K. (2007). The rise of graphene.
Nature materials, 6(3):183–191.
Halwachs-Baumann, G., Katzensteiner, S., Schnedl, W.,
Purstner, P., Pieber, T., and Wilders-Truschnig, M.
(1997). Comparative evaluation of three assay sys-
tems for automated determination of hemoglobin A1c.
Clinical chemistry, 43(3):511.
Jeppsson, J., Kobold, U., Barr, J., Finke, A., Hoelzel,
W., Hoshino, T., Miedema, K., Mosca, A., Mauri,
P., Paroni, R., et al. (2002). Approved IFCC refer-
ence method for the measurement of HbA1c in human
blood. Clinical Chemistry and Laboratory Medicine,
40(1):78–89.
Liu, S., Wollenberger, U., Katterle, M., and Scheller, F.
(2006). Ferroceneboronic acid-based amperometric
biosensor for glycated hemoglobin. Sensors and Ac-
tuators B: Chemical, 113(2):623–629.
Menard, L., Dempsey, M., Blankstein, L., Aleyassine, H.,
Wacks, M., and Soeldner, J. (1980). Quantitiative de-
termination of glycosylated hemoglobin A1 by agar
gel electrophoresis. Clinical Chemistry, 26(11):1598.
Park, S., Dikin, D., Nguyen, S., and Ruoff, R. (2009).
Graphene Oxide Sheets Chemically Cross-Linked by
Polyallylamine. The Journal of Physical Chemistry C,
113(36):15801–15804.
Peterson, K., Pavlovich, J., Goldstein, D., Little, R., Eng-
land, J., and Peterson, C. (1998). What is hemoglobin
A1c? An analysis of glycated hemoglobins by elec-
trospray ionization mass spectrometry. Clinical chem-
istry, 44(9):1951.
Privett, B., Shin, J., and Schoenfisch, M. (2008).
Electrochemical sensors. Analytical chemistry,
80(12):4499–4517.
Ramesh, P., Bhagyalakshmi, S., and Sampath, S. (2004).
Preparation and physicochemical and electrochemical
characterization of exfoliated graphite oxide. Journal
of colloid and interface science, 274(1):95–102.
Rohovec, J., Maschmeyer, T., Aime, S., and Peters, J.
(2003). The structure of the sugar residue in glycated
human serum albumin and its molecular recognition
by phenylboronate. Chemistry–A European Journal,
9(10):2193–2199.
Schedin, F., Geim, A., Morozov, S., Hill, E., Blake, P., Kat-
snelson, M., and Novoselov, K. (2007). Detection of
individual gas molecules adsorbed on graphene. Na-
ture Materials, 6(9):652–655.
Silverstein, R. and Bassler, G. (1962). Spectrometric iden-
tification of organic compounds. Journal of Chemical
Education, 39(11):546.
Son, S. and Yoon, H. (2008). Electrochemical analysis of
glycated hemoglobin based on the biospecificity and
electron-transferring capability of ferroceneboronic
acid. BioChip J, 2:116–122.
Springsteen, G. and Wang, B. (2002). A detailed examina-
tion of boronic acid-diol complexation. Tetrahedron,
58(26):5291–5300.
Sun, X., Liu, Z., Welsher, K., Robinson, J., Goodwin, A.,
Zaric, S., and Dai, H. (2008). Nano-graphene oxide
for cellular imaging and drug delivery. Nano research,
1(3):203–212.
Takahashi, S. and Anzai, J. (2005). Phenylboronic acid
monolayer-modified electrodes sensitive to sugars.
Langmuir, 21(11):5102–5107.
Zhao, Y., Luo, H., and Li, N. (2009). Electrochemical
characterization of in situ functionalized gold p-
aminothiophenol self-assembled monolayer with 4-
formylphenylboronic acid for recognition of sugars.
Sensors and Actuators B: Chemical, 137(2):722–726.
Zuo, X., He, S., Li, D., Peng, C., Huang, Q., Song, S.,
and Fan, C. (2009). Graphene Oxide-Facilitated Elec-
tron Transfer of Metalloproteins at Electrode Sur-
faces. Langmuir, 26(3):1936–1939.
DETECTION OF GLYCATED HEMOGLOBIN USING 3-AMINOPHENYLBORONIC ACID MODIFIED GRAPHENE
OXIDE
113
