
WEARABLE BLOOD PRESSURE MONITORING SYSTEM
Case Study of Multiplatform Applications for Medical Use
Maxime Labat, Guillaume Lopez, Masaki Shuzo, Ichiro Yamada
The University of Tokyo, School of Engineering, 7-3-1 Hongo, Bunkyo-ku, Tokyo 113-8656, Japan
Yasushi Imai, Shintaro Yanagimoto
The University of Tokyo Hospital, Department of Internal Medicine, 7-3-1 Hongo, Bunkyo-ku, Tokyo 113-8655, Japan
Keywords:
Wearable physiological sensors, Non-invasive blood pressure monitoring, Mobile healthcare device.
Abstract:
Blood pressure measurement methods used nowadays have considerable drawbacks, as non-invasive measure-
ments are non-continuous while invasive measurements are confined to in-hospital use. In this paper, we ex-
pose our solution of a continuous, non-invasive blood pressure measurement method, using electrocardiogram
(ECG) and photopletysmograph (PPG) as a basis of calculation. We present the two applications we designed
in order to collect, process, display and monitor the gathered information accurately. A mobile application,
using a smartphone connected to a sensor data logging device, is in charge of controlling data acquisition from
wearable sensors, displaying general information and signals for real-time monitoring. A desktop application
is designed to perform more detailed processing and complex analysis on the recorded data and is therefore
aimed at doctors and/or researchers.
1 INTRODUCTION
In an attempt to prevent frequent lifestyle-related dis-
eases, the authorities in charge of health in various
countries are seeking efficient ways to detect this kind
of problems at an early stage. One of the possible so-
lutions is to develop new wearable instruments able
to measure or monitor physiological data during daily
activities. Since blood pressure (BP) is a good indi-
cator for potential cardiovascular disorders and circu-
latory system diseases, it requires constant attention
and an efficient monitoring system.
The methods of measuring blood pressure used
nowadays are usually of two types :
• Though Ambulatory Blood Pressure Monitoring
(ABPM) devices are non-invasive and designed
for home use, they suffer from the non-continuity
of their data. Indeed, blood pressure measurement
with an ABPM device takes dozens of seconds,
and can only be repeated every two minutes at
most. In addition, it is rather uncomfortable and
as it requires users keeping their arm in a defined
position, it tends to be inappropriate for use dur-
ing effort and most daily activities.
• Arterial blood pressure measurement method al-
lows continuous measures and has reliable results,
but is not usable at home and does not allow any
movement, making it unsuitable for most applica-
tions. Furthermore, it introduces a significant risk
of infection and injury.
In this context, previous works lead to other ways
of monitoring blood pressure continuously, but with
non-invasive methods such as a calculation based on
pulse and ECG data and using the Pulse Arrival Time
(PAT) value (Espina et al., 2008; Fung et al., 2004;
McCombie et al., 2007). So far, we have developed
and evaluated a new method to estimate accurately
blood pressure from PAT even during physical exer-
cises (Lopez et al., 2010). Based on the encourag-
ing experimental results of our new method, we have
been developing a wearable device capable of record-
ing physiological signals, processing them immedi-
ately to estimate beat to beat blood pressure, trans-
forming it into context adapted understandable infor-
mation, and returning feedback to its user (a patient
or a doctor, for example), while saving it for further
detailed analysis by other potential users (such as doc-
tors or researchers).
The objective of our research is to use this device
156
Labat M., Lopez G., Shuzo M., Yamada I., Imai Y. and Yanagimoto S..
WEARABLE BLOOD PRESSURE MONITORING SYSTEM - Case Study of Multiplatform Applications for Medical Use.
DOI: 10.5220/0003131301560163
In Proceedings of the International Conference on Health Informatics (HEALTHINF-2011), pages 156-163
ISBN: 978-989-8425-34-8
Copyright
c
2011 SCITEPRESS (Science and Technology Publications, Lda.)
in combination with applications targeted at specific
users, and be able to monitor blood pressure in a non-
invasive, continuous way both for medical and daily
life use.
This paper is organized as follows; section 2 in-
troduces our system, explains its target and specifica-
tions and how it differs from usual BP measurement
devices. Section 3 gives more information about the
applications designed to log and analyze the data from
the sensors. Section 4 explains how we adapt the user
interface of our mobile device so that it gives immedi-
ate feedback to its user. Section 5 mentions encoun-
tered issues and improvements ideas that will be re-
alized in a near future and will most probably give a
second dimension to this project.
2 SYSTEM OVERVIEW
In this section, we will try to give a precise, yet con-
cise explanation of this system’s design and the dif-
ferent features it has.
2.1 Design Concept
Our system has been designed as a complete solution
to keep track of blood pressure, from the end-user
(the monitored person) to the people able to under-
stand and process this data (usually doctors following
their patients or researchers trying to gather data for a
study). Using this approach, we decided to create two
distinct applications:
• a mobile application, gathering data from wear-
able sensors, processing this data using simple al-
gorithms, giving immediate feedback to its user
and saving the data to a memory card;
• a desktop application, using the data recorded
earlier for processing using more advanced algo-
rithms and calculation techniques.
2.2 Mobile Device and Sensors
Prototype
To fulfil the task of recording physiological data from
sensors, we used a device able to transform analog
ECG and PPG signals into digital data, then store
these data on a memory card while updating the user
interface, in our case an iPod touch
1
with a dedicated
application.
Conceived so that the iPod touch can be docked
on it, the device communicates with the latter through
1
iPod touch is a trademark of Apple Inc., registered in
the U.S. and other countries.
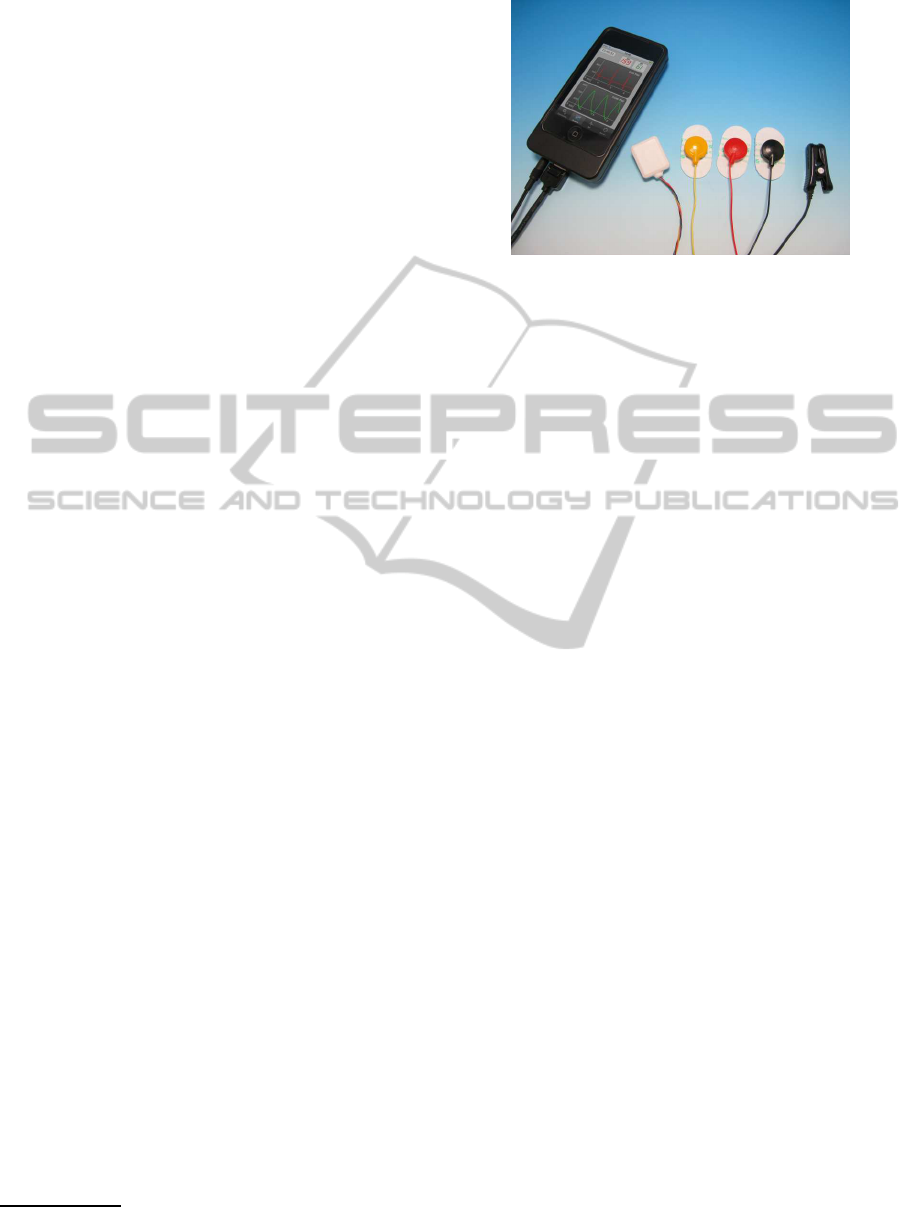
Figure 1: Overview of the mobile device.
the serial line of the Dock port. It includes an orig-
inal ECG and PPG sensor unit, capable of recording
data at a 1 kHz sampling rate, necessary condition to
ensure accurate estimation of high blood pressure val-
ues as during physical exercise for example. This unit
has the advantage of being able to synchronize pulse
and ECG signals, ensuring that the time difference be-
tween characteristic points of these signals is correct
with a millisecond accuracy.
The sensors used in our device and shown on fig-
ure 1 are the following:
• ECG signal is captured using a 3-electrode set-up,
each electrode having a distinctive color (Positive,
Negative and Earth electrodes) and connected to
the device through 3 wires, guaranteeing better ro-
bustness to motion artefacts;
• PPG is captured using an ear lobe sensor, con-
nected to the device using one wire; this sensor
measures pulse wave by transmitted-light plethys-
mography principle and using the ear lobe makes
the signal less prone to noise induced by body mo-
tion than frequently used finger PPG sensor (Mc-
Combie et al., 2008; Muehlsteff et al., 2008).
• acceleration values are captured using a 3-axis ac-
celerometer, again connected to our device using
one wire. Combined to motion recognition algo-
rithms it will enable detecting which activity trig-
gers blood pressure augmentation and which do
not have any effect.
The device itself has a microSD card module, to
which are logged files containing the sensor data dur-
ing acquisition and can also be used to write other
related files directly from the iPod touch.
Finally, the prototype has a three-states power
management switch. It is able to chargethe connected
iPod using the embedded battery on one position.
The two other positions are used to select whether
the micro-controller in charge of collecting the sen-
sor data and converting them to their digital format
WEARABLE BLOOD PRESSURE MONITORING SYSTEM - Case Study of Multiplatform Applications for Medical Use
157
will be powered on either manually or through mes-
sages sent on the serial line. This latter option adds
measure control flexibility and saves power when the
device is not acquiring data.
These features make our device different from
other non-invasive BP monitors, as seen when com-
paring the number 1 selling blood pressure monitor in
the U.S., Omron HEM-711AC with our blood pres-
sure monitoring prototype (see table 1).
Table 1: Characteristics comparison between our device
prototype and Omron HEM-711AC.
Our prototype HEM-711AC
Timing Continuous Punctual
Signals Acceleration, Pulse rate
ECG, PPG, HR, BP BP
Sampling ECG, PPG: 1 kHz 1 BP reading
rate HR, BP: 1 beat per 2-3 min.
Weight 250 grams 355 grams
Battery 2 consecutive 1500 readings w/
life hours ’AA’ battery x 4
Memory 4 days 60 readings
Our aim is not only monitoring these physiologi-
cal data, but also being able to prevent any related dis-
order. The design of this device reflects this objective,
by keeping the size of the unit as small as possible and
combining it with an easily adaptable terminal.
3 DATA LOGGING AND
ANALYSIS APPLICATIONS
The mobile application is used as a data accumula-
tion application and as a controller for the recording
device. When the data is saved, it can be used by
other applications. The desktop software we designed
is able to process the data and apply various analysis
algorithms.
3.1 Mobile Measurement Control
Application
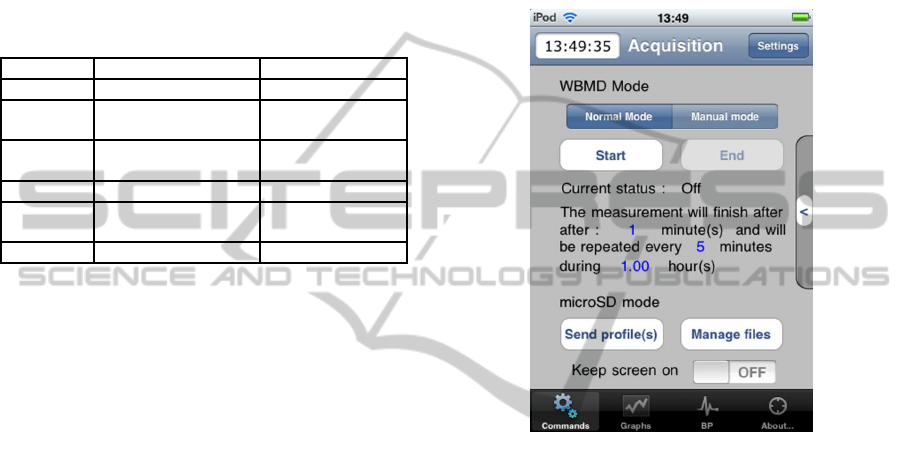
The Commands tab is the first screen you see when
starting the mobile application, and is the first of three
function tabs (figure 2). While the two other tabs
are aimed at visualizing the recorded data, this tab is
mainly used to issue commands to the data recording
device and manage the data files from previous acqui-
sitions.
The Commands tab is separated into two parts:
one is called WBMD mode and the other is microSD
mode. Both involve interaction with the logging
device, but while the former is used to trigger and
stop acquisition of data, the latter is used for file man-
agement on the microSD card. The choice between
these two modes is done by triggering a mechanical
switch on the logging device. Two other modes are
available, independently from the previous ones: one
is called normal mode, and is used when the logging
device’s power is controlled by the iPod touch; the
second one, manual mode, is used when the device’s
power is activated manually via a mechanical switch.
Figure 2: The Commands tab.
In WBMD mode, it is possible to start an acquisi-
tion campaign, which can be defined as:
• a single or multiple measurements, each one last-
ing a certain time span;
• in case several measurements are performed, they
are repeated at regular intervals, and stop after the
designated overall duration.
The uSD mode operations involve file manage-
ment on the device’s memory card. These operations
are mainly:
• writing patient profile information, making each
measurement correspond to a patient (see section
3.2 for more information);
• managing files on the memory card, i.e. deleting
unnecessary files or performing a backup of these
files on the iPod’s internal memory.
3.2 Settings Menu and Patient Profile
As the device can be used in several different situa-
tions, a settings menu was added to enable the user
specifying the measurement parameters easily.
HEALTHINF 2011 - International Conference on Health Informatics
158
Through this screen, the user can choose a set of
sensors to enable or disable, depending on the type
of information he needs; measurement duration and
repetition options are also available.
Finally, as the data files recorded on the device
only contain physiological data, it was necessary to
make each measurement correspond to a patient pro-
file, so that each set of data can be identified and clas-
sified accordingly to patient characteristics.
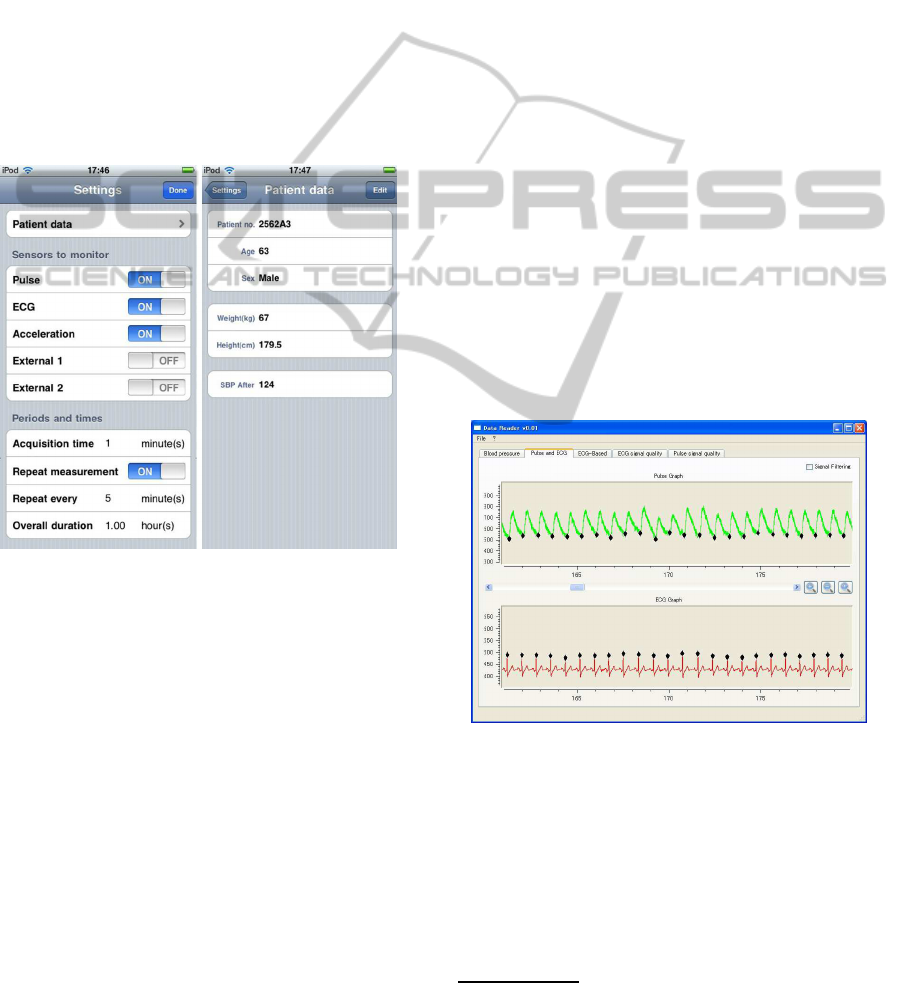
In order to achieve this goal, an interface designed
to specify crucial patient information was added in the
Settings menu (figure 3). Each measurement will trig-
ger the creation of an associated patient profile con-
taining the information filled in in this interface. They
are then written on the microSD card, using the pro-
cess mentioned in section 3.1.
Figure 3: The Settings and Patient data menus.
Thus, when the ID contained inside the patient
profile is compared to the database of the doctor, it
can be used for diagnostic, whereas the same data
used by a researcher can just give an outline of the
patient without revealing his identity and can be used
for data mining purposes.
3.3 Offline BP Analysis Application
The desktop application is a way for doctors and re-
searchers to process and review the data recorded
by the mobile device. As our mobile device lacks
some processing power for complex algorithms, and
its screen is not really adapted for reviewing large
data, we prepared an application executable on a per-
sonal computer which is able to import files and apply
algorithms on them.
In order to facilitate the programming and make the
use of the application easier, we decided to use Qt
2
framework for interface. Indeed, it is free and cross-
platform. Qt also offers the Qt Creator IDE which
makes interface design quicker and has good perfor-
mance components.
3.3.1 PPG and ECG Signal Display and Analysis
Before the calculation of blood pressure, the ECG
and PPG signals have to undergo some filtering al-
gorithms. Although the data logging device already
includes some band-pass filters, other noises can ap-
pear on the signals (for instance, noise due to power
lines). We chose to use a simple Fast Fourier Trans-
form (FFT) filter, for its good computing speed and
zero-phase filtering properties. Once this filtering step
is cleared, the signal is processed by the blood pres-
sure algorithm designed to determine the ECG peaks
and the PPG foot points.
Figure 4 shows the screen displaying the filtered
ECG and PPG graphs with additional marks pinpoint-
ing the results of the blood pressure algorithm calcu-
lation. A zooming function can also help a doctor to
identify eventual cardiac troubles, such as arrhythmia.
It can also help to correct eventual calculation errors
manually.
Figure 4: The filtered ECG and pulse graphs with features
detection result.
3.3.2 Heart Rate Analysis
By determining the position of ECG peaks, it is pos-
sible to calculate heart rate values accurately. In-
deed, heart rate is an interesting indicator for both un-
healthy patients, for example with cardiac disorders,
and healthy people.
2
Qt is a trademark of Nokia Corporation in Finland
and/or other countries worldwide.
WEARABLE BLOOD PRESSURE MONITORING SYSTEM - Case Study of Multiplatform Applications for Medical Use
159
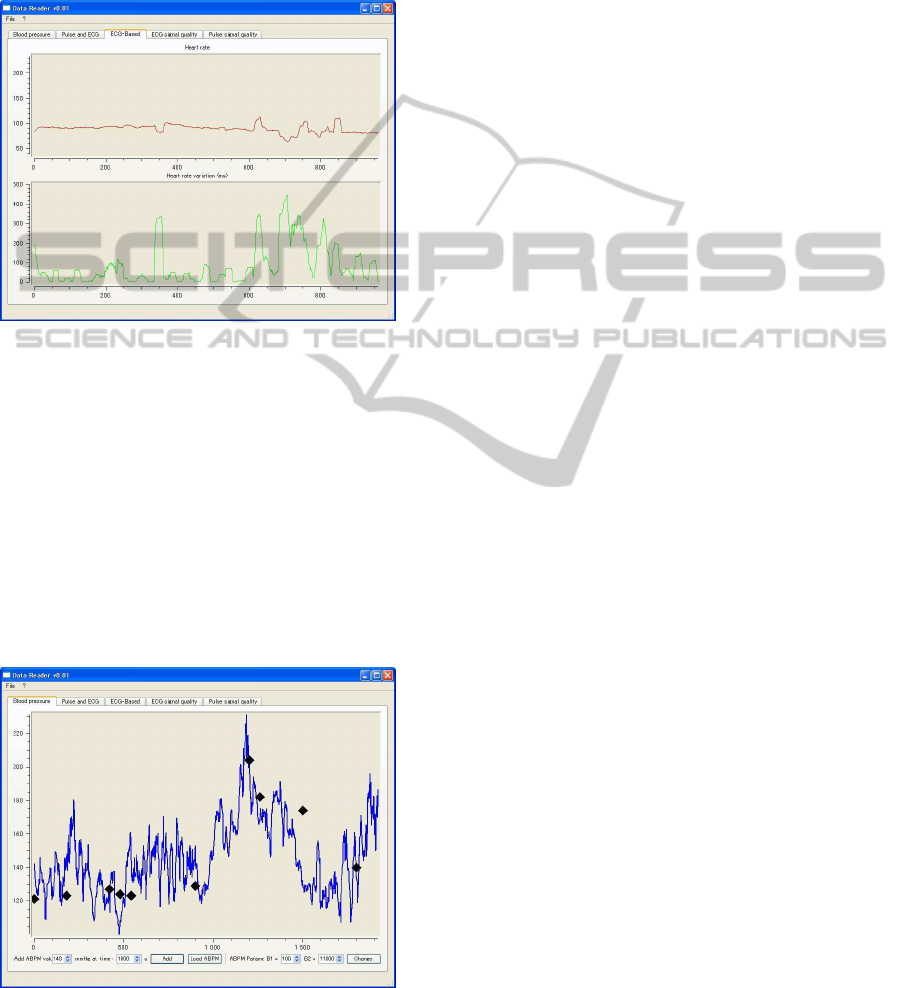
Additionally, former studies showed that psycho-
logical state changes are reflected in the heart rate
variability (HRV) and can be successfully monitored
(Itao et al., 2008). Based on these observations, we
added two graphs showing heart rate and its variations
over time (figure 5).
Figure 5: The heart rate and HRV visualization.
3.3.3 Blood Pressure Visualization
As our main objective is to monitor blood pressure
efficiently, the top feature of the application is to cal-
culate blood pressure on a chosen set of files, and dis-
play to the user a graph of the computed blood pres-
sure, such as shown on figure 6. Before displaying the
graph, the application detects obviously incorrect val-
ues and removes them. A moving average algorithm
is then used in order to smoothen the curve and make
the trend variation analysis easier.
Figure 6: Continuous Blood Pressure variation visualiza-
tion.
The parameters used to calculate blood pressure
vary according to various conditions such as blood
vessel thickness, blood fluidity, etc. (Lopez et al.,
2010), it is possible to input reported conventionalBP
results (such as ABPM) into the interface and change
the calculation parameters according to the conven-
tional BP variations.
The aim is mainly to do an initial adjustment to
realize a calibration of the device by determining the
optimal parameters for blood pressure calculation for
each individual.
Once these parameters adjustments are done, the
blood pressure algorithm results seem satisfying, as
the trend of computational blood pressure follows this
of ABPM.
4 REAL-TIME BP MONITORING
In addition to accumulating data for further use, the
mobile application is also used for real-time monitor-
ing. It is therefore possible to get feedback from the
device immediately, by displaying ECG and PPG sig-
nals as well as preliminary results from BP algorithm.
4.1 Quick View of Measured ECG and
PPG
When the acquisition of data starts, the logging device
sends data to the iPod touch so that it can be processed
and displayed to the user. The Graphs tab is a good
way to monitor the current input from the sensors and
see important information at a glance.
This tab features two graphs displaying the raw
values from ECG and pulse signals, so that the user
can verify that the signals have satisfying shapes and
amplitudes for our algorithms to be effective (if it is
not the case, a warning message appears on the graphs
area). These graphs can help adjusting the position of
the sensor for better performance. In addition to that,
users can see their current Heart Rate (HR) and Blood
Pressure (BP) values (both being frequently used by
doctors) as they are calculated using the ECG and
pulse data.
A second-precision clock is also present in order
to synchronize blood pressure variations with even-
tual external events which have no input in our system
(contextual data).
4.2 Short and Long-term Variations
As explained in the previous section, the current
blood pressure is shown on the Graphs tab with a sin-
gle numerical value (figure 7). In order to detect short
or long-term trends in the blood pressure values, it is
HEALTHINF 2011 - International Conference on Health Informatics
160
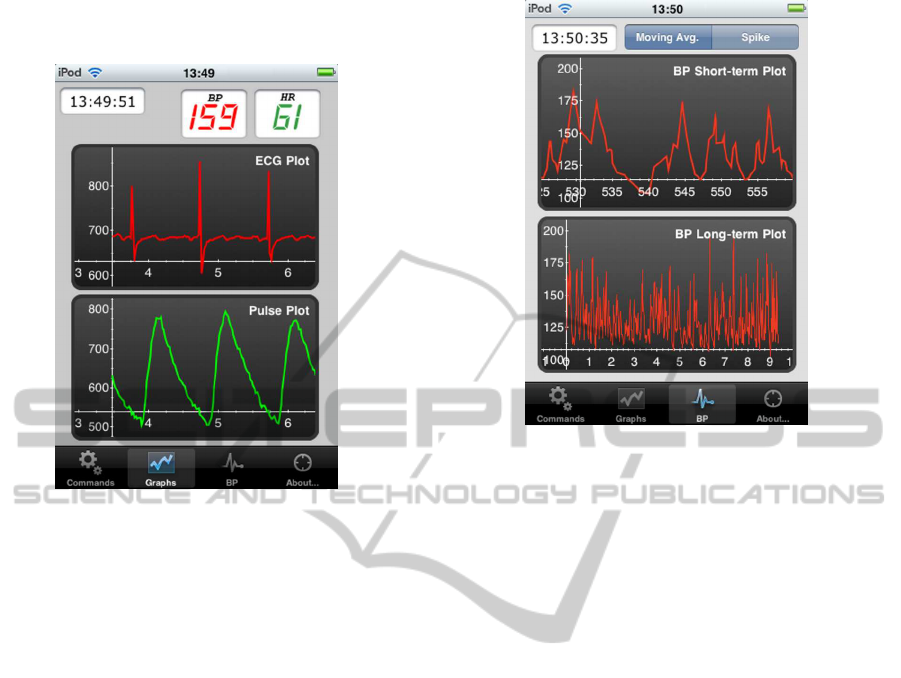
necessary to represent the blood pressure as graphs.
The BP tab is designed to address this issue.
Figure 7: The Graphs tab.
Two graphs, as shown on figure 8, are available:
• the short-term graph, displaying only the last 30
seconds of data, can be used to monitor very sud-
den and punctual variation in blood pressure - this
can happen frequently when switching from a lay-
ing position to a standing position for example;
• the long-term graph, displaying the last 10 min-
utes of data, can be used to monitor increasing or
decreasing trends of blood pressure due to other
phenomena, such as sustained effort or use of an-
tihypertensive medications.
In addition, two modes of graph are available: the
”spike” graph shows all raw calculations of blood
pressure, whereas ”moving average” makes trends
more readable by smoothing the curves using a simple
moving average algorithm.
5 ISSUES AND FUTURE
DEVELOPMENTS
This project was designed as a first ”proof-of-
concept” to ensure this method of non-invasive blood
pressure measurement was fairly reliable and that
such system could replace actual monitoring devices.
Our first experiments seem to validate this assump-
tion. But to go further, some new developments and
features are considered and will unquestionably im-
prove the general response to this system.
Figure 8: The BP tab.
5.1 Network-related Improvements
More than a simple monitoring device, using a mo-
bile application on a smartphone or equivalent has the
advantage of being able to communicate with other
computers through wireless connections. Other de-
vices can be used for monitoring blood pressure, such
as simple micro-controllers (Isais et al., 2003), but
it is possible to make good use of the almost unlim-
ited features and good processing power of the present
smartphones in an health-care context.
One considered feature is to send, directly from
the mobile system, data files to a health-related
database or application server, in charge of storing
them and, eventually, apply algorithms on them. The
application server would then be able to display in-
formation to interested parties (for the patient, reports
based on the monitored data; for doctors, to be able
to follow up their patient easily without even seeing
them; for researchers, to have complete anonymous
health profiles to study)(Lopez et al., 2009).
This networking ability will probably change
drastically the way the current system works: instead
of having the ”complete” profile of a patient written
on the SD card next to the files, the opposite oper-
ation of sending raw data to the database by relying
on the ID of the patient would be more appropriate.
Thus, each patient would have its own access to the
database to upload his files, so that they are available
to doctors and researchers who can issue reports of
their diagnostic in return. The existence of the SD
card itself is also questionable, as the data can be sent
in real time to the application server or saved in the
WEARABLE BLOOD PRESSURE MONITORING SYSTEM - Case Study of Multiplatform Applications for Medical Use
161
smartphone’s memory in case of a network failure.
Such a server would be designed to accept multi-
ple health-related informations and can therefore be
used not only as a blood pressure diagnostic tool but
as a whole health analysis helper, preventing a large
set of lifestyle-related disorders.
5.2 Blood Pressure Calculation
Methods
As mentioned in section 3.3.3, the blood pressure
calculation method relies on multiple parameters de-
pending on various physiological factors. As some
of these physiological factors cannot be determined
without thorough examinations, it is necessary to start
from so-called ”reference” parameters issued by com-
putational or empirical methods.
Our goal is, using various data from initial exper-
iments, to determine these reference parameters and
link them to certain patient profiles.
For that intent we are currently conducting exper-
iments at the University of Tokyo Hospital. Through
these experiments, we hope to find empirical param-
eters for determined age and sex groups, in order to
make our device usable out-of-the-box.
If the results of these experiments, which will be
the subject of a future study, prove this approach to
be unsuccessful, an alternative solution will be set.
This alternative solution may simply consist in mak-
ing a unique initial calibration using ABPM values
measured during a classical cycle-ergometer load test
for each patient (Lopez et al., 2010).
5.3 Use During Daily Activities
Until now, our system’s design is mainly being tested
in an hospital environment as a blood pressure and
heart rate monitoring tool, replacing the system cur-
rently used for this purpose. But the small size of
the wearable device and its adaptation to a popular
and ordinary smartphone makes it potentially usable
for home use, and moreover for use during daily ac-
tivities. Indeed, daily activities have an impact on
blood pressure. Continuous blood pressure measure-
ment can reveal sudden blood pressure variations im-
possible to detect using ABPM.
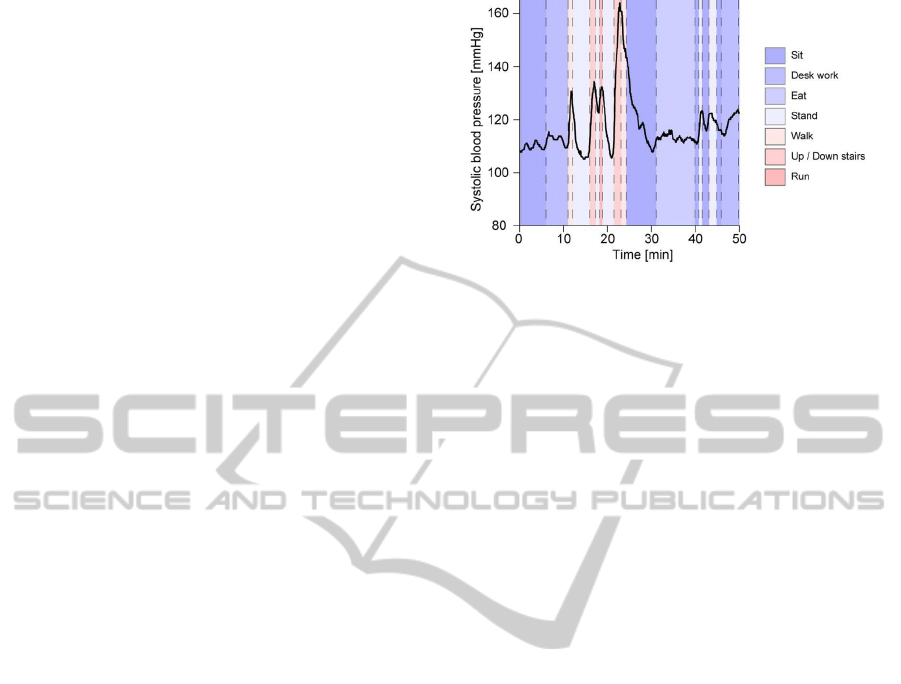
On top of PPG and ECG sensors, our wearable de-
vice also features a 3-axis acceleration sensor. Using
a movement recognition algorithm detecting which
activity is being done based on the acceleration data,
it is possible to detect which activity triggers blood
pressure augmentation and which do not have any ef-
fect (figure 9).
Figure 9: Daily activities blood pressure evolution.
5.4 Sensors and Mobile Device Issues
Our preliminary tests using our current mobile proto-
type shed light on some difficulties the user can expe-
rience while using this device.
One of the main concern is the weight and the
way to wear this device. Indeed, our prototype fea-
tures a battery and consequent electronics, making
the lightweight iPod touch very bulky. Wearing it as
a necklace proved to be very uncomfortable, and el-
derly people seem to consider it a very large burden.
Furthermore, all sensors are connected through
wires. When the sensors are wore under clothes, the
wires can hamper body movements or provoke alter-
ations of the sensors’ positions, with a consequentrisk
of generating various noises.
We are therefore working on some new prototype
clearing these issues, by introducing wireless wear-
able sensors as suggested by former studies (Kang
et al., 2006), and a lightweight smartphone module
to collect the data.
6 CONCLUSIONS
The system presented in this paper covers all types of
users (patient, doctors and/or researchers) and the use
of a mobile terminal such as a smartphone does not
limit the device to the features found on conventional
ABPM devices. Moreover, it is efficient enough to
validate the calculation model. The first experiments
conducted suggest that our wearable blood pressure
monitoring device using PAT method returns reliable
results, and the system is relatively lightweight so that
it used during daily activities. Therefore, if further ex-
periments realized using this system prove it to have
reliable and constant results, and if it is improved so
that the results can be easily sent to a network content
managing server, this system could be a great step for
HEALTHINF 2011 - International Conference on Health Informatics
162

continuous blood pressure monitoring, be it at home
or for an hospital use.
ACKNOWLEDGEMENTS
This research was supported by the research fund for
Core Research for Evolutional Science and Technol-
ogy (CREST), granted by Japan Science and Technol-
ogy agency (JST).
REFERENCES
Espina, J., Falck, T., Muehlsteff, J., Jin, Y., Adan, M. A.,
and Aubert, X. (2008). Wearable body sensor network
towards continuous cuff-less blood pressure moni-
toring. Proceedings of the 5th International Sum-
mer School and Symposium on Medical Devices and
Biosensors (ISSS-MDBS 2008), pages 28–32.
Fung, P., Dumont, G., Ries, C., Mott, C., and Ansermino,
M. (2004). Continuous noninvasive blood pressure
measurement by pulse transit time. Proceedings of
the 26th Annual International Conference of the IEEE
Engineering in Medicine and Biology Society (EMBS
2004), pages 738–741.
Isais, R., Nguyen, K., Perez, G., Rubio, R., and Nazeran,
H. (2003). A low-cost microcontroller-based wireless
ecg-blood pressure telemonitor for home care. Pro-
ceedings of the 25th Annual International Conference
of the IEEE Engineering in Medicine and Biology So-
ciety (EMBS 2003), pages 3157–3160.
Itao, K., Umeda, T., Lopez, G., and Kinjo, M. (2008).
Human recorder system development for sensing the
autonomic nervous system. Proceedings of the 7th
Annual IEEE Conference on Sensors (Sensors 2008),
pages 423–426.
Kang, D.-O., Lee, H.-J., Ko, E.-J., Kang, K., and Lee, J.
(2006). A wearable context aware system for ubiqui-
tous healthcare. Proceedings of the 28th Annual In-
ternational Conference of the IEEE Engineering in
Medicine and Biology Society (EMBS 2006), pages
5192–5195.
Lopez, G., Shuzo, M., Ushida, H., Hidaka, K., Yanagimoto,
S., Imai, Y., Kosaka, A., Delaunay, J.-J., and Yamada,
I. (2010). Continuous blood pressure monitoring in
daily life. Journal of Advanced Mechanical Design,
Systems and Manufacturing, vol. 4, no. 1, pages 179–
186.
Lopez, G., Shuzo, M., and Yamada, I. (2009). New health-
care society supported by wearable sensors and in-
formation mapping based services. 1st International
Workshop on Web Intelligence and Virtual Entreprise
(WIVE’09). CD-Rom proceedings of the 10th IFIP
WG 5.5 Working Conference on Virtual Enterprises
(PRO-VE 2009).
McCombie, D., Reisner, A., and Asada, H. (2008). Mo-
tion based adaptive calibration of pulse transit time
measurements to arterial blood pressure for an au-
tonomous, wearable blood pressure monitor. Proceed-
ings of the 30th Annual International Conference of
the IEEE Engineering in Medicine and Biology Soci-
ety (EMBC 2008), pages 989–992.
McCombie, D., Shaltis, P., Reisner, A., and Asada, H.
(2007). Adaptive hydrostatic blood pressure calibra-
tion: Development of a wearable, autonomous pulse
wave velocity blood pressure monitor. Proceedings of
the 29th Annual International Conference of the IEEE
Engineering in Medicine and Biology Society (EMBC
2007), pages 370–373.
Muehlsteff, J., Aubert, X., and Morren, G. (2008). Con-
tinuous cuff-less blood pressure monitoring based on
the pulse arrival time approach: The impact of pos-
ture. Proceedings of the 30th Annual International
Conference of the IEEE Engineering in Medicine and
Biology Society (EMBC 2008), pages 1691–1694.
WEARABLE BLOOD PRESSURE MONITORING SYSTEM - Case Study of Multiplatform Applications for Medical Use
163
