
INVESTIGATION OF THE NON-MARKOVITY SPECTRUM
AS A COGNITIVE PROCESSING MEASURE
OF DEEP BRAIN MICROELECTRODE RECORDINGS
P. A. Meehan
1
, P. A. Bellette
1
,
A. P. Bradley
2
, J. E. Castner
3
, H. J.Chenery
3
, D. A. Copland
4
J. D.Varghese
1
, T. Coyne
5
and P. A. Silburn
6
1
School of Mechanical Engineering, Faculty of Engineering, The University of Queensland, St Lucia, 4072, Australia
2
School of Information Technology and Electrical Engineering, Faculty of Engineering, The University of Queensland
St Lucia, 4072, Australia
3
School of Health and Rehabilitation Sciences, Faculty of Health Sciences, The University of Queensland
St Lucia, 4072, Australia
4
School of Health and Rehabilitation Sciences and Centre for Clinical Research, Faculty of Health Sciences
The University of Queensland, St Lucia, 4072, Australia
5
Neurosurgeon, St. Andrew’s War Memorial Hospital, Brisbane, Australia
6
Neurologist, The University of Queensland Centre for Clinical Neuroscience
The Royal Brisbane and Women’s Hospital, Brisbane, Australia
Keywords: non-Markovity, Deep Brain, Micro-electrode recordings, Linguistics, Synchrony, Neural networks.
Abstract: Previous research has shown that changes in complexity-based measures of deep brain (DB) microelectrode
recordings (MER) from conscious human patients, show correlations with different linguistic tasks. These
statistical mechanics based measures are further expanded in this research to look at the spectra of an
adapted non-Markovity parameter in different frequency ranges as a measure of synchronous neuronal
networked behaviour. Results presented show statistically significant interaction between hemisphere of
recording, epoch of brain function and semantic category in the fast frequency range (80-200Hz).
Processing of similar semantic words appeared to be associated with increased synchrony in the left hand
hemisphere. Evidence for substantial left and right hemispherical interactions was found. Similar, but less
important trends were found in the beta band (10-30Hz). Significant but less specific correlations were also
found in the theta (4-10Hz) and gamma (30-80Hz) frequency bands.
1 INTRODUCTION
The detection and understanding of brain
functioning based on the direct measurement and
stimulation of the neural electrical activity remains a
seemingly intractable problem due to the complexity
of the neural network. Primarily experimental and
surgical observations have underpinned
breakthroughs in brain activity measurement and
disorder treatment via controlled electrical
stimulation of the brain to greatly alleviate
debilitating neurological disorders. In particular,
Deep Brain Stimulation (DBS) has emerged as a
successful treatment for several chronic neurological
and movement disorders such as Parkinson's disease
(PD), depression, dystonia, epilepsy, Tourette
syndrome and recently Alzheimer's disease. Deep
brain stimulation surgery also provides a unique
opportunity to record the electrical activity of
targeted neural structures while functionally awake
patients perform tasks in a controlled setting. These
developments have spawned recent research
identifying meaningful deep brain functional
behaviour in neural clusters using microelectrode
recordings (MER) and local field potential (LFP)
measurements from implanted electrodes. An
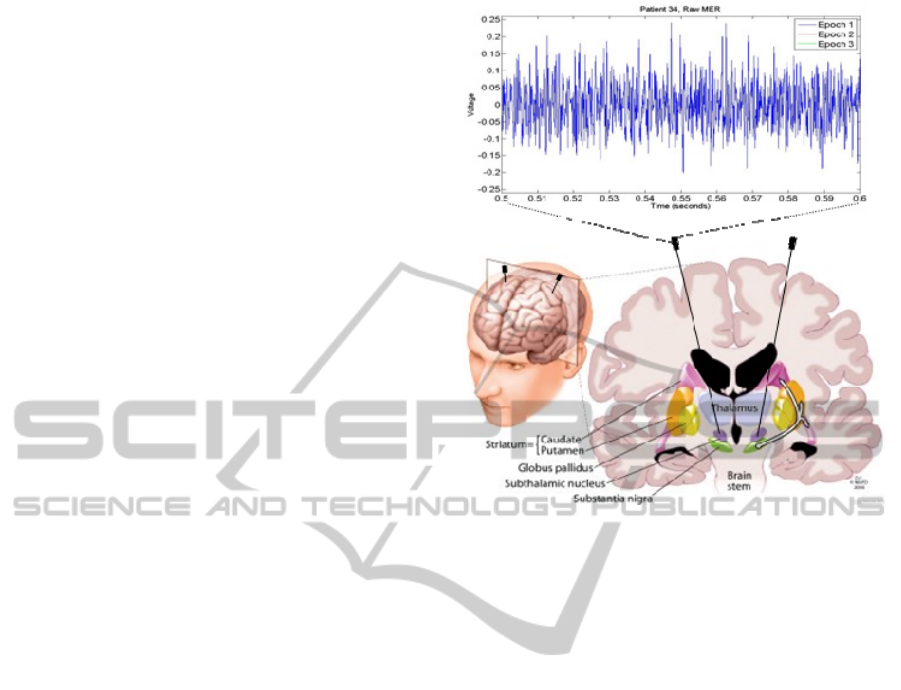
example recording of deep brain electrical activity in
the present research is illustrated in Figure 1
(Meehan and Bellette, 2009).
In deep brain surgery, microelectrodes are
pinpoint-positioned to transmit electrical impulses
from a pacemaker-like device to correct the troubled
area and often produce radical and instantaneous
144
Meehan P., Bellette P., Bradley A., Castner J., Chenery H., Copland D., Varghese J., Coyne T. and Silburn P..
INVESTIGATION OF THE NON-MARKOVITY SPECTRUM AS A COGNITIVE PROCESSING MEASURE OF DEEP BRAIN MICROELECTRODE
RECORDINGS.
DOI: 10.5220/0003133001440150
In Proceedings of the International Conference on Bio-inspired Systems and Signal Processing (BIOSIGNALS-2011), pages 144-150
ISBN: 978-989-8425-35-5
Copyright
c
2011 SCITEPRESS (Science and Technology Publications, Lda.)
transformations in patient symptoms. Although
demonstrably very effective on many patients, a full
understanding of how DBS affects brain functioning
is yet to be obtained. There is an urgent need to
underpin the recent surgical success of DBS with
detailed and systematic investigations of how
electrode stimulation works, what neural circuitry is
affected and how behaviour change is correlated
with stimulator position and their frequency and
amplitude characteristics. Presently, the outcomes of
DBS surgery are very much dependent upon the
experience and intuition of the surgical team –
further insight into the mechanistic foundations of
these neural signals has the potential to lead to more
predictable (and successful) patient outcomes.
Nonlinear analysis techniques, successfully used
for characterizing other biological activity such as
heart rate variability, may provide further insight
into deep brain functioning. The nonlinear, aperiodic
patterns exhibited in biological signals have
motivated many researchers to investigate the use of
nonlinear analysis techniques for insight into
complex behaviour. Typical chaos measures can
quantify the fractal geometry of the aperiodic signal
and/or its exponential sensitivity to input, but require
careful application and interpretation. In many real
complex systems, signals rarely strictly fulfil the
theoretical requirements for using a large range of
these measures of being noise free and stationary.
Hence methods from statistical mechanics, focused
on the complex dynamics of systems exposed to
random fluctuations, may be more applicable than
low-dimensional chaos measures. For example, the
analysis of measured time series using the Hurst
exponent has been applied to a variety of complex
biological processes (Knezevic and Martinis, 2006),
including spike inter-arrival times of subthalamic
nucleus (STN) activity of Rhesus Monkeys (Darbin
et al, 2006) to identify different forms of behaviour.
Alternatively, Yulmeteyev et al. (2000) have
investigated various physical and biological systems
using the so-called Non-Markovity parameter
(NMP) and Relaxation Parameter (RP) arising from
a discrete version of the Zwanzig-Mori chain of
equations (see for example Zwanzig, 2001). This
same method of analysis has also been applied to
Parkinson’s Disease gait and finger tremor data
(Yulmetyev, 2006). This analysis shows a low NMP
for untreated PD patients,( i.e., regular behaviour),
and an increase,( i.e., more chaotic behaviour), when
under DBS or medication. Although interesting,
these measurements are far removed from their
source in the brain and limited to lower level motor
function. The present team recently extended this
Figure 1: Typical micro-electrode recording (MER) of the
field potential of the network of neurons surrounding a
point (in the subthalamic nucleus) deep in the brain, taken
during deep brain stimulation surgery. Larger diameter
macro-electrodes are similarly used for long term
stimulation and recording of local field potentials (LFPs)
encompassing larger volumes of the brain.
research using a range of these measures on direct
deep brain microelectrode recordings to reveal
signatures of higher level cognitive language
processing (Meehan et al 2010). It also provided
evidence for important networked brain activity
remote to local MER spiking activity and brain
activity correlates in unfiltered deep brain
recordings. In addition, increasing evidence is
emerging as to the importance of neural synchrony
in higher order cognition (Engel et al, 2001). This
recent work provides the foundation for the current
research in which the analysis is extended and
performed over renowned neurophysiological
frequency bands. In particular, traditional
electroencephalographic (EEG) brain electrical
activity measurements from the scalp has long
indicated characteristic frequency rhythms
associated with different human behaviour (ie Beta
band waves of 10-30Hz associated with motor
function). Hence the present paper focuses on the
identification of similar correlations within the deep
brain that are yet to be fully measured and
investigated.
INVESTIGATION OF THE NON-MARKOVITY SPECTRUM AS A COGNITIVE PROCESSING MEASURE OF DEEP
BRAIN MICROELECTRODE RECORDINGS
145

2 NON-MARKOVITY
PARAMETER AS A MEASURE
OF SYNCHRONY
A biological neural network is a complex system
composed of numerous neurons with a vast array of
interconnections. These systems are found to operate
on multiple time scales and involve non-linear
interaction of many degrees of freedom. When the
electrodynamics of the neural network are examined
via a microelectrode recording, the superposition of
the activity of the spiking neurons may be
considered to result in essentially a weighted
average of the neural activity in the vicinity of the
electrode. These observations motivate the use of
ideas from the framework of statistical mechanics in
understanding and interpreting the recorded signals.
In particular, Yulmeteyev et al. (2000) developed a
Statistical Parameter of Non-Markovity (NMP),
based on a discretisation of the Zwanzig-Mori chain
of differential equations, expressed as,
∆
∆
=
(
)
−
(
)
(
−
)
,
(1)
Where a is the autocorrelation of the recorded time
series, M is the first “memory function”, λ
1
and Λ
1
are the relaxation parameters, τ is the sample period
and m is the length of the time series. Physically, the
use of the Zwanzig-Mori chain to describe the
system is equivalent to assuming that the underlying
dynamics are of the form of a Generalized Langevin
Equation (GLE) (see Zwanzig, 2001), where the rate
of change of the macroscopic variable, in this case
MER voltage, is driven by a random input and is
restricted by a generalized friction that depends on
the previous state of the system, This is analogous to
a “memory” of the system, explaining the naming of
the memory function.
From the autocorrelation and initial conditions,
equation (1) may be solved recursively to yield the
first memory function. In previous research (Meehan
and Bellette, 2009) the MER data was analyzed by
only looking at the zeroth frequency component of
the ratio of the magnitude of the Discrete Fourier
Transforms (DFT) of the autocorrelation function
and the first memory function, i.e. evaluating the
value of,
(
)
=
|
(())
|
|
(())
|
,
(2)
when ω = 0, where F indicates the DFT. The
purpose of examining the ratios of these two
functions is to provide a scale of the degree of non-
Markovity in the underlying process. When the
future state of the process depends strongly on the
historical values the NMP will be low, whereas if it
only depends on the current state the NMP will be
high.
The relationship of the raw NMP measure of (2)
to synchronous networked neuronal behavior in
frequency bands used in neural biosignal analysis, is
not so clear. Also recent application of this measure
on Deep Brain MER has been shown to provide non-
normal, highly skewed distributions over a large
number of baseline measurements of patients.
Hence, in this research this measure has been
developed further as a measure of neural synchrony
to enable application over the spectrum of
frequencies traditionally used in neurophysiology,
being θ (4-10Hz), β (10-30Hz), γ (30-80Hz), fast
(80-200Hz) and very fast (200-600Hz). Note that
lower frequency bands were not investigated due to
sample length restrictions. More specifically, we
define a non-Markov spectral measure of synchrony
as,
() = 1/
max[
(
)
]
(3)
where max[] refers to the maximum value of the
NMP spectrum within the bandwidth being
investigated. Note that the Sync measure of (3) is
equivalent to a simple type of Box-Cox
transformation of the NMP to normalize statistical
data. It is also meaningful in that it provides a more
direct measure of normalized synchronous behavior
whereby Sync>=1 indicates synchronous behaviour
and Sync<<1 indicates complex behavior.
3 EXPERIMENTAL PROCEDURE
MERs prior to DBS implantation were taken during
a semantic categorization task whereby participants
categorised 2 words as having the same or different
linguistic meaning. In particular, participants were
informed of the task instructions requiring them to
make a decision as to whether a series of word pairs
belonged to the same semantic category (of either
animals or household objects) or whether the word
pairs belonged to different semantic categories (i.e.,
one animal and one household object). Participants
were required to manually respond using the
ipsilateral (same side) hand to the side of STN MER
acquisition. A response was made by pressing one
button to identify same word pairs and an alternate
button to identify different word pairs.
BIOSIGNALS 2011 - International Conference on Bio-inspired Systems and Signal Processing
146

A trial commenced with the auditory
presentation of the first word followed by and inter-
stimulus interval (ISI) of 1000 ms and then the
auditory presentation of the second word. A trial
ended when the participant made a response.
Approximately 3 seconds lapsed before the onset of
the next trial. Participants completed the task on two
occasions with list one being presented when MERs
were acquired from the left STN and list two
presented when MERs were acquired from the right
STN. Each participant became familiar with the
semantic categorisation task and completed a
practice consisting of 14 unique trials, the day before
their surgery.
666 Micro-Electrode Recordings (MERs) were
taken from the STN of 8 patients prior to DBS
implantation. They were taken on both left and right
hemispheres. The recordings are grouped into 3
sampling epochs, which are as follows;
1. Baseline: Prior to a semantic categorization
task
2. Stimulus Presentation: Listening to two words
from either the same or different semantic
categories.
3. Response: via pressing a button for their
categorization of the words as belonging to
either same or different semantic categories.
STN targeting was completed using fused MRI
and stereotactic CT images displayed by Radionics
(Radionics, Inc., Burlington, MA, USA) or
Stealthstation (Medtronic Inc., Minneapolis, MN).
The STN target was established through the
identification of the anterior commissure (AC) and
posterior commissure (PC) resulting in
anteroposterior, lateral, and vertical coordinates.The
location of the STN was confirmed when a
neurologist and neurosurgeon verified characteristic
STN firing patterns and visually by post-operative
CT. Once the optimal STN location was established
intraoperatively, participants completed an auditory
semantic categorisation task with the simultaneous
acquisition of MERs. Prior to participation in the
language task, patients were deemed to be
sufficiently alert to perform the standard clinical
assessments used during surgery for DBS. MERs
were acquired with a Tungsten microTargeting
®
electrode (model mTDWAR, FHC, Bowdoinham,
ME) with a tip diameter of less than 50µm and
impedance of approximately 0.5 MΩ (± 30%) at 1
kHz. MERs were filtered (500-5000 Hz) and
recorded at a sampling rate of 24 kHz from
LeadPoint™ (Medtronic Inc., Minneapolis, MN).
Despite the known presence of a filter with a corner
frequency at 500Hz, an examination of the power
spectra of the measured signals revealed that there is
no distinct cut-off and significant power is still
present in lower frequency ranges. Thus an
examination of the possible Non-Markovity effects
in the lower frequency ranges is valid, since there is
still a non-negligible signal in these frequency
bands. It should also be noted that a linear filter
produces a known constant effect on the NMP
spectra that should not change for the different
experimental test conditions.
The data files for the 666 individual
microelectrode recordings taken under the various
experimental conditions were labeled with the
individual conditions for patient number, semantic
condition (same or different), recording side (left or
right) and recording epoch (baseline, listening and
responding). The data was then automatically
processed using the new NMP spectral analysis
method described in II and the results recorded using
the unique data label for subsequent statistical
analysis. The method of statistical analysis
employed was a linear mixed model analysis with
recording epoch, recording side and semantic
condition considered as fixed effects and the patient
considered to be a random effect to determine
correlations between the NMP measure and
semantic task outcomes. It is noted that the raw
NMP measure (2) of the data failed the
Kolmogorov-Smirnov normality test while the Sync
measure (3) passed.
4 RESULTS AND DISCUSSION
A sample of the time and frequency domain raw ME
recordings in three time epochs (see section 3.) can
be seen in Figure 2 including separate zoom-ins to
show small scale detail.
Also included is a delay embedding
representation of the phase space, from which
traditional low dimensional chaos measures were
previously taken (Meehan and Bellette, 2009). These
measures indicated the MER behaviour in the
present data is characterised by very high
dimensional chaos but could not discern meaningful
changes as a function of semantic condition or
left/right sided recordings. For the general linear
model of the frequency band NMP data it was found
that a statistically significant 3 way interaction was
found in the fast frequency range (p=0.004, 80-
200Hz band) between measurement side, recording
epoch and semantic word category. The average
results for these categories are shown in figure 3.
INVESTIGATION OF THE NON-MARKOVITY SPECTRUM AS A COGNITIVE PROCESSING MEASURE OF DEEP
BRAIN MICROELECTRODE RECORDINGS
147
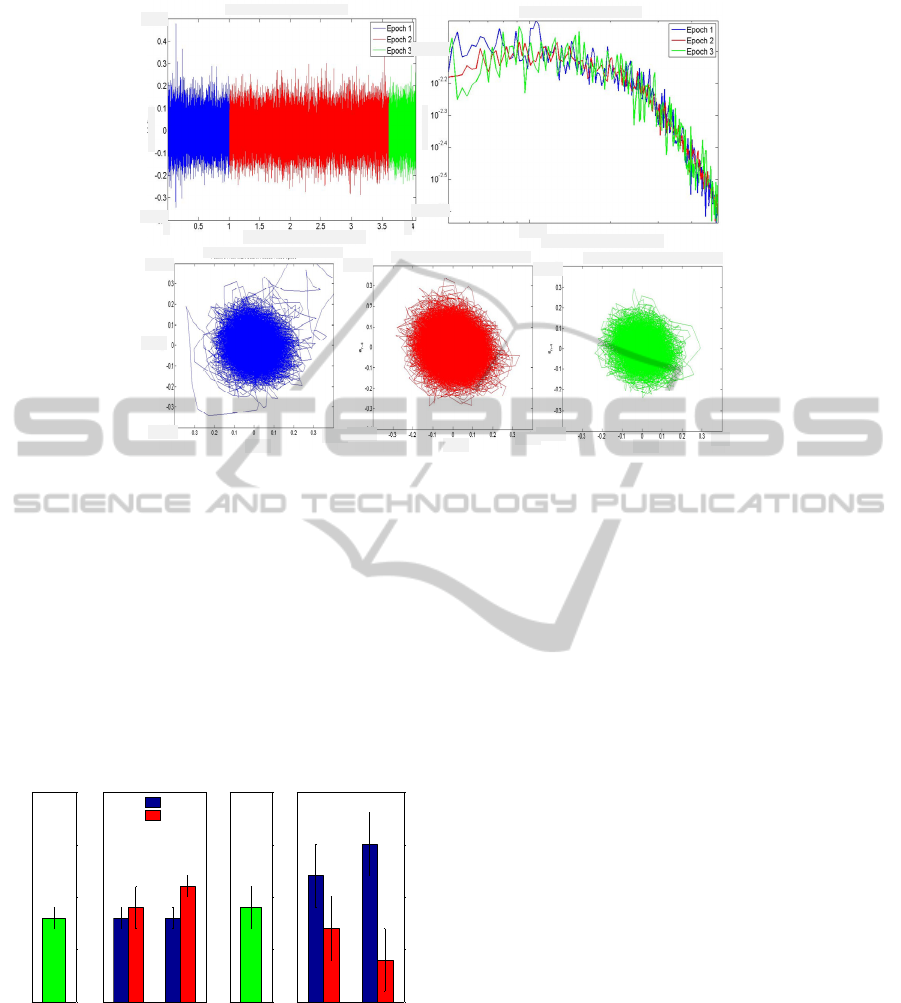
Figure 2 Raw MER (a) Time domain (b) Frequency domain and (c) Phase Spaces for each epoch. Epoch 1 NMP =
1.83±1.99, Epoch 2 NMP = 0.92±0.08 and Epoch 3 NMP = 0.79±0.15. (Epoch 1: baseline prior to task, Epoch 2: listening
to task, Epoch 3: response).
Post-hoc pair-wise comparisons show that for the
fast band statistically significant differences were
seen on the left side recording in the responding
phase for the same and different semantic conditions
(p=0.041). On the right side recording significant
differences are observed for the same and different
word categories in both the listening and responding
epochs (listening, p=0.048 and responding,
p=0.001).
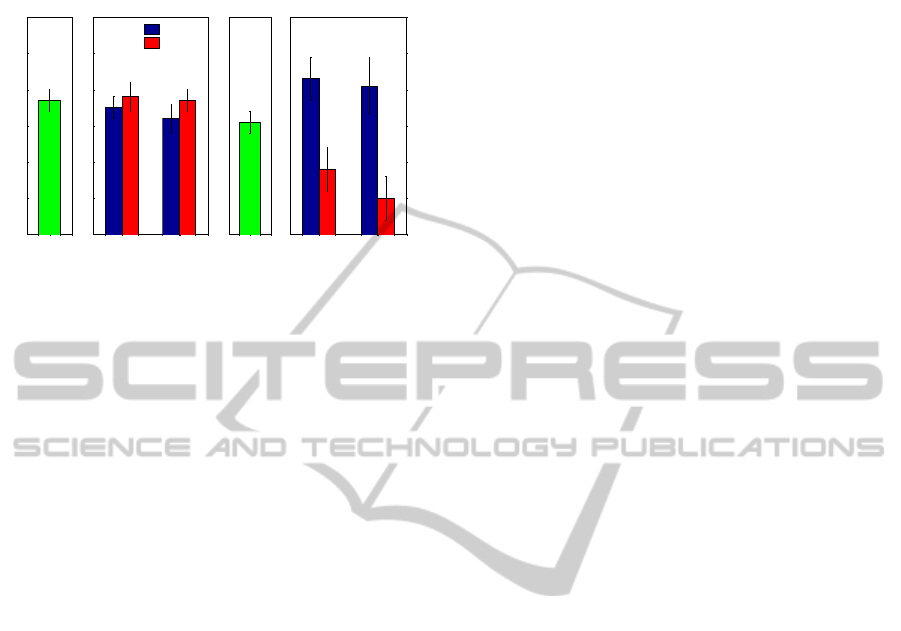
Figure 3: Average NMP-Synchrony measure in fast
frequency range (80-200Hz) for baseline, listening and
responding epochs, for left and right hand side recordings
and for same and different semantic word categories
showing significant (p=0.0001) 3 factor interaction. Error
bar indicates SEM.
Since the left hemisphere is typically associated with
linguistic processing we focus on the left-side
recordings initially. It can be seen that for the left
side recording, an increase in synchrony (decrease in
complexity) was observed for the same semantic
(word-meaning) category during the responding
phase. This is consistent with recent research
indicating the important use of synchrony associated
with top-down selection processes during higher
order cognition (Engel, 2001) i.e. neurons that
respond to the same meaning fire in temporal
synchrony. It is interesting to note that this finding
was reversed in the right side recording, indicating
important left-right hemispherical interactions are
also occurring during semantic processing. These
results provide stronger evidence of higher order
cognition occurring in the STN associated with
semantic processing. In particular, traditional EEG
analysis has long associated high frequency brain
rhythms with binding of different populations of
neurons together into a network for the purpose of
carrying out a certain higher order cognitive or
motor function.
Further to this interaction, there were also
significant 3 way interactions noted in the frequency
bands lower than the fast band, in the theta, beta and
gamma bands (θ 4-10Hz, β 10-30Hz, γ 30-80Hz,
respectively). In particular, the most significant of
these; the beta band; is shown in Figure 4. Pair-wise
comparisons revealed the same trend for the beta
band data as the fast band, i.e. a significant
difference between same and different on the left
recording in the responding epoch (p=0.010), and in
a)
b)
c)
d)
e)
Patient 34 Raw MER
FFT of Patient 34 Raw
Frequenc
y
(
Hz
)
Time
(
s
)
4
0
10
3
10
-2.6
10
-2.1
-0.4
0.5
Phase s
p
ace E
p
och 1
Phase s
p
ace E
p
och 2
Phase s
p
ace E
p
och 3
a
n
a
n
a
n
0.4
0.4
0.4
-0.4
-0.4
0.4
0.4
0.4
-0.4
a
n-4
V
V
Baseline
0.4
0.45
0.5
0.55
Sync(ω) = Max NMP(ω)
-1
/
2
Fast (80-200Hz)
Listening Responding
0.4
0.45
0.5
0.55
Baseline
0.4
0.45
0.5
0.55
Listening Responding
0.4
0.45
0.5
0.55
Different
Same
Left Side Recordings
Right Side Recordings
BIOSIGNALS 2011 - International Conference on Bio-inspired Systems and Signal Processing
148
both the listening and responding epochs for the
right side recording (p<0.001 for both cases).”
Figure 4: Average NMP-Synchrony measure in beta band
(10-30Hz) for baseline, listening and responding epochs,
for left and right hand side recordings and for same and
different semantic word categories showing significant
(p=0.001) 3 factor interaction. Error bar indicates SEM.
Figure 4 shows similar trends to the fast
frequency band results of figure 3. In particular,
there is a significant difference in the level of
synchrony during the response on the left and right
hand hemispheres between same and different
semantic conditions. Interestingly, these results
indicate substantial beta band activity associated
with the semantic task although it is noted that the
task included a motor activity i.e. button push (in the
responding phase). In addition, it should be
highlighted that the MER were taken from PD
patients. In particular, recent research (ie
Weinberger et al, 2006 and Chen et al 2010) has
highlighted enhanced beta band synchrony
associated with STN local field potential (LFP)
recordings from PD patients using power spectra and
complexity-based analyses of Parkinson’s disease
patients. It is therefore of interest to perform a
similar investigation using LFP data in future
research for comparison.
These results give an experimental basis for
further investigations of biological neural networks
under a statistical mechanics framework. Previous
benchmarking tests (Meehan et al 2010) have shown
that the NMP and RP of an MER time series may be
related to the mean and variance of underlying
neuron spike rates, however a deeper understanding
of the physiological basis for these and other
Synchrony/Complexity measures is desired.
5 CONCLUSIONS
The spectrum of a new non-markovity based
synchrony measure from statistical mechanics has
been applied to deep brain micro-electrode
recordings from the STN of Parkinson’s disease
patients performing a semantic categorization task.
The results presented show statistically significant 3-
way interaction between hemisphere of recording,
recording epoch and semantic category in the fast
frequency range (80-200Hz). Processing of similar
semantic words appeared to be associated with
increased synchrony in the left hand hemisphere
typically associated with language processing. Less
specific correlations are also found in the lower
frequency bands with the beta band (10-30Hz)
showing similar trends to fast frequency range.
These results highlight the role that the STN may
play in linguistic and well as motor tasks. Such
statistical mechanics models, which may be
validated against real data such as that used in this
research, may be a useful tool in gaining further
understanding of biological neural networks and
may provide avenues of investigation into the
mechanics of dysfunction such as Parkinson’s
disease, deep brain stimulation and fundamental
insights into cognitive processes in the brain.
ACKNOWLEDGEMENTS
The authors are greatly indebted to PD specialists of
St. Andrew's War Memorial and The Wesley
Hospitals, Australia for their motivation, guidance,
interdisciplinary expertise and funding.
REFERENCES
Chen, C. C., Hsu, Y. T., Chan, H. L., Chiou, S. M., Tu, P.
H., Lee, S. T., Tsai, C. H., Lu, C. S. and Brown, P.,
Complexity of subthalamic 13–35 Hz oscillatory
activity directly correlates with clinical impairment in
patients with Parkinson's disease, Experimental
Neurology, 224(1), 234-240, 2010.
Darbin O. Soares J. and Wichmann T. Nonlinear discharge
patterns in monkey basal ganglia. Brain Research.
1118: 84:93, 2006.
Engel, A. K., Fries, P. and Singer, W. (2001), Dynamic
Predictions: Oscillations and Synchrony in Top-Down
Processing. Nature review Neuroscience, 2, 704-16.
Knezevic A., Martinis M. (Multi) fractality of
physiological time-series. Int. J. of Bifurcation and
Chaos. 16(7): 2103-2110, 2006.
Meehan, P. A. and Bellette, P. A., “Chaotic Signal
Analysis of STN Brain Signals”, Topics in Chaotic
Systems, World Scientific Publishing, Ed. Charilaos
Baseline
0.6
0.7
0.8
0.9
1
1.1
Sync(ω) = Max NMP(ω)
-1/2
Beta (10-30Hz)
Listening Responding
0.6
0.7
0.8
0.9
1
1.1
Baseline
0.6
0.7
0.8
0.9
1
1.1
Listening Responding
0.6
0.7
0.8
0.9
1
1.1
Different
Same
Lef t Side Recordings
Right Side Recordings
INVESTIGATION OF THE NON-MARKOVITY SPECTRUM AS A COGNITIVE PROCESSING MEASURE OF DEEP
BRAIN MICROELECTRODE RECORDINGS
149

Skiadas, ISBN-10: 9814271330, ISBN-13: 978-
9814271332, 2009. pp 232-241.
Meehan, P. A. Bellette, P. A. Bradley, A. P. Chenery, H.
J., Copland D., P. A. Silburn, Towards Unravelling the
Mysteries of STN Brain Signals, Submitted
Weinberger M, Mahant N, Hutchison W. D., Lozano A.
M., Moro E., Hodaie M., Lang A. E. and Dostrovsky
J. O. J. Neurophysiol 96:3248-3256, 2006.
Yulmetyev, R. Hanggi, P. and Gafarov F. Stochastic
dynamics of time correlation in complex systems with
discrete time. Physical Review E. 62(5): 6178-6194,
2000.
Yulmetyev, R. M. Demin, S. A. Yu. O. Panischev,
Hanggi, P. Timashev S. F. and Vstovsky. G. V.
Regular and stochastic behavior of Parkinsonian
pathological tremor signals. Physica A. 369: 655–678,
2006.
Zwanzig. R. Non-equilibrium statistical mechanics,
Oxford University Press, New York, 2001.
BIOSIGNALS 2011 - International Conference on Bio-inspired Systems and Signal Processing
150
