
ROBUST CHARACTERISTIC POINTS FOR ICG
Definition and Comparative Analysis
P. Carvalho, R. P. Paiva, J. Henriques
Department of Informatics Engineering, University of Coimbra, Pólo II, Coimbra, Portugal
M. Antunes
Cardiothoracic Surgery Center of the Hospitais da Universidade de Coimbra, Coimbra, Portugal
I. Quintal
Echocardiography Department of the Centro Hospitalar de Coimbra, Coimbra, Portugal
J. Muehlsteff
Philips Research Laboratories Europe, Aachen, Germany
Keywords: ICG, B-Point and X-Point Detection, Systolic Time Intervals, pHealth.
Abstract: The impedance cardiogram (ICG) is a promising tool for non-invasive and cost effective assessment of the
hemodynamic state, especially in low acuity and home settings. Important diagnostic parameters are related
to characteristic points within the ICG, i.e. the B and the X points that are assumed to mark the opening and
closure of the aortic valve., respectively. Based on synchronized echocardiography-ICG data obtained from
healthy subjects at rest, we compare 4 existing alternatives for the ICG’s characteristic point definitions
associated detection algorithms. We show that those points exhibit considerable biases with respect to the
intended onsets of the systole and diastole compared to the Echocardiography Goldstandard. We introduce
a new approach to determine these characteristic points based on the analysis of the ICG morphology. For
its implementation a computationally simple algorithm, based on high order derivatives, is proposed. This
algorithm is evaluated using simultaneously recorded echocardiographies and ICG signals. The achieved
results show that the proposed method enables the identification of the main characteristic points, B and X,
with significantly smaller errors and much higher correlations compared to current state of the art methods
and existing alternative characteristic point definitions.
1 INTRODUCTION
The impedance cardiogram (ICG) is one of the
reference methods for portable devices in assessing
several key hemodynamic descriptors, such as the
systolic time intervals (STI) and the cardiac output
(CO). This measurement principle is based on the
measurement of the thorax impedance variations
(dZ/dt) that are influenced by airflow through the
lungs, blood flow from the left ventricle to the aorta
and lung perfusion. It is able to track the relative
changes of stroke volume (SV) in healthy subjects
and patients without valve diseases Gotshall et al.
(1989). The assessment of the systolic time intervals
Figure1: Definition of characteristic points for aortic valve
events in the Impedance Cardiogram. Points B and X are
the traditional definitions for opening and closing events
of the aortic valve. B
new
and X
new
correspond to the
proposed definitions. Signal notches related to the
opening and closing of the aortic valve are shown in
circles.
161
Carvalho P., P. Paiva R., Henriques J., Antunes M., Quintal I. and Muehlsteff J..
ROBUST CHARACTERISTIC POINTS FOR ICG - Definition and Comparative Analysis.
DOI: 10.5220/0003134901610168
In Proceedings of the International Conference on Bio-inspired Systems and Signal Processing (BIOSIGNALS-2011), pages 161-168
ISBN: 978-989-8425-35-5
Copyright
c
2011 SCITEPRESS (Science and Technology Publications, Lda.)
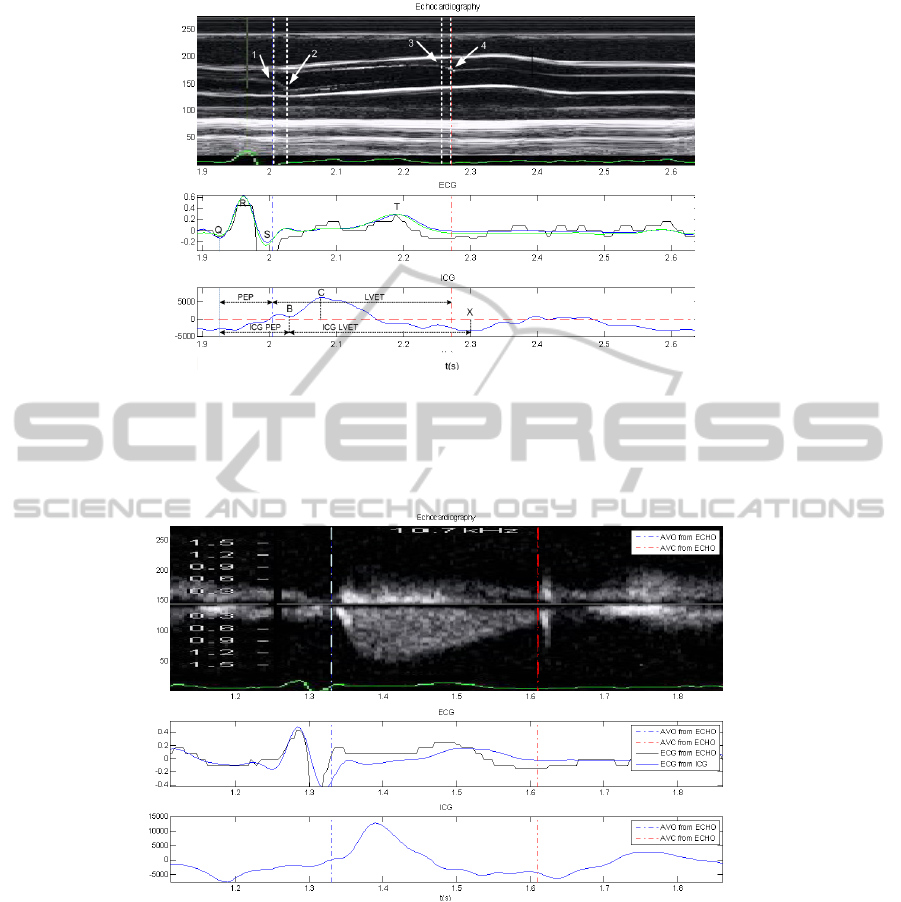
Figure2: Relationship between ICG characteristic points and aortic valve cusps movements. (top) Echocardiography M-
mode; points 1 and 2, respectively, indicate the onset and the end of the movement of the aortic cusps during the opening
movement of the valve; points 3 and 4, respectively indicate the onset and the end of the aortic cusps during the closing
movement. (middle) ECGs captured by the different measurement modalities after synchronization. (bottom) Synchronized
ICG signal with the echo.
Figure 3: Relationship between blood ejection through the aortic valve and the ICG characteristic points. AVO and AVC
represent aortic valve opening and closure, respectively. (top) Echocardiography Doppler-mode. (middle) ECGs captured
by the different measurement modalities after synchronization. (bottom) Synchronized ICG signal with the Doppler Echo
(top image).
as well as SV from ICG require the determination of
the ICG’s characteristic points, which are assumed to
be correlated to the opening and closing of the aortic
valve. The rationale in using ICG to measure the
systolic time intervals is the assumptions that the
notches of the dZ/dt signal (see fig. 1) are due to
conduction changes of blood caused by changes in
orientation of erythrocytes (Visser et al., 1993) that
can be directly related to the opening and closing
events of the aortic valve. Namely, the so-called B
and X points are assumed to mark, respectively, the
opening and the closing of the aortic valve. Using
these reference ICG points, it is observed that the
pre-ejection period (PEP) is defined by the time
interval between the ECG’s Q-peak and the ICG’s B
point, while the left ventricle ejection time (LVET)
is defined as the time interval between the
characteristic points B and X (see fig. 2).
As can be observed in fig. 1, the most common
definitions of the B and X points assume that the B
BIOSIGNALS 2011 - International Conference on Bio-inspired Systems and Signal Processing
162

point corresponds to the local minimum of the notch
to the left of point C, while the X point corresponds
to the time instant where the lowest ICG value
occurs during the negative ICG signal section, to the
right of the C point. Using synchronized
echocardiography (clinical gold standard) with ICG
(see fig. 2) suggests that the traditional definitions of
B and X points do not correlate well to the exact
opening and closing instants of the aortic valve,
respectively. In fact, as was observed by Shyu et al.
(2004) using pressure-volume (PV) loops, the X-
point tends to occur substantially later than the E-
point of the PV loop, which marks the closing of the
aortic valve. The multi-modal graphical data
provided by several authors (e.g. (Wang et al.,
1995)) seem to suggest that the ICG’s B-point
occurs after the onset of the opening movement of
the aortic valve cusps. It should also be mentioned
that some authors (e.g. (Reddy et al., 1988), (Visser
et al., 1993), (Visser et al., 1991)) define the onset
of the aortic valve opening event at the zero-crossing
point of dZ/dt prior to point C (variants exist where
these points are measured at certain distances from
this reference).
There have been several efforts to automate the
detection of the ICG’s characteristic points. Several
algorithms rely on ensemble averaging to overcome
artifacts in the ICG signal (Nagel et al., 1986)
related to baseline drift caused by respiration and
movement artifacts. Because of heart rate variability,
this technique tends to blur less distinctive events
(particularly the B-point) making their detection
more difficult. On the other hand, it comes at the
expense of beat-to-beat variations, since ensemble
averaging filters these out. In order to overcome
these limitations, many authors suggest the use of
filtering and adaptive thresholding techniques. Wang
et al. (1995) use the spectrogram in different
frequency regions to extract a salience measure of
the characteristic points. A review on salience
measure-based methods is reported in (Pandey and
Pandey, 2005). Other authors exploit the wavelet
transform (WT). The advantage of WT is that it
decomposes the signal into different frequency bands
or scales, while preserving and characterizing the
regularities of the signal in those scales. Shyu et al.
(2004) and Shuguang et al. (2005) explored the
zero-crossings and local extremes to find the
characteristic points in ICG in a particular scale.
In this paper we introduce a new definition for
the characteristic points in ICG and an algorithm for
their detection using a computationally simple and
efficient method based on high order derivatives.
The basis for this new definition of the ICG’s
characteristic points is described in section 2.1. The
details of the algorithm are introduced in section 2.2.
A performance comparison with respect to the
current clinical gold standard – the
echocardiography – using state-of-the-art
characteristic point definitions and detection
methods and a commercial system is provided in
section 3. Finally, in section 4, some main
conclusions are presented and discussed.
2 METHODS
2.1 Characteristic Point Definition
There is evidence that the characteristic points
considered in literature for ICG correspond only
approximately to the events used to mark the systole
and the diastole phases of the cardiac cycle, i.e. the
movements of the aortic valve cusps. Heart valve
movements are not instantaneous, but rather
transitory processes that have their intrinsic dynamic.
This is perfectly visible in fig. 2, where the ICG
signal has been co-registered with an M-mode
echocardiography of the aortic valve that enables to
trace the aortic valve cusps movements. As can be
observed, the opening movement of the aortic cusps
is located at the notch of the ICG, to the left of point
C. As depicted in fig. 1, this notch corresponds to a
relatively large region of the ICG. The traditional
definition of the B-point is at the base of the notch
(see fig. 1 and fig. 2). However, from fig. 2 it is seen
that physiologically this point does mark neither the
onset nor the end of the cusps movement during its
opening dynamics at the beginning of the systole.
Synchronized ICG-echocardiographies suggest that
these events occur earlier in time and tend to
correspond, respectively, to the inflection point of
the ICG curve, to the left of the maximum of the
notch, and to a point near the notch’s maximum.
To overcome the uncertainty induced by the
dynamics of the cusps during the opening and
closing of the aortic valve, the left ventricle blood
ejection lobe is usually applied as a reference in
clinical practice, which is measured using
echocardiography in Doppler mode. Fig. 3 depicts
the blood ejection lobe through the aortic valve
measured using the echo-Doppler principle and co-
registered with the ICG signal. As can be observed,
the onset of the ejection lobe tends to be localized
immediately before the ICG notch’s maximum, i.e.,
an event that occurs noticeably earlier than the
ROBUST CHARACTERISTIC POINTS FOR ICG - Definition and Comparative Analysis
163

classical B-point definition. This is the reference for
the B point proposed in this paper (see point B
new
in
fig. 1).
Regarding the onset of the diastole phase of the
heart cycle, a similar condition is observed. In ICG
literature, the X-point is defined as the point that
corresponds to the lowest ICG value of the first
negative ICG signal section to the right of the C-
Point. Using pressure-volume loops obtained
through invasive measurement, Shyu et al. (2004)
have noticed that this point typically occurs between
10ms and 50ms after the onset of the diastole. This is
in accordance with the synchronized
echocardiography-ICG measurements performed
during this work. As can be observed in fig. 2, the
onset of the aortic cusps closing movement tends to
correspond to the local ICG maximum/start of the
negative slope to the left of the X-point, while the
end of the cusps movement is typically related to the
ICG’s inflexion point located between the mentioned
maximum and the X-point. Not surprisingly, using
the echo-Doppler echocardiographies (see fig. 3), it
is observed that the end of the left ventricle ejection
lobe corresponds to a point between the two
aforementioned points. In this paper, the X-point
will be assumed to be the onset of the descending
part of the notch, to the left of the traditional X-point
(see point X
new
in fig. 1).
2.2 Characteristic Points Detection
Three main steps that target, respectively, the
detection of the C, B and the X points of the signal
form the proposed algorithm for ICG characteristic
point detection using the definition proposed in the
previous section. The algorithm operates on a beat-
by-beat basis. For simplicity, it will be assumed that
Figure 4: Illustration of the initial B0 estimation technique
(vertical axis arbitrary scaled).
Figure 5: Illustration of B and X point detection method
using high-order derivatives in an ICG signal with a subtle
B-point notch. AVO-Echo and AVC-Echo define,
respectively, the detected aortic valve opening and closing
moments using echocardiography. Dashed vertical
markers define B, X and C points detected using the
described approach. Signals are arbitrarily scaled and
translated.
the ICG signal included between two consecutive
ECG R-peaks or Q-peaks is fed into the algorithm.
The C-point corresponds to the most prominent
component of the ICG and can be readily detected as
the time instant where the maximum value of the
ICG signal occurs.
The B-point is usually defined at the base of the
notch to the left of the C-point (see fig. 1 and fig. 2).
Regarding the notch, it is observed that it is not
always well defined and, in many cases, is
completely absent from the ICG signal. Therefore,
the method proposed here first estimates the base of
the notch (Bo). In a second phase the method verifies
if a notch is present in the ICG signal under analysis.
If a notch type salience is found in the ICG, the top
of the notch is searched; otherwise the estimated
base is adjusted according to the signal’s
morphology. The processing steps involve the
computation of high-order derivatives, which
amplify high frequency noise. In order to minimize
high-frequency noise interference, in the proposed
approach the impedance signal is low-pass filtered
using a Butterworth filter with a cut-off frequency of
100Hz. This is motivated by the fact that a typical
ICG signal exhibits spectral components up to this
frequency range (Wang et al., 1995). Zero-phase
filtering is implemented, which involves filtering the
signal in both the forward and backward directions,
to eliminate phase distortion. The following steps
form the actual procedure:
Step 1: In this step, a first estimate of the notch’s
base is performed using an adaptation of the
procedure described by Onu et al. (2004). The first
estimate of the B-point, Bo, is illustrated in fig. 4. It
is obtained based on the intersection of the line fit of
BIOSIGNALS 2011 - International Conference on Bio-inspired Systems and Signal Processing
164

the ICG points between 40% (icg(Ko)) and 80%
(icg(Ku)) of the amplitude of point C with the
horizontal axis (see fig. 4). In order to avoid
underestimating Bo, its value is limited based on the
physiological observation that the aortic valve
opening typically occurs 30ms after the atria-
ventricular (AV) valve closing (Tavel, 1967). As an
approximate reference for the AV closing instant, the
ECG’s R-peak can be applied.
Step 2: This step is to check the existence of a
detectable notch. In order to detect the presence of
the notch, the method resorts to the second
derivative of the ICG signal. Using the backward
discrete derivative definition, the existence of a
notch should lead to a (+,-,+,-)
sign pattern of the
second derivative to the left of the C-Point. If this
second derivative sign pattern is found, then one
might assume that a notch exists in the ICG signal.
In this situation the B-point is defined by the first
minimum of the 3rd derivative to the left of Bo. The
use of this procedure enables the correct detection of
the aortic valve opening moment for well-defined as
well as for subtle notches (see fig. 5). For subtle
notches, it is observed that there is no clear 1st
derivative zero that can be applied to identify the top
of the notch. The 2nd derivative is always negative
due to the concavity of the notch’s region around the
local maximum; hence it is not straightforward to
apply it directly for the notch’s top identification
task. However, the intended point corresponds to the
minimum acceleration of the 1st derivative, i.e. a
minimum of the 3rd derivative (see fig. 5). A similar
approach has been followed by Chan et al. (2007) to
identify characteristic points in the dichrotic notch of
a Photoplethysmogram. If no sign pattern in the
second derivative is detected, then no detectable
notch exists. In this case, the B-point is assumed to
be the first zero-crossing of the first derivative of the
ICG to the left of Bo.
The third important event to be detected in the
ICG is the X-point. In a well-defined ICG signal, it
is observed that, using the traditional definition, the
X-point corresponds to the lowest ICG value of the
first negative ICG signal section to the right of the
C-Point. In practice, due to noise and respiration
artifacts, this might not be the case. Physiologically,
it is observed that the T-wave of the ECG
corresponds to the relaxation of the ventricles of the
heart. Hence, the closing of the aortic valve is
usually observed near the end of the T-wave. As a
first estimate of the X-point,
X
0
, the lowest ICG
negative minimum is taken in the interval
RT
≤
t
≤
1.75
RT
, where
RT
represents the duration
of the R-T ECG segment. As can be observed in fig.
2 and fig. 3, the actual closing of the aortic valve
tends to be localized near the top of the first local
ICG maximum to the left of
X
0
. This point can be
readily detected both in well-defined and in less
well-defined ICG signals using the local minimum of
the 3
rd
derivative of the ICG to the left of X
0
. The
basis for using the 3
rd
derivative in this context is the
same as for B point detection.
3 RESULTS AND DISCUSSION
17 volunteer students at the Centro Hospitalar de
Coimbra have been asked to participate in the data
collection study aimed at the simultaneous collection
of ICG (a Niccomo device from Medis
® was
applied) and echocardiography (Siemens
® Acuson
CV70 device). A synchronous ECG with each of the
above signals was also acquired and served as a
reference signal for co-registration. The population
was not balanced for gender (14 male and 3 female).
The average heart rate during data collection was
72.94 ± 9.87 bpm. All subjects involved in this study
did not have any known congenital or other heart
disease. Regarding the main biometric characteristics
of the population, they exhibited average age of
22.53 ± 3.81 years and average body mass index of
23.27 ± 2.15 Kg/m
2
.
Table 1 and table 2 present the comparative
analysis of the achieved results for B and X points
detection, respectively, using five different methods
on the common database. The database is composed
by 564 heart beats with annotated aortic valve
opening and 358 beats with annotated aortic valve
closing moments using echocardiography as
reference. Regarding the echocardiography mode,
213 beats were annotated in M-mode and 351 beats
resorted to Doppler-mode. Values shown in table
and table 2 have been found to be statistically
relevant (p<0.001) using the Wilcoxon test
(Gaussianity was assessed using the Kolmogorov-
Smirnov test).
As can be observed, using echocardiography as
reference, it is clear that the classical definitions of
the systolic events in the ICG signal, i.e. the B and
the X points, do not capture adequately the actual
physiological opening and closing events of the
aortic valve. In fact, all of the conventional ICG
characteristic point identification methods exhibit
significant biases with respect to the
echocardiography reference in detecting both events.
ROBUST CHARACTERISTIC POINTS FOR ICG - Definition and Comparative Analysis
165

Furthermore, it is observed that these biases differ
substantially, leading to significant over or
underestimations of PEP and LVET. This is clearly
shown in table 3 where the impact on LVET
estimation is summarized for all the considered
methods. It should be observed that the statistics on
PEP estimation are the same as the ones reported for
point B (see table 1), given the definition of this
systolic time interval.
From table 1 it is seen that Onu’s algorithm (Onu
et al., 2004) is the most stable method in detecting
the B-point using its classical definition. It exhibits
the highest correlation with respect to the aortic
valve opening and the lowest standard deviation of
the error among the classical methods. Comparing
the results achieved by this method in detecting the
B and the X points, it is seen that the B point is
measured with an average bias of 19.9 ms, while the
X point exhibits a measurement bias of 34.6 ms (see
table 2), hence, as is shown in table 3, these biases
will not cancel out during LVET computation which
is required for stroke volume assessment.
Table 1: Comparative analysis of beat-to-beat B point
detection results with respect to echocardiography.
Average error is defined by the average of B-B
Echo
. The
average absolute error is defined by the average of |B-
B
Echo
|, whereas SD is the standard deviation of |B-B
Echo
|.
All reported error and SD values are in ms. (
*
) Niccomo
ICG device from Medis®. (
**
) Spearman Correlation
(p<0.001).
Proposed
Method
Shyu et
al.
Onu et
al.
Nic
*
Zero-
Crossing
Av. Er. 5.8 11.4 16.5 9.8 -7.2
Av. Abs. Er.
SD
12.4
8.7
21.1
12.8
19.9
12.5
19.3
13.4
23.96
17.2
Correlation
**
0.54 0.50 0.70 0.53 0.39
Table 2: Comparative analysis of beat-to-beat X point
detection results with respect to echocardiography.
Average error is defined by the average of X-X
Echo
. The
average absolute error is defined by the average of |X-
X
Echo
|, whereas SD is the standard deviation of |X-X
Echo
|.
All reported error and SD values are in ms. (
*
) Niccomo
ICG device from Medis®. (
**
) Spearman correlation
(p<0.001). (
***
) Pearson correlation (p<0.001).
Proposed
Method
Shyu
et al.
Onu et
al.
Nic
*
Av. Er. 29.3 -59.9 14.2 -39.5
Av. Abs. Er.
SD
32.2
25.0
61.9
38.0
34.6
22.3
44.1
37.3
Correlation
**
0.44 0.15 0.16
***
0.22
Table 3: Comparative analysis of beat-to-beat LVET
detection results with respect to echocardiography
reference. The average absolute error is defined by the
average of |LVET-LVET
Echo
|, whereas SD is the standard
deviation of |LVET-LVET
Echo
|. All reported error and SD
values are in ms. (
*
) Niccomo ICG device from Medis®.
(
**
) (p<0.001).
Proposed
Method
Shyu et al. Onu et al. Nic
*
Av. Abs. Er.
SD
34.8
38.0
73.7
43.3
38.6
24.4
54.0
41.8
Correlation
**
0.36 0.05 0.14 0.33
As can be observed in table 1 and table 2, the
aforementioned biases are significantly reduced
using the new definitions proposed in this work for
the B and X points. Regarding B-point identification,
the proposed method achieves the smallest and most
stable estimation errors among all algorithms, i.e. an
absolute error of 12.4± 8.7 ms is obtained. This is
35.8% smaller compared to the smallest estimation
error achieved by any of the remaining classical
methods. Furthermore, as is depicted in fig. 6 (top),
Figure 6: Bland-Altman bias plots of the estimated beat-
to-beat B and X points with respect to the opening and
closing of the aortic valve measured with
echocardiography. Horizontal dashed lines represent mean
error and mean error ± standard deviation of error,
respectively. (top) B error distribution. Horizontal axis is
defined by (RB+RAVO)/2, where RB and RAVO define,
respectively, the time interval between the ECG’s R-peak
and the estimated B point, and the R-peak and the
measured aortic valve opening moment. (bottom) X error
distribution. Horizontal axis is defined by (RX+RAVC)/2,
where RX and RAVC define, respectively, the time
interval between the ECG’s R-peak and the estimated X
point, and the R-peak and the measured aortic valve
closing moment.
BIOSIGNALS 2011 - International Conference on Bio-inspired Systems and Signal Processing
166

the estimation error dispersion is not dependent on
the actual value of B; it distributes evenly for a large
range of B durations. Regarding the correlation
coefficient, it is observed that the new method
exhibits a smaller correlation compared to Onu’s
algorithm (0.54 vs. 0.70), although the dispersion of
the estimations is significantly smaller for the new
method. The reason for this is due to the fact that the
ICG B-point notch is not always well defined or
present in the signal. For Onu’s method this is not
very significant, since it does not rely on the notch to
detect the B point (the reason for the performance of
Niccomo’s algorithm is unknown). Another reason
for this lower correlation is noise. High-order
derivatives are high-pass filters, which amplify high-
frequency noise.
Regarding the definition of a marker for the
detection of the onset of the aortic valve opening
event, it is observed that the worst results were
achieved using the zero-crossing principle. It
exhibits a significantly larger absolute error as well
as dispersion compared to the other marker
definitions considered. This is due to the fact that (i)
it is known that the zero line may change as a
function of respiration (Reddy et al., 1988) and (ii)
the zero-crossing points tends to occur before the
notch induced by the aortic valve opening event. In
some situations this might induce that no zero-
crossing exists in the dZ/dt signal between the
ECG’s R-peak and the C-point in the ICG.
Regarding the detection of the X point, which
relates to the closing of the aortic valve, it is
observed from the inspection of the results reported
in table 2 that the identification errors are
significantly higher for all methods compared to the
performance achieved for B point detection. The
reason for this is linked to the fact that typical ICG
signals exhibit many minima to the right of the C-
point. In many circumstances these minima are very
similar in amplitude and, therefore, are very prone to
noise interference. Nevertheless, it is seen that the
proposed method has the lowest estimation error
(32.2 ms) and the highest correlation (0.44) with
respect to the annotated echocardiography. These
results clearly show that the traditional definition of
the X point does not correlate well to the closing of
the aortic valve and that the proposed definition and
algorithm significantly improves the estimation of
the aortic valve closing moment. Moreover, fig. 6
(bottom) shows that the performance of the proposed
method is stable for a significant range of systolic
timings.
4 CONCLUSIONS
Based on synchronized echocardiography-ICG data,
we have shown in this work that the classical
definition of B and X points in the ICG exhibit a non
constant bias and a reduced correlation to the
physiological systolic events they are mend to
capture, i.e. the opening and closing of the aortic
valve. This might have a significant impact on the
applicability of ICG in clinical practice, since it
determines the accuracy of the most useful diagnosis
variables - systolic time intervals, contractility and
stroke volume that can be obtained using the signal.
Currently, many researchers also use ICG to
compensate for PEP in pulse transit time
measurement (Payne et al., 2006). The finding
reported herein might also be significant in this
context.
A new definition for the main systolic
characteristic points in the ICG is suggested. These
points minimize the offset with respect to the
physiological events related to the left ventricle
ejection. Based on these new definitions, an
algorithm was introduced that enables a significant
reduction in left ventricle ejection time estimation
errors, while increasing its estimation stability, i.e.
lowering the estimation error dispersion and
increasing the correlation with respect to
echocardiography based measurements. The
algorithm enables the detection of the onset of left
ventricle ejection with an average absolute
estimation error of 12.4 ± 8.7 ms with a correlation
coefficient of 0.54. This is about 35.8% smaller
when compared to state of the art methods using the
classical definition of the B-point. Regarding the
detection of the end of the left ventricle ejection
phase, the proposed algorithm performs significantly
better compared to other state of the art methods.
The detected characteristic points exhibit a much
higher correlation (0.44) to the closing of the aortic
valve than other competing methods (best achieved
correlation 0.22). The average absolute detection
error of this event (32.2 ± 25.0 ms) is higher
compared to the performance achieved for the
detection of the onset of the left ventricle ejection.
Yet, it is smaller (in some cases almost 50% smaller)
and less dispersed compared to state of the art
methods. One might speculate that this might have a
significant impact on the value of ICG in medical
practice e.g. for cardiac output estimation. However,
its clear demonstration probably requires a new
study using thermo dilution as reference.
ROBUST CHARACTERISTIC POINTS FOR ICG - Definition and Comparative Analysis
167

ACKNOWLEDGEMENTS
This work was supported in part by the EU FP7
project HeartCycle (FP7–216695) and SoundForLife
(PTDC/EIA/68620/2006; FCOMP-01-0124-
FEDER-007243) financed by the Portuguese
Foundation for Science and Technology. The authors
want to express their gratitude to the 17 students
from the Centro Hospitalar de Coimbra (CHC) who
volunteered for this study. The authors would also
like to recognize and to express their appreciation to
the Centro Hospitalar de Coimbra for supporting the
study. The effort of Dr. Leitão Marques from CHC
in facilitating the arrangements for the data
acquisition part of the study is also acknowledged.
REFERENCES
Chan G., Middleton P., Celler B., Wang L., Lovell N.,
2007, Automatic detection of left ventricular ejection
time from a finger photoplethysmographic pulse
oximetry waveform: comparison with Doppler aortic
measurement, Physiol. Meas., 28:439–452
Gotshall R., Wood V., Miles D., 1989, Comparison of two
impedance cardiographic techniques for measuring
cardiac output, Ann. Biomed. Eng., 17:495-505.
Nagel J., Shyu L., Reddy S., Hurwitz B., McCabe P.,
Schneiderman N., 1989, New signal processing
techniques for improved precision of noninvasive
impedance cardiography, Ann. Biomed. Eng., 17:517-
534.
Onu T., Miyamura M., Yasuda Y., Ito T., Saito T.,
Ishiguro T., Yoshizawa M., Yambe T., 2004, Beat-to-
beat evaluation of systolic time intervals during
bicycle exercise using impedance exercise, Tohoku J.
Exp. Med., 203:17-29.
Pandey V., Pandey P., 2005, Cancellation of respiratory
artifact in impedance cardiography, Proc. of the Ann.
Conf. of IEEE-EMBC.
Payne R. A., Symeonides C. N., Webb D. J., Maxwell S.
R., 2006, Pulse transit time measured from the ECG:
an unreliable marker of beat-to-beat blood pressure. J
Appl. Physiol., 100:136-41.
Reddy S., Shyu L., Hurwitz B., Nagel J. H., 1988,
Schneiderman N., Improved reliability of impedance
cardiography by new signal processing techniques.
Proc. of the Ann. Conf. of IEEE-EMBC.
Shuguang Z., Yanhong F., Hailong Z., Min T., 2005,
Detection of Impedance Cardiography’s characteristic
points based on wavelet transform, Proc. of the Ann.
Conf. of IEEE-EMBC, 2730-2732.
Shyu L. Y., Lin Y.-S., Liu C.-P., Hu W.-C., 2004, The
detection of impedance cardiogram characteristic
points using wavelets, Computers in Biology and
Medicine, 34:165-175.
Tavel M., 1967, Clinical Phonocardiography and external
pulse recording, Year Book Medical Publishers, Inc.
Visser K. R., Mook G. A., Van der Wall E., Zijlstra W.,
1993, Theory of the determination of systolic time
intervals by impedance cardiography, Biological
Psychology, 36(1-2):43-50.
Visser K., Mook G., Van der Wall E., Zijlstra W., 1991,
Systolic time intervals by impedance cardiography.
Proc. of the Ann. Conf. of IEEE-EMBC.
Wang X., Sun H. Water J., 1995, An advanced signal
processing technique for impedance cardiography,
IEEE Trans. on BioMed. Eng., 42(2):224-230.
BIOSIGNALS 2011 - International Conference on Bio-inspired Systems and Signal Processing
168
