
HEMODYNAMIC FEATURES EXTRACTION FROM A NEW
ARTERIAL PRESSURE WAVEFORM PROBE
V. G. Almeida, P. Santos, E. Figueiras, E. Borges, T. Pereira, J. Cardoso, C. Correia
Centro de Instrumentação (GEI-CI), University of Coimbra, Coimbra, Portugal
H. C. Pereira
Centro de Instrumentação (GEI-CI), University of Coimbra, Coimbra, Portugal
ISA- Intelligent Sensing Anywhere, Coimbra, Portugal
Keywords: Arterial pressure waveform, First derivative, Pulse contour analysis, Systolic peak, Dicrotic notch, Dicrotic
peak and reflection point.
Abstract: In this work, we discuss an algorithm that reliable and accurately identifies the prominent points of the
cardiac cycle: the systolic peak (SP), reflection point (RP), dicrotic notch, (DN) and dicrotic peak (DP). The
prominent point’s identifier algorithm (PPIA) action is based on the analysis a number of features of the
arterial pressure waveform and its first derivative, and is part of the fundamental software analysis pack for
a new piezoelectric probe designed to reproduce the arterial pressure waveform from the pulsatile activity
taken non-invasively at the vicinity of a superficial artery. The output PPIA is the coordinates (in time and
amplitude) of the above referred points. To assess the accuracy of the algorithm, a reference database of 173
pulses from eight volunteers, was established and the values yielded by the PPIA were compared to
annotations from a human expert engineer (HEE). The quality of the results is statistically quantified either
in time as in amplitude. Average values of 4.20% for error, 99.09% for sensitivity and 96.77% for positive
predictive value were found to be associated to time information while amplitude yields averages of 2.68%,
99.08% and 98.22%, respectively, for the same parameters.
1 INTRODUCTION
Over the last years, increasing attention has been
paid to the effect of arterial stiffness, the measure of
rigidity of arteries (Mackenzie et al, 2002), on the
development of cardiovascular (CV) diseases
(Laurent et al, 2006).
The study of non-invasive methods that address
this problem, using devices capable of precisely
assessing the arterial pressure waveform (APW)
remains a capital issue that mobilizes the interest of
researchers. Pulse diagnosis has proved to be a
convenient, inexpensive and painless diagnosis
method; however experience has also shown that, in
order to obtain reliable results, it may require
practitioners with considerable training and
experience (Avolio et al, 2010).
Historically, the cuff sphygmomanometer,
universally used by clinicians since the beginning of
the 20th century, was the first device to quantify a
part of the information contained in the APW and
conquered a (still) irreplaceable role in general
clinical practice. The measurement of pulse
pressure, however, is the simplest surrogate measure
of arterial stiffness.
Nevertheless, the APW contains a vast amount of
pathophysiological information about the
cardiovascular condition that is concealed in its
morphology. Many factors can determine the
contour of the APW: the blood volume ejected from
the heart, the distensibility of the arterial vessel,
runoff of the blood to the periphery, rate of the
velocity of blood in the vessels and the vascular
properties of the vessels (Oppenheim et al, 1995).
Although different technologies have been put to
the service of this major endeavour, a short review
of recent literature leads us to the conclusion that
applanation tonometry (e.g. Sphygmocor® from
195
G. Almeida V., Santos P., Figueiras E., Borges E., Pereira T., Cardoso J., Correia C. and C. Pereira H..
HEMODYNAMIC FEATURES EXTRACTION FROM A NEW ARTERIAL PRESSURE WAVEFORM PROBE.
DOI: 10.5220/0003148901950200
In Proceedings of the International Conference on Bio-inspired Systems and Signal Processing (BIOSIGNALS-2011), pages 195-200
ISBN: 978-989-8425-35-5
Copyright
c
2011 SCITEPRESS (Science and Technology Publications, Lda.)
AtCor, West Ryde, Australia and PulsePen® from
DiaTecne, Milan, Italy) remains the golden standard,
only second to the invasive catheterization.
As for the technologies based on
electromechanic sensors, PZ probes have been
studied either for assessing timing parameters of the
APW (McLaughlin et al 2003) or for monitoring
APW at the radial artery (Clemente et al 2010).
They also are in the basis of some commercial
instruments dedicated to PWV assessment (e.g.
Complior® from Artech-Medical, Pantin, France).
A number of beat detectors have been reported
(Donelli et al, 2002 and Oppenheim et al, 1995) for
characterizing APW in the literature; however the
full delineation of APW remains a capital issue that
motivates our investigation.
In a previous study carried out by our group, a
piezoelectric probe for non-invasive arterial pressure
waveform reproduction was developed.
In this paper an automatic delineator of the
characteristic features of the APW, meant to works
in articulation with the probe, is proposed. Its action
relies on the coordinates (time vs. amplitude) of the
4 prominent points that can be identified in the
APW: systolic peak (SP), reflection point (RP),
dicrotic peak (DP) and dicrotic notch (DN).
2 PIEZOELECTRIC PROBE
In a previous study, a piezoelectric probe capable of
recovering the arterial pressure was developed.
This device delivers as output, a high fidelity
replica of the APW, free from baseline drift due to
the action of a BLR circuit that avoids the need of
offline removal algorithms for this purpose (Xu et
al, 2007).
The elimination of baseline drift by the BLR
circuit consists in forcing the foot of systolic pulses
to start close to zero, without affecting the shape of
the signal.
This action is triggered only at the end of the
cardiac pulse, just before the starting of a new pulse.
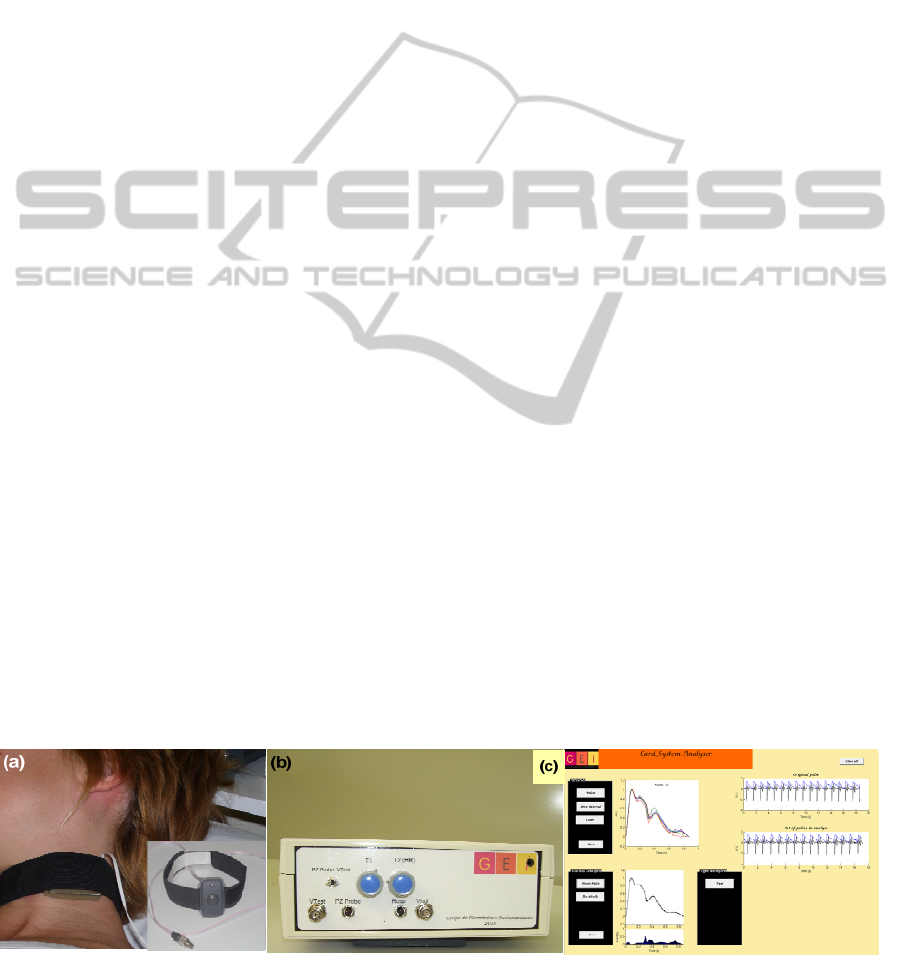
Figure1 illustrates the main components of our
pulse acquisition system: The PZ probe, left
photograph, is held by a collar and placed in the
carotid artery site for the in vivo data acquisition.
Signal conditioning and data acquisition (USB
6009 from National Instruments are enclosed in the
electronics box (mid panel).
A personal computer running a dedicated
software package with PPIA, shown in the right
panel, completes the system.
3 METHODOLOGY
Once the foundations of our delineator are defined
we assess the capability of the algorithm in
identifying various prominent points from which the
clinically relevant waveform features are computed.
To attain this goal, a small universe of eight
healthy volunteers was organized as the seed of a
larger data base of cardiac pulses to be build in the
follow-up of this work.
The study protocol was approved by the ethical
committee of Centro Cirúrgico de Coimbra,
Portugal. All subjects were volunteers that
previously granted a written informed consent.
A set of pulses was acquired from each volunteer
followed by a pulse by pulse segmentation, routine,
as depicted in figure 2. The onset of the waveform is
identified in the signal conditioning circuit
according the heart rate value.
3.1 Physiologic Foundation
Four prominent points are generally identifiable in a
typical APW profile: SP, RP, DN and DP. Their
physiological origin is briefly recalled in the
following paragraphs.
The arterial pressure wave propagates along the
arterial tree and, as its branches change in diameter
Figure 1: The main components of our non-invasive system for hemodynamic analysis. (a) PZ probe; (b) Acquisition box;
(c) Graphical User Interface.
BIOSIGNALS 2011 - International Conference on Bio-inspired Systems and Signal Processing
196
Figure 3: Flowchart of the PPIA.
0 2 4 6 8 10 12 14 16 1
8
0
1
2
Time (s)
A
.
U
.
0 0.2 0.4 0.6 0.8 1
0
0.5
1
Pulses: 10
Time (s )
A.U.
Figure 2: Set of carotid pulses and the corresponding pulse
segments.
and stiffness, reflections of a portion of the original
energy is sent back towards the heart.
The waves reflected from the periphery,
superimpose to the forward wave originating a
visible change in the APW profile which determines
the RP.
Further to RP, the identification of the SP,
simply defined as the point of maximum systolic
pressure, allows the determination of a very
important hemodynamic parameter that denotes the
increase of pressure imparted by the reflected wave -
the Augmentation Index (AI), (Almeida et al, 2010).
The aortic DN pulse is associated to the effect of
the aortic valve closure when a small portion of
ejected blood moves back to the left ventricle
(Donelli et al 2002). This feature must be identified
by the delineator in order to accurately determine the
end of ventricular ejection, which is necessary for
cardiac output determinations.
The pulse profile is characterized by two peaks,
SP and the DP, one valley, DN, and one inflection,
RP. The PPIA must deal with the specification of
each one of these shapes in order to produce an
accurate identification of all four prominent points.
3.2 The Algorithm
As mentioned before, the main purpose of the
algorithm is the identification (in time and relative
amplitude) of the prominent points of the cardiac
cycle and make them available for analysis in an
understandable, clear way.
Flowchart of figure 3 depicts the main sequence
of operations performed by our Prominent Points
Identifier Algorithm (PPIA). The delineator is based
on the combined analysis of APW and its first order
derivative.
After acquiring a few pulses, around 10 in the
example of figure 2, the pulses are subject to a
segmentation process and normalised to the
diastolic-systolic pressure interval.
The use of the first derivative curve justifies that,
immediately following acquisition, a low pass filter
is used to suppress high frequency noise that would,
otherwise, turn the first derivative unusable. The
50Hz turn point of the filter ensures the interesting
range of frequencies to ensure the visibility of the
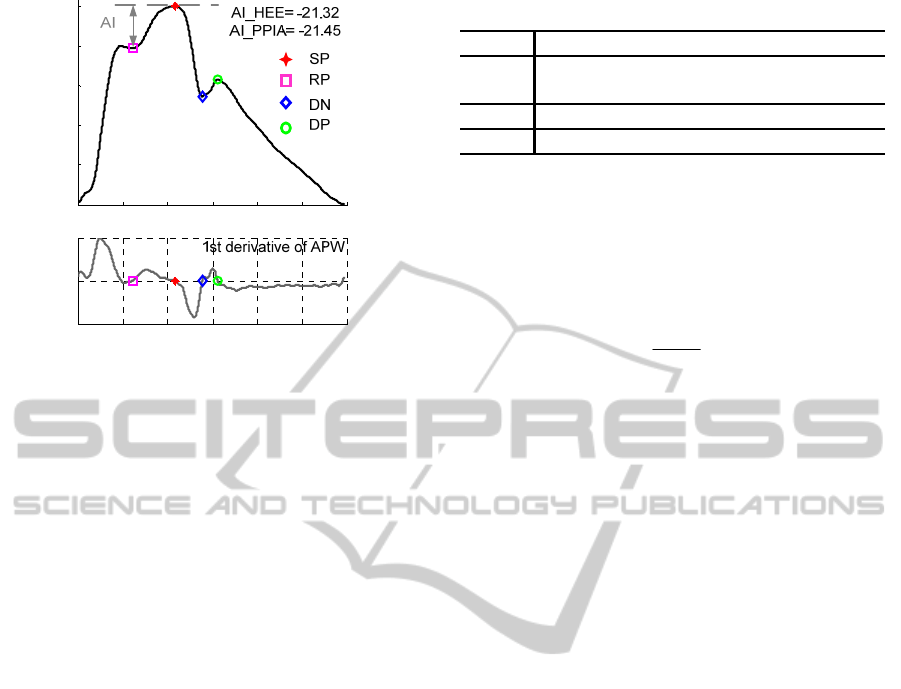
points. Figure 4 shows one pulse with its prominent
points identified by the PPIA. As an example, the AI
of the corresponding volunteer is also derived.
3.2.1 Systolic Peak (SP)
The SP identification is carried out using a local
extreme identification routine (Billauer, 2008).
This routine detects a maximum only if the value
of the previous minimum differs by a selectable
minimum amount, referred to as delta.
HEMODYNAMIC FEATURES EXTRACTION FROM A NEW ARTERIAL PRESSURE WAVEFORM PROBE
197
0 0.1 0.2 0.3 0.4 0.5 0.6
0
0.2
0.4
0.6
0.8
1
A.U.
0 0.1 0.2 0.3 0.4 0.5 0.6
-1
0
1
Time (s )
A.U.
Figure 4: Example of type A pulse waveform and its
prominent points identified by PPIA.
Since the cardiac cycle shows a variable number
of local maxima (2 to 4 depending on wave type and
artefacts), the routine must run repeatedly, with
different values of delta, to ensure the correct
identification of the SP.
3.2.2 Dicrotic Notch (DN) and Dicrotic Peak
(DP)
The identification of the SP combined with the zero
crossing values of the first order derivative is used to
identify the dicrotic points (notch and peak) that
must be located between the SP and the end of the
pulse.
The oscillations that inevitably occur can mask
the true DN and DP values. To prevent this, zero
crossing information must be combined with the
amplitude values of the APW pulse.
3.2.3 Waveform Type
According to the criteria proposed by Murgo et al
(1980) the pressure waveform can be classified into
one of four types (A, B, C, D) depending on the
location of the reflected wave, as shown in table 1.
To achieve this, the algorithm analyses the
waveforms deriving the number of maximum peaks
of the 1st order derivative of the APW taking as
reference the localization of the SP.
3.2.4 Reflection Point (RP)
The RP identification is carried out in three steps:
the localization of candidates, the elimination of
oscillations and the comparison with the APW
amplitude.
Table 1: Classification proposed by Murgo et al (1980).
3.2.5 Augmentation Index (AI)
Augmentation index (AI) is one of the most widely
used indices to quantify the arterial stiffness, based
on the measurement of the strength of the reflected
wave relative to the total pressure waveform.
PP
Si
AI
PP
SD
−
=±
−
(1)
Where P
S
is the APW peak pressure, P
i
its
pressure at the inflection point and P
D
is the diastolic
blood pressure.
Types A and B show positive values of AI
denoting high arterial stiffness situations, while in
type C waveforms the negative values of AI is
characteristic of a relatively elastic and healthier
artery condition.
The key point in estimating AI is the correct
identification of the RP, to allow the subsequent
assessment of the relative augmentation that the
reflected wave imparts to the pressure waveform.
Several methods have been described in the
literature to evaluate this parameter. The algorithm
developed in this work is compared with the
classification of a human expert engineer (HEE) to
understand the effect of wrong RP identifications in
AI calculation.
3.3 Evaluation Procedure
To acquire the pulses we used a previously
developed pulse probe and organised a small
universe of eight volunteers from which a reference
database was built up.
In a first step, we used the algorithm described
above to identify the prominent points - SP, DN, DP
and RP. A human expert engineer (HEE) carefully
inspected each APW pulse and manually annotates
the same points.
All points are classified in the three classic types:
true positive (TP) and, just for the discrepant ones,
false negative (FN) and false positive (FP). FNs
occur only when the point cannot be identified.
The classification takes the HEE results as
reference and uses the same 8 ms threshold adopted
by others (Li et al, 2010 and Zong et al, 2003).
Type A
The RP occurs before SP
Type B
The RP occurs shortly before of the SP (a
threshold must be defined)
Type C
The RP occurs after SP
Type D
The inflection point cannot be observed
BIOSIGNALS 2011 - International Conference on Bio-inspired Systems and Signal Processing
198
y=0.736x+0.208
0.65
0.75
0.85
0.95
0.65 0.75 0.85 0.95
CSAAmplitude(V)
ManualAnnotationsAmplitude(V)
y=1.003x+1.398
70
90
110
130
150
170
190
210
230
250
70 120 170 220
CSATime(ms)
ManualAnnotationsTime(ms)
y=0.997x+0.533
80
130
180
230
280
330
80 130 180 230 280 330
CSA Time (ms)
ManualAnnotationsTime(ms)
0.6 0.7 0.8 0.9
-0.2
-0.1
0
0.1
0.2
Me an (HA and CSA) [Amp(V)]
HA-CSA [Amp(V)]
1.96 sd
-1.96 sd
mean
100 150 200 250 300
-20
-10
0
10
20
Mean (HA and CSA) [Time(s)]
HA-CSA [Time(s)]
1.96 sd
-1.96 s d
mean
0 50 100 150 200
-50
-30
-10
0
10
30
50
Mean (HA and CSA) [Time(s)]
HA-CSA [Time(s)]
1.96 sd
-1.96 sd
mean
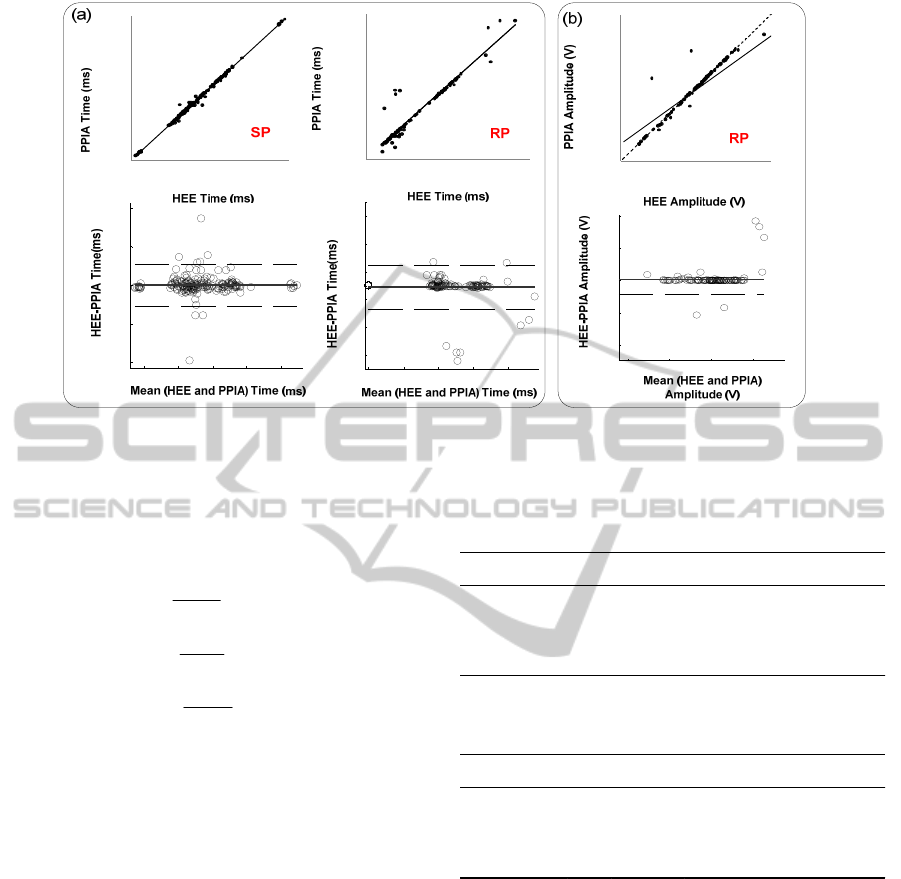
Figure 5: Agreement between the SP and RP obtained via PPIA and HEE (a) time information of SP and RP; (b) relative
amplitude of RP. Regression plots (top) and Bland-Altman plots (bottom).
Sensitivity (S), positive predictive value (P
+
) and
error of the PPIA algorithm shown in table I are now
computed according to:
TP
S
TP FN
=
+
(2)
TP
P
TP FP
+
=
+
(3)
FP FN
error
TP FP
+
=
+
(4)
An identical procedure is carried out in the
amplitude sense, using a 1% of pulse maximum,
threshold.
4 RESULTS
Tables 2 and 3 show the sensitivity, positive
predictive value and error of the algorithm for the
time and amplitude information, respectively.
Statistical analysis was performed using
Microsoft Excel® 2007 and SPSS® version 18.
As expected, RP shows the worst performance
indices due to its inherent detection difficulty, either
for the HEE as for the PPIA.
The three last columns of table 2 yield average
values of 4.20%, 99.09% and 96.77 % for error, S
and P
+
, respectively.
The same study applied to the amplitude
information of table 3 yields averages of 2.68%,
99.08% and 98.22 %.
Table 2: Validation of PPIA performance (time
information) compared to HEE annotations.
Table 3: Validation of PPIA performance (amplitude
information) compared to HEE annotations.
Figure 5 a) shows the correlation between the
reference HEE and PPIA values (SP and RP
analysis), as well the corresponding Bland - Altman
plots.
The straight line fittings for SP and RP show an
excellent correlation, where R
2
is the
square of the
sample correlation coefficient, between both
estimates (R
2
=0.996 and R
2
=0.907, respectively).
The PPIA, in average, overestimates the SP by
0.009 ms and underestimates the RP by 0.99 ms. To
explain the 100 fold factor between the estimation
errors for SP and RP one should bear in mind that, in
the APW curve, SP is a peak while RP is an
inflection. This circumstance makes the SP
estimation much easier for the HEE as well as for
the PPIA. Should the data base be large enough and
Pulses TP FP FN Error (%) S (%)
P
+
(%)
SP
173 171 2 0 1.15 100 98.84
DN
173 165 8 0 4.62 100 95.37
DP
173 169 4 0 2.31 100 97.69
RP
173 159 8 6 8.38 96.36 95.20
Pulses TP FP FN Error (%) S (%)
P
+
(%)
SP
173 173 0 0 0 100 100.00
DN
173 171 2 0 1.15 100 98.84
DP
173 172 1 0 0.58 100 99.42
RP
173 158 9 6 8.98 96.34 94.61
HEMODYNAMIC FEATURES EXTRACTION FROM A NEW ARTERIAL PRESSURE WAVEFORM PROBE
199

the SP error would tend to zero while RP would
eventually converge to a minimum, non-zero, biased
level. This, however, remains a hypothesis to be
demonstrated in the follow-up of this work.
Another interesting consequence of the nature of
SP and RP is that amplitude errors summarized in
table 3 are much lower than the corresponding time
errors (table 2). In fact as they are both associated to
a peak and an inflection, the first derivative of the
APW curve shows close-to-zero values in their
vicinity, hence the small resulting estimation error.
This fact is visible in figure 5 b) that shows the
correlation between the reference HEE and PPIA
values for RP analysis, as well the corresponding
Bland - Altman plot.
In fact, as can be seen in figure 6, AI error,
measured by the difference between AI values from
HEE and PPIA, amounts to an average value of just
0.53 %.
Figure 6: The relationships between AI obtained from
PPIA and HEE.
Table 4: Statistics information of measurements depicted
in figure 6.
5 CONCLUSIONS
We described new automatic feature extraction
algorithm capable of detecting the prominent points
of the APW: SP, DN, DP and RP. This algorithm is
a fundamental part of the automatic analysis tool in
our non-invasive system for hemodynamic analysis.
The clinical use of our probe, however, will still
require a medical oriented, multicenter study
including comparison with standard methods, e.g.
applanation tonometry and catheter collected data.
The need for a larger data base has also emerged as
the only means of attaining the necessary levels of
confidence.
ACKNOWLEDGEMENTS
We acknowledge support from Fundação para a
Ciência e a Tecnologia for funding (PTDC/SAU-
BEB/100650/2008) and SFRH/BD/61356/2009) and
from ISA, Intelligent Sensing Anywhere.
REFERENCES
Almeida V., Pereira T., Borges E., Figueiras E., Cardoso
J., Correia C., Pereira H. C., Malaquias J. L. and
Simões J. B., 2009. Synthesized cardiac waveform in
the evaluation of augmentation index algorithms. In
IEEE EMB, Proceedings of the 3rd International Joint
Conference on Biomedical Engineering Systems and
Technologies (BIOSTEC 2010). Valencia, Spain 20-
23 January 2010.
Avolio A. P., Butlin M., and Walsh A., 2010. Arterial
blood pressure measurement and pulse wave analysis -
their role in enhancing cardiovascular assessment.
Physiol. Meas. 31, R1–R47.
Billauer E.,2008. Peak detection using MATLAB.
http://www.billauer.co.il/peakdet.html. [Accessed 13
July 2010]
Clemente F, Arpaia P and Cimmino P 2010 A piezo-film-
based measurement system for global haemodynamic
assessment Physiol. Meas. 31 697–714.
Laurent S., Cockcroft J., Van Bortel L., Boutouyrie P.,
Giannattasio C., Hayoz D., Pannier B., Vlachopoulos
C., Wilkinson I., and Struijker-Boudier H., 2006.
Expert consensus document on arterial stiffness:
methodological issues and clinical applications.
European Heart Journal, 27, 2588–2605.
Li, B. N., Dong, M. C., Vai, M. I., 2010. On an automatic
delineator for arterial blood pressure waveforms.
Biomedical Signal Processing and Control, 5, 76-81.
Oppenheim, M. J., Sittig, D. F., 1995. An innovative
dicrotic notch detection algorithm which combines
rule-based logic with digital signal processing
techniques. Computers and biomedical research, 28,
154-170.
Mackenzie I. S., Wilkinson I. B. and Cockroft J. R., 2002.
Assessment of arterial stiffness in clinical practice. Q J
Med., 95, 67–74.
Robinson L., 1961 Reduction of Baseline Shift in Pulse-
Amplitude Measurements. Rev. Sci. Instr. 32, 1057.
Xu, L., Zhang, D., Wang, K., Li, N., Wang, X., 2007.
Baseline wander correction in pulse waveforms using
wavelet-based cascaded adaptative filter. Computers in
Biology and medicine, 37, 716-731.
Zong, W., Heldt, T., Moody, G.B., Mark, R.G., 2003. An
open source algorithm to detect onset of arterial blood
pressure pulses. Computers in Cardiology, 30, 259-
262.
y=0.961x+0.962
R²=0.948
‐30
‐20
‐10
0
10
20
30
40
‐30 ‐20 ‐10 0 10203040
AI_PPIA (%)
AI_HEE (%)
N
Minimum
(%)
Maximum
(%)
Mean
(%)
Std.
Deviation (%)
Error 167 0.00 19.09 0.53 2.47
Descriptive Statistics
BIOSIGNALS 2011 - International Conference on Bio-inspired Systems and Signal Processing
200
