
AN ALGORITHM FOR THE DETECTION OF ATRIAL
FIBRILLATION USING THE PULSE OXIMETRIC SIGNAL
Giovanni Calcagnini, Michele Triventi, Federica Censi, Eugenio Mattei, Pietro Bartolini
Dept. of Technology and Health, Italian Institute of Health, Viale Regina Elena 299, Rome, Italy
Francesco Mele
Department of Cardiology, S. Filippo Neri Hospital, Rome, Italy
Keywords: Atrial fibrillation, Pulse oximetry, Rhythm classification.
Abstract: A method for the discrimination of atrial fibrillation and sinus rhythm from the pulse oximetric signal is
presented. The method is based on the analysis of the ventricular rhythm irregularity, quantified by the
Coefficient of Variation and the Shannon Entropy of the ventricular inter-beat intervals. A classifier based
on the Mahalanobis distance is then applied. Sixty patients with an history of recurrent atrial fibrillation
were studied. The method yielded a correct classification of 43 out of 43 patients with sinus rhythm, 14 out
of 14 patients with atrial fibrillation, and 3 out of 4 patients with other arrhythmias.
1 INTRODUCTION
Atrial fibrillation (AF) is the most common cardiac
arrhythmia in western countries. The current
prevalence of nontransient AF in the US is 4% in
the population of 65 to 70 years of age, and of 10%
for people ≥ 80 years of age and is projected to
increase considerably by 2050 (Naccarelli et al,
2009). AF is an independent risk factor for death
and a major cause of stroke (Go et al, 2001). There
are evidences that AF sustains itself through a
complex process that is initiated by high atrial rate,
cytosolic calcium overload, metabolic depletion and
contractile dysfunction. Conversion of AF to sinus
rhythm by antiarrhythmic drugs is relatively
effective when AF duration is short (Kirchhof et al,
2009), whereas when AF duration exceeds two
weeks the efficacy is greatly diminished.
These evidences suggest that early diagnosis is a
key element to prevent the progression of AF and
reduce atrial fibrillation-related complications.
Another significant implication of asymptomatic AF
is related to the need for oral anticoagulation.
Withdrawal of oral anticoagulation after therapeutic
interventions (e.g. electrical or pharmacological
cardioversion, radiofrequency ablation) should be
considered carefully, based on reliable and objective
measures rather than symptoms.
Currently, diagnosis of AF is based on the
analysis of the ECG signal. Due to the poor
correlation between symptoms and AF (Israel 2004;
Rho et al, 2005) the rate of detection of AF episode
are strongly affected by the intensity of monitoring.
Arya et al, reviewed the various ECG-based follow-
up strategies to detect AF recurrencies after
radiofrequency ablation and estimated that
conventional Holter electrocardiogram (ECG)
recordings have a low diagnostic yield for
paroxysmal AF, newer technologies like patient-
operated or telemetric ECG systems, long-term
Holter monitors, or even implanted ECG monitors
carry the promise of allowing an early diagnosis of
silent AF.
Automatic detection of AF is achieved by
analysis of the electrocardiographic signal. The
absence of the P-waves is the main criterium for AF
detection. Alternative methods have been proposed.
These methods are based on the measure of the
irregularity of the ventricular rhythm. Various
measures of such irregularity are known. These
measures quantify the variability of the ventricular
inter-beat intervals (RR interval) obtained from the
ECG signals, using combinations of various
features: standard deviations and probability density
429
Calcagnini G., Triventi M., Censi F., Mattei E., Bartolini P. and Mele F..
AN ALGORITHM FOR THE DETECTION OF ATRIAL FIBRILLATION USING THE PULSE OXIMETRIC SIGNAL .
DOI: 10.5220/0003150804290432
In Proceedings of the International Conference on Bio-inspired Systems and Signal Processing (BIOSIGNALS-2011), pages 429-432
ISBN: 978-989-8425-35-5
Copyright
c
2011 SCITEPRESS (Science and Technology Publications, Lda.)

function (Tateno and Glass, 2001), wavelet
transform (Duverney et al, 2002) entropy, Lorenz
plots (Esperer et al, 2008), probability density
function of an embedded time series (Hong-Wei et
al, 2009), turning point ratio, standard deviation and
entropy (Dash et al, 2009), Markov modelling in
combination with P-wave analysis (Babaeizadeh et
al, 2009), Poincarè plots (Park et al 2009).
Some of these parameters does not suit a short-
term detection since they requires a relatively large
number of beats, others require significant
computational effort / memory occupation. In this
study, such methods have been excluded.
PP interval, e.g, the ventricular inter-beat interval
measured from the pulse oximetric wave, has been
proposed as an alternative to RR interval, during
normal sinus rhythm (Lu et al, 2008; Foo et al,
2006). The reliability of ventricular rhythm
estimation from PP intervals during AF is not
known.
2 METHODS AND MATERIAL
2.1 AF Detection Algorithm
The detection of an atrial fibrillation episode is
based on the extraction of quantitative indexes from
the PP and ΔPP time series.
To distinguish between SR and AF we use the
entropy (EN) of the PP interval series and the
coefficient of variation (CV) of the ΔPP intervals.
The entropy is estimated as follows:
∑
i
iiPP
ppEN
2
log
(1)
where p is the estimated probability density function
of the PP series.
Since the mean of the ΔPP sequence leads to zero,
we calculated the CV by dividing the standard
deviation of the ΔPP intervals by the mean of the PP
sequence
PP
PP
PP
CV
P
V
'
'
(2)
To implement an automatic decision criterion,
based on the CV and En, we used the Mahalanobis
distance, which takes into account the covariance
among the variables in calculating distances.
Mahalanobis distance (D
M
) of a multivariate
vector x from a group of values with mean μ and
covariance matrix S is defined as:
)()()(
1
PP
xSxxD
T
M
(3)
In order to have a parameter to discriminate AF
vs. SR patient, Mahalanobis distance from AF and
SR population was calculated for each patient.
The mean values of CV and EN were calculated for
AF and SR patients, and the two covariance matrices
were obtained:
=
0.0086 0.0076
0
.
00
7
6
0
.
0
1
98
(4)
=
0.0022 0.0054
0.0054 0.2129
(5)
For the i
th
patient the Mahalanobis distances from
the two groups are obtained as
() =
−
−
−
−
(6)
() =
−
−
−
−
(7)
We classified the patient as belonging to the
group for which the Mahalanobis distance is
minimal and it is below a given threshold. In the
case the distances from both groups are greater than
the respective thresholds, the rhythm is classified as
“other arrhythmia”. In this study the squared
thresholds were set at 10, on empirical basis.
2.2 Clinical Validation Protocol
The study was conducted at the Atrial Fibrillation
Unit of S. Filippo Neri Hospital, in Rome. We
studied 60 patients undergoing standard 12-lead
ECG exam for a history/suspect of AF. Heart rhythm
at the time of the examination was classified by an
expert cardiologist as AF, SR or other arrhythmia.
Then, a 5-minute pulse oximetric signal was
acquired from the index of the non-dominant hand
using a MIROXY device (Medical International
Research, Italy). The device firmware was modified
to allow the real-time transmission of the pulse
signal to a PC, using the RS-232 connection.
A single ECG lead was also recorded and
digitized using a National Instrument NI-USB6218
DAQ card, for a further confirmation of the actual
patient rhythm. Patients with pacemaker and/or
defibrillator were excluded from the study.
3 RESULTS
Table 1 shows the characteristics of the patients and
the heart rhythm at the moment of the test, as
classified by the cardiologist from the ECG trace.
BIOSIGNALS 2011 - International Conference on Bio-inspired Systems and Signal Processing
430

Table 1: Characteristics of patients’ population.
Rhythm
N A
ge (mean+/- sd, range) Sex (M/F)
SR 43 65.27 +/- 11.96, 21-87 26/17
AF 13 78.14 +/- 8.29, 67-89 7/6
Other 4 67.75 +/- 10.51, 61-73 4/0
The results of the automated classification from
the ventricular rate irregularity obtained by the pulse
oximetric waveforms are reported in the Tables 2,3,4
for AF, SR and OTHER patients, respectively. The
Tables also report the CV and EN values for each
patient, as well as the distance obtained using the
Mahalanobis metrics. The mean values of CV and
EN of each group are also reported.
Table 2: Classification results of AF group.
Rhythm
/Pt CV
'PP
EN D
2
SR D
2
AF
Classification
AF1 0.368 3.697 50.01 1.39 AF
AF2 0.296 3.492 29.48 0.15 AF
AF3 0.254 3.384 20.34 1.62 AF
AF4 0.321 3.496 35.93 0.79 AF
AF5 0.312 3.491 33.53 0.43 AF
AF6 0.365 3.668 49.12 1.20 AF
AF7 0.331 3.543 38.84 0.50 AF
AF8 0.379 3.626 53.92 3.08 AF
AF9 0.350 3.769 44.68 3.71 AF
AF10 0.283 3.566 26.75 2.08 AF
AF11 0.218 3.235 13.78 5.06 AF
AF12 0.282 3.603 26.77 3.66 AF
AF13 0.315 3.503 34.41 0.37 AF
mean 0.313 3.544 35.198 1.851
Figure 4 gives a pictorial representation of the
population EN and CV (circles), as well as of the
classification results (crosses).
Table 3: Classification results of SR group.
Rhythm
/Pt
CV
'PP
EN D
2
SR D
2
AF
Classification
SR1 0.030 2.019 0.78 154.39 SR
SR2 0.041 2.528 2.35 54.08
SR
SR3 0.055 1.958 0.04 185.75
SR
SR4 0.062 1.349 2.01 457.45
SR
SR5 0.038 2.320 1.38 85.67
SR
SR6 0.019 1.926 1.19 176.53
SR
SR7 0.052 1.953 0.07 185.54
SR
SR8 0.019 1.835 1.07 206.13
SR
SR9 0.060 2.376 0.80 80.05
SR
SR10 0.021 1.612 1.05 292.12
SR
SR11 0.095 1.159 5.52 610.45
SR
SR12 0.093 1.935 0.72 218.11
SR
SR13 0.061 2.085 0.06 149.66
SR
SR14 0.165 2.346 5.84 129.77
SR
SR15
0.085 1.146 4.83 604.87
SR
Table 3: Classification results of SR group.(cont.)
SR16 0.082 1.866 0.46 236.45
SR
SR17 0.024 1.683 0.86 265.31
SR
SR18 0.068 2.334 0.51 90.34
SR
SR19 0.016 1.091 3.25 550.87
SR
SR20 0.057 2.131 0.16 135.21
SR
SR21 0.044 1.783 0.24 240.97
SR
SR22 0.071 2.035 0.03 169.90
SR
SR23 0.170 2.994 7.04 16.00
SR
SR24 0.023 1.730 0.87 246.39
SR
SR25 0.059 0.875 5.93 749.36
SR
SR26 0.026 1.904 0.78 187.41
SR
SR27 0.060 2.927 4.46 28.99
SR
SR28 0.082 2.184 0.23 131.65
SR
SR29 0.019 1.857 1.08 198.79
SR
SR30 0.109 2.858 3.03 24.64
SR
SR31 0.122 2.378 1.92 100.00
SR
SR32 0.020 1.442 1.50 366.75
SR
SR33 0.011 1.647 1.47 270.47
SR
SR34 0.061 2.071 0.04 153.98
SR
SR35 0.019 1.463 1.47 356.08
SR
SR36 0.084 2.232 0.32 120.02
SR
SR37 0.165 2.294 5.87 144.92
SR
SR38 0.157 2.738 5.04 41.58
SR
SR39 0.092 1.891 0.77 233.82
SR
SR40 0.056 2.952 4.96 30.34
SR
SR41 0.065 1.926 0.03 202.50
SR
SR42 0.028 2.361 2.21 76.53
SR
SR43 0.019 1.409 1.62 382.73
SR
mean 0.063 1.991 1.951 217.269
Table 4: Classification results of OTHER group.
Rhythm
/Pt
CV
'PP
EN D
2
SR D
2
AF
Classification
OTHER1 0.167 1.523 11.13 486.25 OTHER
OTHER2 0.309 3.207 32.72 18.45
OTHER
OTHER3 0.232 0.942 34.30 998.65
OTHER
OTHER4 0.148 2.695
4.18
45.92 SR
The proposed method yielded a correct classification
of all the patients with AF (13/13), as well as of all
the patients in SR (43/43). One patient of the
OTHER group, who had a low frequency atrial
flutter, was misclassified as normal sinus rhythm,
because he had a Mahalanobis distance from the SR
group below the threshold (see table 4).
AN ALGORITHM FOR THE DETECTION OF ATRIAL FIBRILLATION USING THE PULSE OXIMETRIC SIGNAL
431
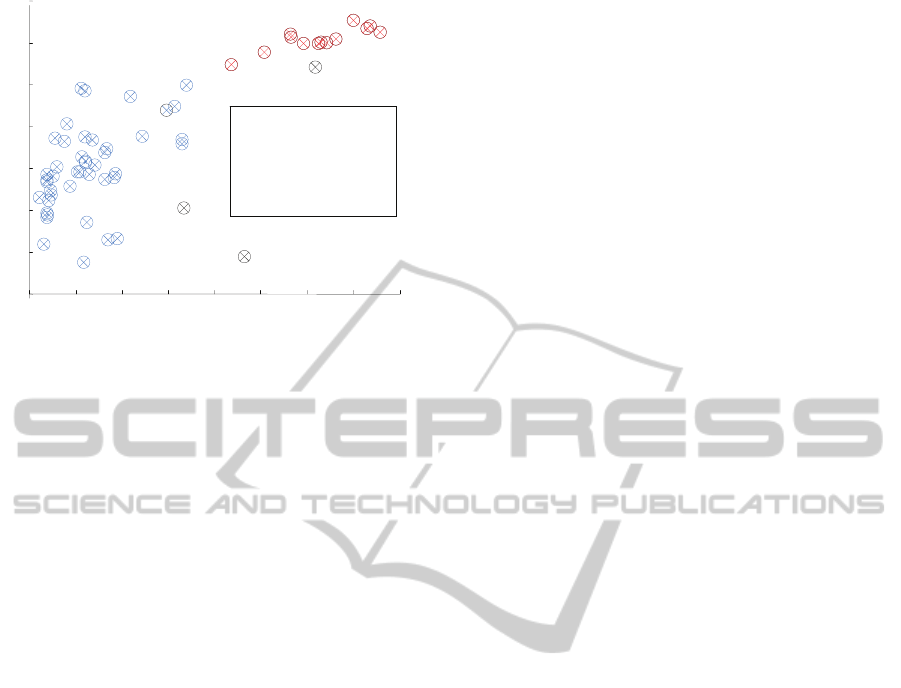
Figure 1: Result of the rhythm classification.
4 CONCLUSIONS
In this work, a AF detection algorithm based on the
pulse oximeter signal is proposed. The algorithm is
based on the measure of the irregularity of the
ventricular rate during AF. The experimental
validation demonstrated both high sensitivity and
high specificity in AF and SR discrimination, so the
algorithm can precisely detect AF episodes from a
pulse oximeter device.
The high sensitivity of the algorithm, the
relatively short data required (5 minutes), and its
implementation on a microcontroller suggest that it
is possible to design an home-care device for the
accurate detection of AF episodes, based on
commercial pulse oximeters.
ACKNOWLEDGEMENTS
This research was funded by the FILAS - Regione
Lazio Grant. Authors wish to thank Engg. Boschetti,
Dieli and Pennacchietti from Medical International
Research, for providing the device for the data
collection and for the assistance in the algorithm
implementation.
REFERENCES
Naccarelli, GV., Varker, H., Lin, J., Schulman, KL., 2009.
Increasing prevalence of atrial fibrillation and flutter
in the United States. Am J Cardiol. Dec
1;104(11):1534-9.
Go, A. S., Hylek, E. M., Phillips, K. A., et al., 2001.
Prevalence of diagnosed atrial fibrillation in adults:
national implications for rhythm management and
stroke prevention: the AnTicoagulation and Risk
Factors in Atrial Fibrillation (ATRIA) Study. JAMA.
May 9;285(18):2370-5.
Kirchhof, P., 2009. Can we improve outcomes in A. F.
patients by early therapy? BMC Med. Nov 26;7:72.
Israel, C. W., 2004. Is there a role for pacing in the
prevention of atrial tachyarrhythmias? Europace.
6(5):380-3.
Rho, R. W., Page, R. L., 2005. Asymptomatic atrial
fibrillation. Prog Cardiovasc Dis.48(2):79-87.
Arya, A., Piorkowski, C., Sommer, P., Kottkamp,
H., Hindricks, G., 2007. Clinical implications of
various follow up strategies after catheter ablation of
atrial fibrillation. Pacing Clin Electrophysiol.
Apr;30(4):458-62.
Tateno, K., Glass, L., 2001. Automatic detection of atrial
fibrillation using the coefficient of variation and
density histograms of RR and delta RR intervals. Med
Biol Eng Comput. Nov;39(6):664-71.
Duverney, D., Gaspoz, J. M., Pichot, V., et al., 2002. High
accuracy of automatic detection of atrial fibrillation
using wavelet transform of heart rate intervals. Pacing
Clin Electrophysiol. 25(4 Pt 1):457-62.
Esperer, H. D., Esperer, C., Cohen, R. J., 2008. Cardiac
Arrhythmias Imprint Specific Signatures on Lorenz
Plots. Annals of Noninvasive Electrocardiology
13(1):44–60.
Hong-Wei, L., Ying, S., Min, L., Pi-Ding, L., Zheng, Z.,
2009. A probability density function method for
detecting atrial fibrillation using R-R intervals. Med
Eng Phys. 31(1):116-23.
Dash, S., Chon, K. H., Lu, S., Raeder, E. A., 2009.
Automatic real time detection of atrial fibrillation. Ann
Biomed Eng. Sep;37(9):1701-9.
Babaeizadeh, S., Gregg, R. E., Helfenbein, E. D.,
Lindauer, J. M., Zhou, S. H., 2009. Improvements in
atrial fibrillation detection for real-time monitoring. J
Electrocardiol. 42(6):522-6.
Park, J., Lee, S., Jeon, M., 2009. Atrial fibrillation
detection by heart rate variability in Poincare plot.
BioMedical Engineering OnLine 8:38.
Lu, S., Zhao, H., Ju, K., et al., 2008. Can
photoplethysmography variability serve as an
alternative approach to obtain heart rate variability
information? J Clin Monit Comput. 22(1):23-9.
Foo, J. Y., Wilson, S. J., 2006. Detection method to
minimize variability in photoplethysmographic signals
for timing-related measurement. J Med Eng Technol.
30(2):93-6.
CV
0.25 0.3 0.350.05 0.1 0.15 0.2 0.40
O = SR
O = AF
O = OTHER
4.0
2.0
1.0
1.5
3.0
3.5
0.5
EN
BIOSIGNALS 2011 - International Conference on Bio-inspired Systems and Signal Processing
432
