
A FRACTAL-BASED ALGORITHM OF EMOTION
RECOGNITION FROM EEG USING
AROUSAL-VALENCE MODEL
Olga Sourina and Yisi Liu
Nanyang Technological University, Nanyang Ave, Singapore
Keywords: EEG, Fractal dimension, SVM, Emotion recognition, Music stimuli.
Abstract: Emotion recognition from EEG could be used in many applications as it allows us to know the “inner”
emotion regardless of the human facial expression, behaviour, or verbal communication. In this paper, we
proposed and described a novel fractal dimension (FD) based emotion recognition algorithm using an
Arousal-Valence emotion model. FD values calculated from the EEG signal recorded from the
corresponding brain lobes are mapped to the 2D emotion model. The proposed algorithm allows us to
recognize emotions that could be defined by arousal and valence levels. Only 3 electrodes are needed for the
emotions recognition. Higuchi and box-counting algorithms were used for the EEG analysis and
comparison. Support Vector Machine classifier was applied for arousal and valence levels recognition. The
proposed method is a subject dependent one. Experiments with music and sound stimuli to induce human
emotions were realized. Sound clips from the International Affective Digitized Sounds (IADS) database
were used in the experiments.
1 INTRODUCTION
Human emotion could be created as a result of the
“inner” thinking referring to the memory or by the
brain stimuli through the human senses (visual,
audio, tactile, odor, taste, etc). Algorithms of the
“inner” emotion recognition from EEG signals could
be used in medical applications, EEG-based games,
or even in a marketing study. There are different
emotion classifications proposed by researchers. We
follow the two-dimensional Arousal-Valence model
(Russell, 1979). The two properties of this model are
defined as follows. The valence level represents a
quality of the emotion, ranging from unpleasant to
pleasant, and the arousal level denotes a quantitative
activation level, from not aroused to excited. This
model allows us the mapping of the discrete emotion
labels into the Arousal-Valence coordinate system.
To evoke emotions, different stimuli could be
used, for example, visual, auditory, or combined
ones. They activate the different areas of the brain.
Our hypothesis is that an emotion has spatio-
temporal location in the brain. There is no easily
available benchmark database of EEG data labelled
with emotions. But there are labelled databases of
audio stimuli for emotion induction such as an
International Affective Digitized Sounds (IADS)
(Bradley and Lang, 2007)
and visual stimuli – an
International Affective Picture System (IAPS) (Lang
et al., 2005). Thus, we proposed and carried out one
experiment on the emotion induction using IADS
database of the labelled audio stimuli. We also
proposed and implemented an experiment with the
music stimuli to induce emotions by playing music
pieces, and a questionnaire was prepared for the
participants to label the recorded EEG data with the
corresponding emotions (Liu et al., 2010).
There are an increasing number of algorithms to
recognize emotions. The algorithms consist from
two prts: feature extraction and classification. In
work (Lin et al., 2009), a short-time Fourier
Transform was used for feature extraction, and
Support Vector Machine approach was employed to
classify the data into different emotion modes.
82.37% accuracy was achieved to distinguish the
feelings of joy, sadness, anger, and pleasure. A
performance rate of 92.3% was obtained by (Bos.,
2006) using a Binary Linear Fisher’s Discriminant
Analysis, and the emotion states such as
positive/arousal, positive/calm, negative/calm and
negative/arousal were differed. By applying lifting
209
Sourina O. and Liu Y..
A FRACTAL-BASED ALGORITHM OF EMOTION RECOGNITION FROM EEG USING AROUSAL-VALENCE MODEL .
DOI: 10.5220/0003151802090214
In Proceedings of the International Conference on Bio-inspired Systems and Signal Processing (BIOSIGNALS-2011), pages 209-214
ISBN: 978-989-8425-35-5
Copyright
c
2011 SCITEPRESS (Science and Technology Publications, Lda.)

based wavelet transforms to extract features and
Fuzzy C-Means clustering to do classification,
sadness, happiness, disgust, and fear emotions were
recognized by (Murugappan et al., 2008). Then, in
(Schaaff, 2008), an optimization such as the
different window sizes, band-pass filters,
normalization approaches and dimensionality
reduction methods were investigated, and it was
achieved an increase in the accuracy from 36.3% to
62.07% by SVM after applying these optimizations.
Three emotion states: pleasant, neutral, and
unpleasant were distinguished. By using the
Relevant Vector Machine, differentiation between
happy and relaxed, relaxed and sad, happy and sad
with performance rate around 90% was obtained in
work (Li et al., 2009).
One of the main objectives of such algorithms is
to improve the accuracy and to recognize more
emotions. As emotion recognition is a new area of
research, a benchmark database of EEG signals
labeled with the corresponding emotions is needed
to be set up, which could be used for further research
on EEG-based emotion recognition. Until now, only
limited number of emotions could be recognized by
available algorithms. More research could be done
to recognize different types of emotions.
Additionally, less electrodes could be used for
emotion recognition.
In this paper, we proposed a novel fractal based
approach that allows us to recognize emotions using
fractal dimension (FD) values of EEG signals
recorded from the corresponding lobes of the brain.
Our approach allows us to recognize emotions such
as negative high aroused, positive high aroused,
negative low aroused, and positive low aroused
using only 3 electrodes with high accuracy. To
classify emotions, we use a Support Vector Machine
(SVM) implementation.
The outline of the paper is as follows. First, we
describe a fractal dimension model and algorithms
that we use for the feature extraction and SVM that
we apply for arousal levels and valence levels
classifications correspondingly. Then, we describe
our experiments on the emotion inductions with
audio stimuli, an algorithm implementation, data
analysis and processing results.
2 RELATED WORK
2.1 Fractal Dimension Model
As an EEG signal is nonlinear and chaotic, fractal
dimension model can be applied in EEG data
analysis (Pradhan and Narayana Dutt, 1993,
Lutzenberger et al., 1992, Kulish et al., 2006a,
Kulish et al., 2006b). For example, to distinguish
between positive and negative emotions,
dimensional complexity could be used (Aftanas et
al., 1998). The concentration level of the subjects
can be detected by the value of fractal dimension
(Wang et al., 2010). Experiments on emotion
induction by music stimuli were proposed, and the
EEG data were analyzed with fractal dimension
based approach (Sourina et al., 2009a; Sourina et al.,
2009b). A real-time emotion recognition algorithm
was developed by using fractal dimension based
algorithm in work (Liu et al., 2010).
In this paper, we used two fractal dimension
algorithms for feature extraction, namely Higuchi
(Higuchi, 1988) and Box-counting (Falconer, 2003)
algorithms as follows.
2.1.1 Higuchi Algorithm
The algorithm calculates fractal dimension value of
time-series data.
(
)
(
)
(
)
1, 2, ,
X
XXN…
is a finite set of time
series samples.
Then, newly constructed time series is defined as
follows:
() ( )
()
:, ,,
1, 2, ,
m
k
Nm
X
Xm Xm k Xm k
k
mk
⎛−⎞
⎡⎤
++⋅
⎜⎟
⎢⎥
⎣⎦
⎝⎠
=
…
…
(1)
where
m
is the initial time and
k
is the interval
time.
For example, if
3k
=
and 50,m = the newly
constructed time series are:
(
)
(
)
(
)()()
(
)
() () ( )
12
33
3
3
:1,4,,49, :2,5,,50,
:3,6,,48.
XX X X XX X X
XX X X
……
…
k sets of
(
)
m
L
k
are calculated as follows:
()
() ()
()
1
1
1
Nm
k
i
m
N
Xm ik Xm i k
Nm
k
k
Lk
k
−
⎡⎤
⎢⎥
⎣⎦
=
⎧
⎫
⎛⎞
⎪
⎪
⎜⎟
−
⎪
⎪
+− +−⋅
⎨
⎬
⎜⎟
−
⎡⎤
⎪
⎪
⎜⎟
⋅
⎢⎥
⎝⎠
⎪
⎪
⎣⎦
⎩⎭
=
∑
(2)
where
(
)
Lk
denotes the average value of
(
)
m
L
k
,
and a relationship exists as follows:
(
)
D
Lk k
−
∝
(3)
BIOSIGNALS 2011 - International Conference on Bio-inspired Systems and Signal Processing
210

Then, the fractal dimension can be obtained by
logarithmic plotting between different
k
and its
associated
(
)
L
k
.
2.1.2 Box-counting Algorithm
Box-counting algorithm is a popular fractal
dimension calculation algorithm because its
mathematical calculation and empirical estimation is
straight forward (Falconer, 2003).
Let
F
be a non-empty bounded subset of Rn.
Then, the box-counting dimension of
F
is
calculated by
()
log
dim
log
B
NF
F
δ
δ
=
−
(4)
where
()
NF
δ
is the number of
δ
-mesh cubes that
can cover
F
.
2.2 Support Vector Machine
The idea of Support Vector Machine (SVM) to bind
the expected risk is to minimize the confidence
interval while leave the empirical risk fixed (Vapnik,
2000). The goal of SVM is to find a hyperplane
(Cristianini and Shawe-Taylor, 2000)
There are different types of kernels. Polynomial
kernel (Petrantonakis and Hadjileontiadis, 2010)
used in our work is defined as
(
)
( z+1)
Td
Kxz x⋅= ⋅
(5)
where
n
,Rxz∈
and
d
denotes the order of the
polynomial kernel.
3 EXPERIMENT
We use EEG data sets labelled with emotions
collected in the experiments on emotions induction
with audio stimuli and described in our previous
work (Liu et al., 2010). Two experiments were
carried out to elicit the emotions: negative high
aroused (fear), positive high aroused (happy),
negative low aroused (sad), and positive low aroused
(pleasant) with different audio stimuli. The first
experiment used music pieces labelled by other
subjects with emotions. The second experiment used
sound clips from the International Affective
Digitized Sounds (IADS) database as stimuli. The
music experiment collected EEG data from 10
subjects, and the IADS experiment collected EEG
data from 12 participants. In the music and IADS
experiments, an Emotiv device with 14 electrodes
locating at AF3, F7, F3, FC5, T7, P7, O1, O2, P8,
T8, FC6, F4, F8, and AF4 were used. The sampling
rate of the device is 128Hz. The bandwidth of
Emotiv is 0.2-45Hz, digital notch filters are at 50Hz
and 60Hz; and A/D converter is with 16 bits
resolution. After the study on the channels choice, 3
channels such as AF3, F4 and FC6 were used for the
recognition tasks.
4 IMPLEMENTATION
4.1 Pre-processing
The collected data is filtered by a 2-42 Hz bandpass
filter since the alpha, theta, beta, delta, and gamma
waves of EEG lie in this band (Sanei and Chambers,
2007).
4.2 Features Extraction
The FD values were used to form the features as
follows. For arousal level recognition, the arousal
feature is described as follows:
6
[]
Arousal FC
FD
Feature FD=
(6)
In previous works (Jones and Fox, 1992, Canli et
al., 1998), it was shown that the left hemisphere was
more active during positive emotions, and the right
hemisphere was more active during negative
emotions. In this paper, we proposed to extract
valence feature based on the FD values computed
from EEG signals recorded from the left and right
hemispheres. Our hypothesis is that the FD values
from different hemispheres could be used in valence
classification. To test our hypothesis, we collect
data from AF3 electrode which is located on left
hemisphere and from F4 electrode which is located
on the right hemisphere. The valence feature is
defined as follows:
34
[,]
Valence AF F
FD
Feature FD FD=
(7)
where
34
,
AF F
F
DFDdenotes the FD values
computed from EEG signal recorded from AF3 and
F4.
Since there are individual difference in emotion
processing by brain (Hamann and Canli, 2004), we
proposed a subject dependent approach. We use a
sliding window with the size of 1024 and 99%
A FRACTAL-BASED ALGORITHM OF EMOTION RECOGNITION FROM EEG USING AROUSAL-VALENCE
MODEL
211

overlapping of the sampled data to calculate fractal
dimension (FD) values with Higuchi and Box-
counting algorithms to set up the training and testing
data for SVM classifier. For example,
6
F
C
F
D contains a set of FD values computed with
the sliding window
66
1n
;;
F
CFC
FD FD… . The total
number
n of FD values depends on the input data
size and the sliding window used.
4.3 Support Vector Machine
Classification
Although we have only one feature for arousal level
recognition and two features for valence level
recognition respectively, the SVM kernel can project
low dimension feature into higher dimension space
to search for the hyperplane (Noble, 2006) which
can differentiate two classes, namely high arousal
and low arousal levels with the arousal feature, and
positive and negative levels with valence features.
The MATLAB R2010a Bioinfo Toolbox was used.
The order of SVM polynomial kernel was set to 5.
For the arousal level recognition, FD values of high
arousal level with negative and positive valence
levels, and low arousal level with negative and
positive valence levels were put together with the
labels. For the valence level recognition, the FD
values
34
,
AF F
F
DFDof positive valence level with
high and low arousal levels, and negative valence
level with high and low arousal levels were put
together with the labels. For both arousal and
valence level recognition, 50% of these data were
randomly selected and fed into the SVM classifier as
training data, and the other 50% were used as testing
data. 50 iterations were executed to get the mean
accuracy
A
.
5 RESULTS AND ANALYSIS
The classification accuracy comparison is shown in
Figure 1 and 2 for arousal level recognition in the
music and IADS experiments correspondingly. In
Figure 3 and 4, the accuracy for valence level
recognition in the music and IADS experiments is
shown. The vertical axis denotes the value of
A
.
The horizontal axis represents different subjects.
Since we ignored the data of experiments when the
target emotion was not induced as expected that was
recorded in the subject’s questioner answer, for
arousal level analysis, data of subjects 1, 2, 3, 4, 5, 6,
7, 9, and 10 from the music experiment, and data of
subjects 1, 2, 3, 4, 5, 6, 9, 10, and 11 from the IADS
experiment were used. For the valence level analysis,
data of subjects 1, 3, 4, 5, 7, 8, 9, and 10 from the
music experiment, and data of subjects 1, 2, 3, 4, 5,
6, 7, 8, 9, and 10 from the IADS experiment were
used. The dash line with the diamonds denotes the
performance of Higuchi algorithm, and the line with
the squares denotes the performance of Box-
counting algorithm. When comparing these two
fractal dimension based algorithms, we can see that
the performance of box-counting and Higuchi is
almost breakeven: Higuchi outperforms box-
counting algorithm for 4 subjects out of 10 in the
arousal level recognition for both IADS and music
experiments, 5 out of 8 subjects in the valence level
recognition for the music experiment, and 7 out of
10 subjects in the valence recognition for IADS
experiment.
Figure 1: Comparison of arousal levels recognition
accuracy for the music experiment.
In our algorithm, we used only 3 electrodes to
recognize emotions, and by combining the two
dimension arousal and valence, we can get the
recognition of emotions that can be mapped to the
2D Arousal-Valence model. Compared with peer
work, for example, positive and negative valence
levels were recognized and the accuracy of 73.00%
was obtained in (Zhang and Lee, 2009). Our work
identified not only the valence but also the arousal
levels and has got a higher accuracy (the maximum
accuracy 100% for one particular subject).
In another work (Chanel et al., 2006), 64 channels
were used. Different EEG frequency bands
associated with different electrodes locations were
used for features extraction and two classifiers:
BIOSIGNALS 2011 - International Conference on Bio-inspired Systems and Signal Processing
212
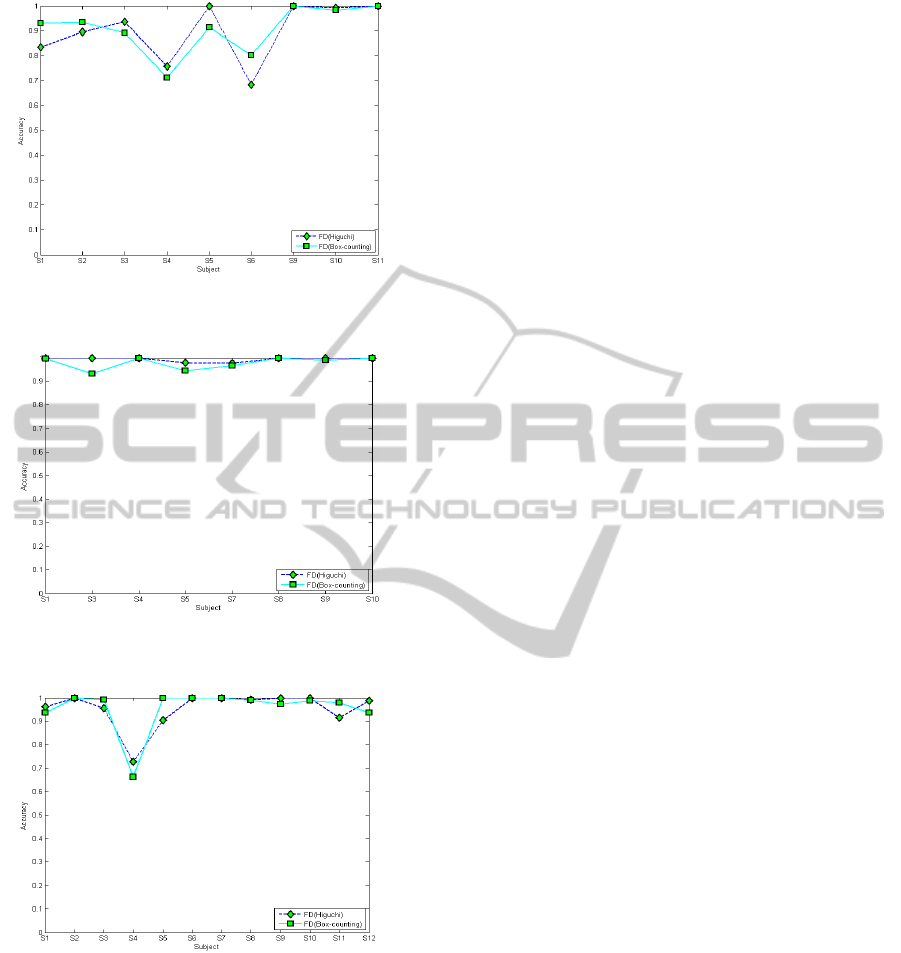
Figure 2: Comparison of arousal levels recognition
accuracy for the IADS experiment.
Figure 3: Comparison of valence levels recognition
accuracy for the music experiment.
Figure 4: Comparison of valence levels recognition
accuracy for the IADS experiment.
Bayes and Fisher Discriminant Analysis were
compared. Finally, the best accuracy result of 58%
was achieved to distinguish three arousal levels
using four subjects’ data. Our algorithm outperforms
the above algorithm by using less electrodes and
having better accuracy.
6 CONCLUSIONS
In this paper, we proposed a novel fractal based
approach for emotion recognition from EEG using
2D Arousal-Valence model. Fractal dimension
features for arousal and valence levels recognition
were extracted from the EEG data sets labelled with
emotions for each subject. Based on the features,
arousal and valence levels were classified
correspondingly. Higuchi and box-counting
algorithms with sliding window were implemented
for FD values calculations, and the accuracy of the
arousal an valence levels recognition was compared
for both algorithms. The proposed method allows us
to recognize emotions combined from negative high
aroused, positive high aroused, negative low aroused,
and positive low aroused states using only 3
electrodes with high accuracy. This study is a part of
the project EmoDEx described in
http://www3.ntu.edu.sg/home/eosourina/CHCILab/p
rojects.html
ACKNOWLEDGEMENTS
This project is supported by grant NRF2008IDM-
IDM004-020 “Emotion-based personalized digital
media experience in Co-Spaces” of National
Research Fund of Singapore.
REFERENCES
Aftanas, L. I., Lotova, N. V., Koshkarov, V. I. & Popov,
S. A. 1998. Non-linear dynamical coupling between
different brain areas during evoked emotions: An EEG
investigation. Biological Psychology, 48, 121-138.
Bradley, M. M. & Lang, P. J. 2007. The International
Affective Digitized Sounds (2nd Edition; IADS-2):
Affective ratings of sounds and instruction manual.
Gainesville: University of Florida.
Bos., D. O. 2006. EEG-based Emotion Recognition
[Online]. Available:
http://hmi.ewi.utwente.nl/verslagen/capita-selecta/CS-
Oude_Bos-Danny.pdf.
Canli, T., Desmond, J. E., Zhao, Z., Glover, G. & Gabrieli,
J. D. E. 1998. Hemispheric asymmetry for emotional
stimuli detected with fMRI. NeuroReport, 9, 3233-
3239.
Chanel, G., Kronegg, J., Grandjean, D. & Pun, T. 2006.
Emotion assessment: Arousal evaluation using EEG's
and peripheral physiological signals
Cristianini, N. & Shawe-Taylor, J. 2000. An introduction
to Support Vector Machines : and other kernel-based
learning methods, New York, Cambridge University
Press.
A FRACTAL-BASED ALGORITHM OF EMOTION RECOGNITION FROM EEG USING AROUSAL-VALENCE
MODEL
213

Falconer, K. J. 2003. Fractal geometry : mathematical
foundations and applications, Chichester, England,
Wiley.
Hamann, S. & Canli, T. 2004. Individual differences in
emotion processing. Current Opinion in Neurobiology,
14, 233-238.
Higuchi, T. 1988. Approach to an irregular time series on
the basis of the fractal theory. Physica D: Nonlinear
Phenomena, 31, 277-283.
Jones, N. A. & Fox, N. A. 1992. Electroencephalogram
asymmetry during emotionally evocative films and its
relation to positive and negative affectivity. Brain and
Cognition, 20, 280-299.
Kulish, V., Sourin, A. & Sourina, O. 2006a. Analysis and
visualization of human electroencephalograms seen as
fractal time series. Journal of Mechanics in Medicine
and Biology, World Scientific, 26(2), 175-188.
Kulish, V., Sourin, A. & Sourina, O. 2006b. Human
electroencephalograms seen as fractal time series:
Mathematical analysis and visualization. Computers in
Biology and Medicine, 36, 291-302.
Lang, P. J., Bradley M. M. & Cuthbert, B. N. 2005.
International affective picture system (IAPS): digitized
photographs, instruction manual and affective ratings.
University of Florida.
Li, M., Chai, Q., Kaixiang, T., Wahab, A. & Abut, H.
2009. EEG Emotion Recognition System.
Lin, Y. P., Wang, C. H., Wu, T. L., Jeng, S. K. & Chen, J.
H. Year. EEG-based emotion recognition in music
listening: A comparison of schemes for multiclass
support vector machine. In: ICASSP, IEEE
International Conference on Acoustics, Speech and
Signal Processing - Proceedings, 2009 Taipei. 489-
492.
Liu, Y., Sourina, O. & Nguyen, M. K. Year. Real-time
EEG-based Human Emotion Recognition and
Visualization In: Proc. 2010 Int. Conf. on
Cyberworlds, 20-22 Oct, 2010 2010 Singapore. 262-
269.
Lutzenberger, W., Elbert, T., Birbaumer, N., Ray, W. J. &
Schupp, H. 1992. The scalp distribution of the fractal
dimension of the EEG and its variation with mental
tasks. Brain Topography, 5, 27-34.
Murugappan, M., Rizon, M., Nagarajan, R., Yaacob, S.,
Zunaidi, I. & Hazry, D. Year. Lifting scheme for
human emotion recognition using EEG. In, 2008.
Noble, W. S. 2006. What is a support vector machine? Nat
Biotech, 24, 1565-1567.
Petrantonakis, P. C. & Hadjileontiadis, L. J. 2010.
Emotion recognition from EEG using higher order
crossings. IEEE Transactions on Information
Technology in Biomedicine, 14, 186-197.
Pradhan, N. & Narayana Dutt, D. 1993. Use of running
fractal dimension for the analysis of changing patterns
in electroencephalograms. Computers in Biology and
Medicine, 23, 381-388.
Russell, J. A. 1979. Affective space is bipolar. Journal of
Personality and Social Psychology, 37, 345-356.
Schaaff, K. 2008. EEG-based Emotion Recognition.
Universitat Karlsruhe (TH).
Sanei, S. & Chambers, J. 2007. EEG signal processing,
Chichester, England ; Hoboken, NJ, John Wiley &
Sons.
Sourina, O., Kulish, V. V. & Sourin, A. 2009a. Novel
Tools for Quantification of Brain Responses to Music
Stimuli.
Sourina, O., Sourin, A. & Kulish, V. 2009b. EEG data
driven animation and its application. Rocquencourt.
Vapnik, V. N. 2000. The nature of statistical learning
theory, New York, Springer.
Wang, Q., Sourina, O. & Nguyen, M. K. Year. EEG-based
"Serious" Games Design for Medical Applications. In:
Proc. 2010 Int. Conf. on Cyberworlds, 2010
Singapore. 270-276.
Zhang, Q. & Lee, M. 2009. Analysis of positive and
negative emotions in natural scene using brain activity
and GIST. Neurocomputing, 72, 1302-1306.
BIOSIGNALS 2011 - International Conference on Bio-inspired Systems and Signal Processing
214
