
INSTRUMENTATION FOR MINIMALLY INVASIVE
MEASUREMENT OF VESICAL PRESSURE IN MEN
João Carlos Martins de Almeida
School of Electrical and Computer Engineering, University of Campinas, Campinas, Brazil
Center for Biomedical Engineering, University of Campinas, Campinas, Brazil
Rodrigo Horikawa Watanabe
School of Electrical and Computer Engineering, University of Campinas, Campinas, Brazil
David Jacques Cohen, Carlos Arturo Levi D′Ancona
Division of Urology of School of Medical Sciences, University of Campinas, Campinas, SP, Brazil
José Wilson Magalhães Bassani
School of Electrical and Computer Engineering, University of Campinas, Campinas, Brazil
Center for Biomedical Engineering, University of Campinas, Campinas, Brazil
Keywords: Urodynamics, Prostate, Vesical pressure, Instrumentation.
Abstract: Urodynamic assessment is important to evaluate bladder outlet obstruction (BOO), but the procedure is
invasive, expensive and time-consuming, and is not free of complications (e. g. macroscopic hematuria,
fever). In a previous work, we reported a new method developed for measuring vesical static pressure
during urodynamic exams by using a device named urethral connector (UC). Clinical tests indicated that the
new method is comparable to the conventional standard procedure with clear advantages. In this work, we
describe improvements made on the UC, which confer greater autonomy and portability to the whole
measurement system. We also report the results of clinical tests.
1 INTRODUCTION
Lower urinary tract symptoms (LUTS) are very
common in elderly patients (Gomes et al., 2004).
Many of these symptoms are related to bladder
outlet obstruction (BOO) due to benign prostatic
hyperplasia (BPH), which afflicts approximately
50% of men above 60 years-old (Power &
Fitzpatrick, 2004). About 35% of the patients
undergoing prostate surgery due to LUTS will not
benefit from it because they do not have obstruction.
Urodynamic assessment is the gold standard
procedure (GSM) for detecting BOO; however, the
procedure is invasive, expensive and time-
consuming (Gomes et al., 2004).
Along the years, other methods have been
proposed for minimally invasive urodynamic
assessment (Pel & van Mastrigt, 1999; Griffiths et
al., 2002; Parsons et al., 2009), each of them with
advantages and disadvantages. As previously
reported (D’Ancona et al., 2008), we have
developed a new method (MUC, Method of the
Urethral Conector) for minimally invasive
measurement of the static bladder pressure. This
variable, as well as void flow, have been used to
categorize patients as non-obstructed, equivocal or
obstructed (van Mastrigt et al., 2009; Clarkson et al.,
2008; Harding et al., 2009). We have developed a
relatively simple device named urethral connector
(UC), which was tested clinically, and proved to be
easy to use, while allowing detection of BOO in men
189
Martins de Almeida J., Horikawa Watanabe R., Jacques Cohen D., Levi D’Ancona C. and Magalhães Bassani J..
INSTRUMENTATION FOR MINIMALLY INVASIVE MEASUREMENT OF VESICAL PRESSURE IN MEN.
DOI: 10.5220/0003152601890193
In Proceedings of the International Conference on Biomedical Electronics and Devices (BIODEVICES-2011), pages 189-193
ISBN: 978-989-8425-37-9
Copyright
c
2011 SCITEPRESS (Science and Technology Publications, Lda.)
(D’Ancona et al., 2008).
Here we describe improvements made on the
UC, as to confer autonomy and portability to the
device and measurement system, and report clinical
tests.
2 METHODOLOGY
2.1 Instrumentation
The UC is a device made of polyvinyl carbon and
polytetrafluoroethylene, with a conic inlet tube (A in
Figure 1) designed to fit the urethral meatus and
fossa navicularis, as to avoid leakage during voiding
through the device. In the present device a built-in
pressure transducer (B in Figure 1, MPX2300DT1,
30 μV/mmHg, Freescale Semiconductor, Austin,
TX, USA) was included for measurement of the
urine edge pressure on the outflow line. The output
signal of the transducer was amplified (custom-made
amplifier with variable gain and offset) and fed to a
computer via NI USB-6215 interface (National
Instruments, Austin, TX, USA). A Labview
TM
program was used for data acquisition and
processing.
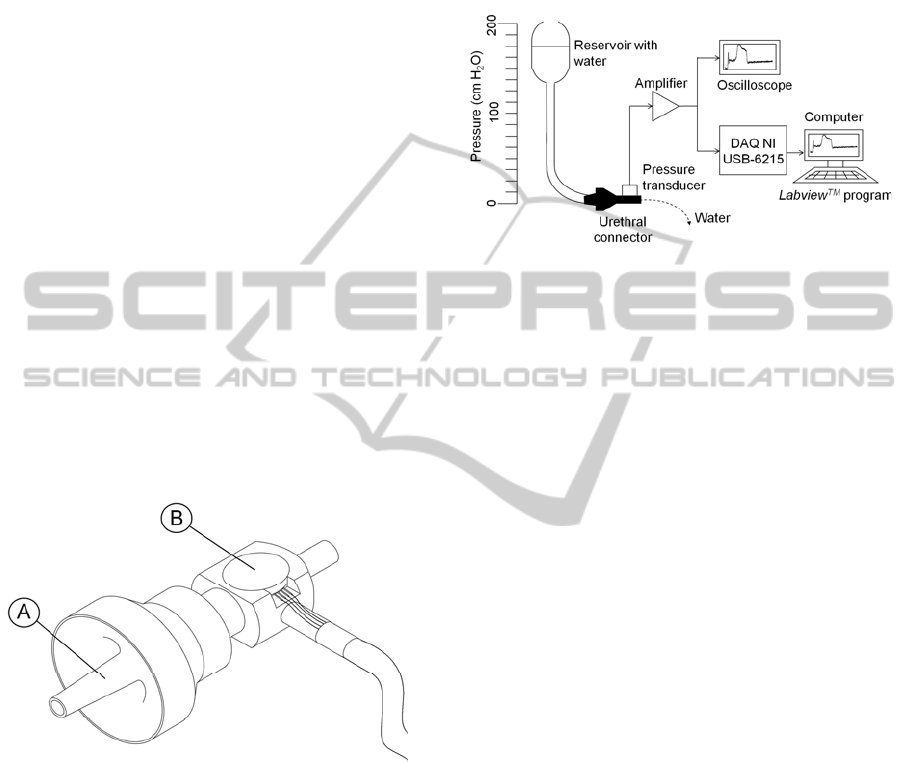
Figure 1: Urethral connector. (A), conic tube designed to
fit the urethral meatus and fossa navicularis. (B) contains a
pressure transducer for measuring vesical pressure.
For the transducer calibration, the amplifier
offset and gain were adjusted so that when no
pressure was applied to the transducer, the output
voltage is zero, and application of 200 cmH
2
O
results in an output of 5 V. Transducer calibration
was performed with a pneumatic transducer tester
(DPM-IB, Bio-Tek Instruments, Winooski) in the
range of 0 to 200 cmH
2
O. This pressure range has
been adopted by other investigators to test their
minimally invasive methods (Griffiths et al., 2002).
Dynamic tests of the UC were performed using a
setup in which pressure gradient was generated by
gravity, and the reference pressure values were
obtained by manometry (Figure 2). These data were
useful for determining part of the UC clinical
procedure, as discussed further.
Figure 2: Setup used for bench-tests with the urethral
connector. In dynamic tests, the UC was occluded so that
the steady-state static pressure could be measured.
2.2 Clinical Tests
All the procedures were approved by the Committee
for Ethics in Clinical Research of the University of
Campinas (Protocol #1017/2008). The new system
was tested successfully in 6 patients (66 ± 2 years
old) with complaints of LUTS, after signature of a
consent form. Patients underwent both the
conventional and the minimally invasive (using the
UC) urodynamic tests. Prior to the conventional
urodynamic test, free flow uroflowmetry was also
performed. Urine flow parameters, such as flow
duration, time to reach maximum rate, maximum
and average flow, and released urine volume were
measured using a commercially available equipment
(Urolite, Dynamed, São Paulo) in all patients during
free uroflowmetry, GSM and MUC. For comparison
between methods, we selected the parameters flow
duration, maximum flow rate and urine volume.
The conventional urodynamic exam was
performed using 6F and 8F urethral catheters, for
measurement of vesical pressure and infusion of
saline solution (37°C; 50 ml/min), respectively. The
abdominal pressure was measured using a 6F rectal
catheter. After reaching the maximal cystometric
capacity and just before miction, the 8F catheter was
removed, and the patient was oriented to empty his
bladder. Urine flow, as well as vesical and
abdominal pressures, were recorded with the Urolite
equipment (Dynamed, São Paulo). Then saline
solution was infused again until the maximal
cystometric capacity was reached, and both urethral
catheters were removed. The patient was instructed
to introduce a previously sterilized UC (standard
BIODEVICES 2011 - International Conference on Biomedical Electronics and Devices
190
ethylene oxide sterilization) into the urethra and to
urinate through it. During miction, the UC outlet
was manually occluded by the patient for a short
period, allowing pressure recording by the
developed system. Two alternatives were used:
either the patient closed the UC outlet with his
gloved finger, or a small flexible tube was connected
to the output, allowing the patient to pinch it to
produce a brief occlusion. For both methods (i.e.,
GSM and MUC), the patient was instructed to avoid
straining. After the procedure, the patients answered
a brief questionary about the exam. Data obtained
from clinical tests were computed using the software
Prism (Graphpad Software, San Diego, CA, USA).
3 RESULTS
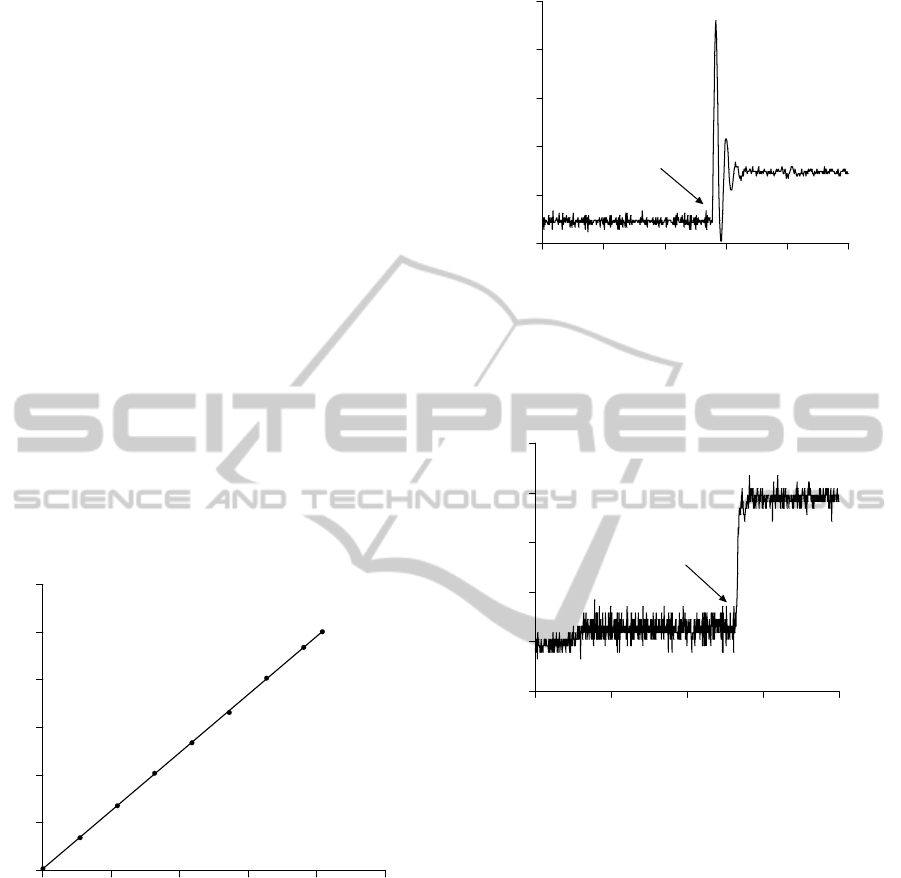
Figure 3 shows the transducer calibration curve.
Voltage output values (y-axis) were measured (10
replicates) for 9 different pressure levels (x-axis).
Data were fit by linear regression (a = 0.024; b =
0.032; R
2
= 0.999; values are expressed as mean ±
standard error.
0 50 100 150 200 250
0
1
2
3
4
5
6
Pressure applied (cmH
2
O)
Amplifier output voltage (V)
Figure 3: Calibration curve of the transducer. Applying 9
different pressure levels (x-axis) on the transducer, the
output voltage (y-axis) of the circuit was measured. Data
are means ± SEM (N= 10). SEM values are 0.005-0.012
V, and thus not apparent in the figure.
Some dynamic tests were performed aiming at
simulating aspects of the clinical procedure using the
UC. The device was occluded in the following ways:
instantaneously, as by an on-off solenoid valve, and
gradually. The signals recorded are shown in Figures
4 and 5, respectively.
5 6 7 8 9 10
0
25
50
75
100
125
Occlusion
Time
(
s
)
Pressure (cmH
2
O)
Figure 4: Simulation of aspects of the clinical procedure
with instantaneous occlusion of the UC during continuous
flow and constant pressure. The time to reach the
maximum pressure was lower than 100ms. The initial
abrupt pressure change is the hydraulic shock.
0.0 2.5 5.0 7.5 10.0
0
10
20
30
40
50
Occlusion
Time
(
s
)
Pressure (cmH
2
O)
Figure 5: Simulation of a clinical procedure with gradual
occlusion of the UC during continuous flow and constant
pressure. The steady-state static pressure is not
significantly different from that obtained as in Figure 4.
Pressure rise time was about 300 ms.
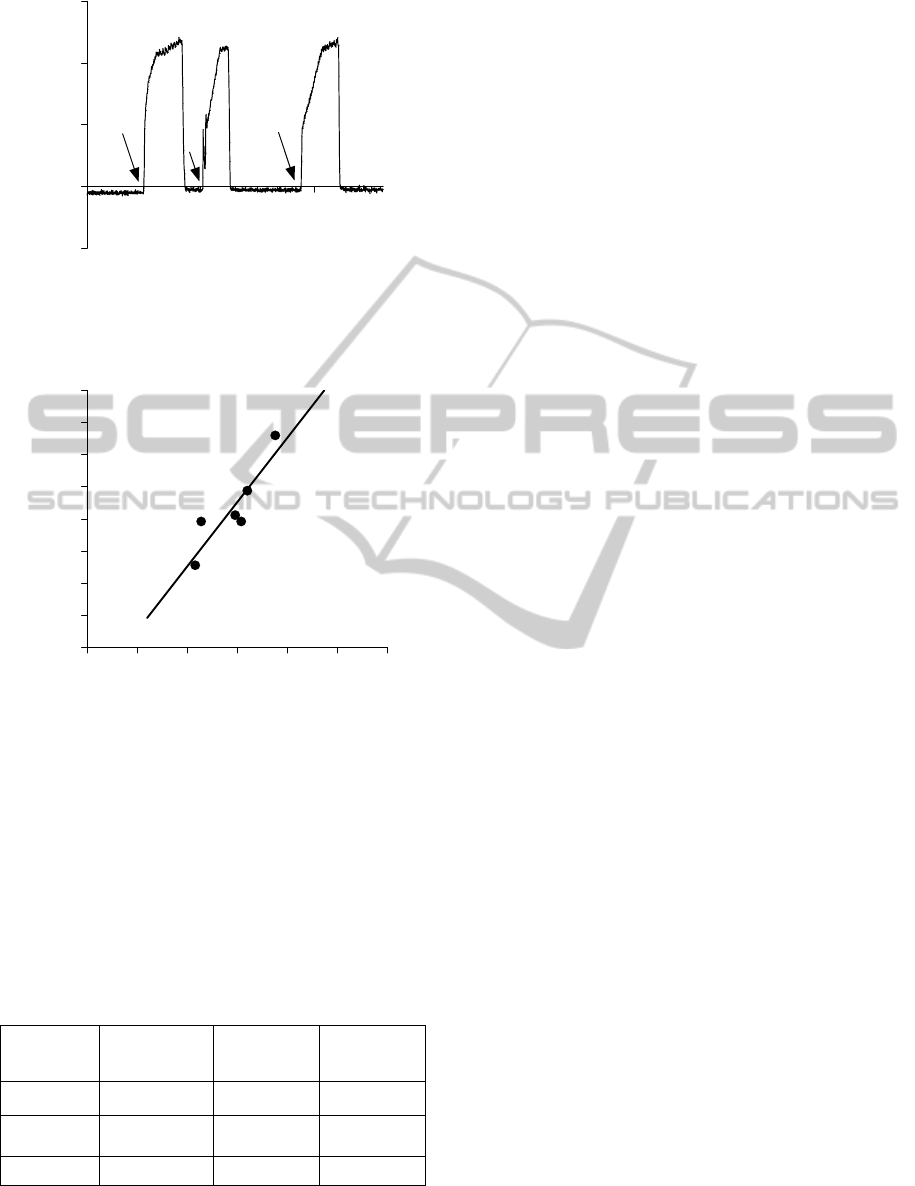
Figure 6 illustrates the pressure recorded during
a clinical procedure using the UC. The approximate
moment of the UC occlusions is indicated by an
arrow.
With the UC method, the maximum steady-state
pressure value during an occlusion is considered as
the value that best reflects the bladder contraction
capability. In the conventional method, this pressure
value is best measured at the maximal flow rate. The
comparison of vesical pressure values recorded with
both methods is shown in Figure 7. There was
significant correlation between the measurements
obtained with the two methods (Pearson r = 0.89; R
2
= 0.802; P < 0.015; a = 2.00 ± 0.49, b = -37.00 ±
36.78), although absolute values could differ as
much as 30%.
INSTRUMENTATION FOR MINIMALLY INVASIVE MEASUREMENT OF VESICAL PRESSURE IN MEN
191
17.5 20.0 22.5 25.0 27.5
-50
0
50
100
150
Time (s)
Pressure (cmH
2
O)
Figure 6: Pressure recorded during a clinical procedure
using the UC. Arrows indicate the approximate moments
of the UC occlusion. The steady-state static pressure after
occlusion was ~122 cmH2O in this case.
0 25 50 75 100 125 150
0
25
50
75
100
125
150
175
200
Vesical Pressure GSM (cmH
2
O)
Vesical Pressure MUC (cmH
2
O)
Figure 7: Regression line representing comparison of
pooled data obtained from six patients using GSM and
MUC.
Table 1 summarizes data obtained from
uroflowmetry. Statistical differences between the
two methods were not observed for flow duration,
maximum flow rate and urine volume (P > 0.05;
Student´s t test; Table 1).
Table 1: Uroflowmetry data (values are expressed as mean
± standard error, N = 6). The last line shows the P values
obtained from the t test for comparison of the two
methods.
Procedure
Flow duration
(s)
Maximum
flow rate
(ml/s)
Urine
volume (ml)
GSM 67.5 ± 12.9 6.7 ± 1.2 194.2 ± 39.3
MUC 72.9 ± 9.1 8.5 ± 1.5 199.5 ± 43.8
P 0.400 0.442 0.844
4 DISCUSSION
The results from the bench tests have shown that the
amplifier output is linear and reproducible (r
2
=
0.999). Dynamic bench tests showed that it is
possible to implement gradual occlusion of the UC
(Figure 5) and that this seems to be the best
approach for measuring the steady-state static
pressure without causing hydraulic shock (see
Figure 4), which results from abrupt flow
interruption and may cause discomfort to the patient
and/or damage to his urinary system.
As shown in Figure 6, in a typical clinical test
using the UC, as the outflow is interrupted, pressure
rises quickly to a steady-state value. This patient
shows a clearly elevated bladder pressure that
indicates there is some kind of disturbance in low
urinary tract. In elderly patients, this disturbance is
likely to be due to prostate enlargement. In this case,
the patient was diagnosed as obstructed, according
to the conventional method.
The steady-state static pressure recorded by
using the UC is not expected to be identical to the
pressure measured at the maximum flow as in GSM.
However, a positive correlation between these
pressures was observed (Figure 7), which indicates
that MUC is also sensitive at detecting alterations of
vesical pressure. Nevertheless, control reference
pressure values recorded with the UC in healthy
patients are still to be determined.
Flow is also a parameter used for diagnosis of
infravesical obstruction. The absence of significant
differences in the flow values measured with GSM
and MUC is an indication that the UC seems not to
impose a significant additional resistance to urine
flow. It should be observed that both methods were
applied at the same maximum cystometric capacity.
Other non-invasive methods for measuring
bladder pressure are currently available (Pel & van
Mastrigt, 1999; Griffiths et al., 2002). We believe
that the present solution, allows more comfort to the
patient during examination, as patients reported no
pain or discomfort during clinical tests.
Nevertheless, MUC showed to be at least as
sensitive as GSM in the detection of alterations of
vesical pressure. Further studies in equivocal and
healthy subjects are being planned so that control
reference values for vesical pressure may be
determined.
5 CONCLUSIONS
The developed device and measuring system is
BIODEVICES 2011 - International Conference on Biomedical Electronics and Devices
192

portable, reliable and robust, allowing measurement
of the static bladder pressure during voiding. The
clinical results indicate that the MUC may be a
promising minimally invasive alternative for clinical
evaluation of vesical pressure.
REFERENCES
Clarkson, B., Robson, W., Griffiths, C., McArdle, F.,
Drinnan, M., Pickard, R. 2008. Multisite evaluation of
noninvasive bladder pressure flow recording using the
penile cuff device: assessment of test-retest agreement.
The Journal of Urology. 180: 2515-2521.
D’Ancona, C. A. L., Bassani, J. W. M., Querne, F. A. O.,
Carvalho, J., Oliveira, R. R. M., Netto Junior, N. R.
2008. New method for minimally invasive urodynamic
assessment in men with lower urinary tract symptoms.
Urology. 71: 75-78.
Gomes, C. M., Arap, S., Trigo-Rocha, F. E. 2004. Voiding
dysfunction and urodynamic abnormalities in elderly
patients. Revista do Hospital das Clínicas da
Faculdade de Ciências Médicas da Universidade de
São Paulo. 59: 206-215.
Griffiths, C. J., Rix, D., MacDonald, A. M., Drinnan, M.
J., Pickard, R. S., Ramsden, P. D. 2002. Noninvasive
measurement of bladder pressure by controlled
inflation of a penile cuff. The Journal of Urology. 167:
1344-1347.
Harding, C., Robson, W., Drinnan, M., McIntosh, S.,
Sajeel, M., Griffiths, C., Pickard, R. 2009. The penile
cuff test: A clinically useful non-invasive urodynamic
investigation to diagnose men with lower urinary tract
symptoms. Indian Journal of Urology. 25: 116-121.
Parsons, B. A., Bright, E., Shaban, A. M., Whitehouse, A.,
Drake, M. J. 2009. The role of invasive and non-
invasive urodynamics in male voiding lower urinary
tract symptoms. World Journal of Urology.
Pel, J. J. M., van Mastrigt, R. 1999. Non-invasive
measurement of bladder pressure using an external
catheter. Neurourology and Urodynamics. 18: 455-
475.
Power, R. E., Fitzpatrick, J. M. Medical treatment of BPH:
an update on results. 2004. European Urology Update
series. 2: 6-14.
van Mastrigt, R., Pel, J. J. M., Huang Foen Chung, J. W.
N. C., de Zeeuw, S. 2009. Development and
application of the condom catheter method for non-
invasive measurement of bladder pressure. Indian
Journal of Urology. 25: 99-104.
INSTRUMENTATION FOR MINIMALLY INVASIVE MEASUREMENT OF VESICAL PRESSURE IN MEN
193
