
MINING QUANTITATIVE ASSOCIATION RULES IN MICROARRAY
DATA USING EVOLUTIVE ALGORITHMS
M. Mart´ınez-Ballesteros, C. Rubio-Escudero, J. C. Riquelme
Department of Computer Science, University of Seville, Seville, Spain
F. Mart´ınez-
´
Alvarez
Department of Computer Science, Pablo de Olavide University of Seville, Seville, Spain
Keywords:
Data mining, Evolutionary algorithms, Quantitative association rules, MicroArray.
Abstract:
The microarray technique is able to monitor the change in concentration of RNA in thousands of genes si-
multaneously. The interest in this technique has grown exponentially in recent years and the difficulties in
analyzing data from such experiments, which are characterized by the high number of genes to be analyzed
in relation to the low number of experiments or samples available. In this paper we show the result of apply-
ing a data mining method based on quantitative association rules for microarray data. These rules work with
intervals on the attributes, without discretizing the data before. The rules are generated by an evolutionary
algorithm.
1 INTRODUCTION
The use of massive processing techniques has revolu-
tionized the biotechnology research and it has highly
increased the amount of data obtained(Durbin et al.,
1998). In particular, microarray technology has revo-
lutionized the biological research due to its ability to
monitor changes in RNA concentration in thousands
of genes simultaneously (Durbin et al., 1998). Re-
search in molecular biology has traditionally focused
on the study gene to gene, but nowadays we are in
the genomic era and genes are studied in thousands or
even whole genomes. Besides the genes, it is neces-
sary to know the relationships between them.
In this context we present the result of applying a
data mining technique, specifically, association rules,
to gene expression data from experiments using mi-
croarray technology. The aim of this process of min-
ing association rules is to discover the presence of
pairs (attribute - value), which appear in a dataset
with a certain frequency. This technique is applied to
discover associations between genes from microarray
datasets, in which gene expression is linked to another
gene expression, Gen1 ⇒ Gen2.
There are many efficient algorithms to find these
rules, most focused on discrete data. However in the
real world, particularly in the problem to deal in this
paper, datasets consists of continuous attributes. In
addition, the tools that work in continuous domains
just discretize the attributes using a specific strategy
and treat these attributes as if they were discrete (Van-
nucci and Colla, 2004). In this paper, the result of
applying a genetic algorithm (GA) is presented. The
algorithm can find association rules in databases with
continuous attributes from microarray data, avoiding
the discretization as a step in the process. The results
will show that the rules obtained have been able to
successfully characterize the data underlying and also
to group relevant genes for the problem studied.
The rest of the paper is divided as follows. Sec-
tion 2 provides the methodology used in this work.
The results obtained by the algorithm developed are
discussed in Section 3. Finally, Section 4 describes
the achieved conclusions.
2 METHODOLOGY
2.1 Search of Rules
This work is focused on a continuous domain. It is
necessary to group the sets of values in intervals to be
able to express the membership of the values to each
574
Martinez Ballesteros M., Rubio Escudero C., C. Riquelme J. and Martíınez-Álvarez F..
MINING QUANTITATIVE ASSOCIATION RULES IN MICROARRAY DATA USING EVOLUTIVE ALGORITHMS.
DOI: 10.5220/0003152705740577
In Proceedings of the 3rd International Conference on Agents and Artificial Intelligence (ICAART-2011), pages 574-577
ISBN: 978-989-8425-40-9
Copyright
c
2011 SCITEPRESS (Science and Technology Publications, Lda.)
group. Ranges have not been fixed for intervals. The
Genetic Algorithm finds and adjust the most appro-
priate intervals to find quantitative association rules.
Each individual in the population is a rule. The set
of rules comprising the population undergo an evolu-
tionary process in which mutation and crossover op-
erators will be applied. The individual with the best
fitness at the end of the process represents the best
rule. The user can drive the search process because
the fitness function has been provided with a set of
parameters. Our proposal performs an IRL process
(Iterative Rule Learning) (Venturini, 1993) to penal-
ize instances already covered by rules in order to em-
phasize the covering of instances still not covered.
In the following sections we provide details of the
general scheme of the algorithm, the fitness function,
representation of individuals and genetic operators.
2.2 Scheme of the Algorithm
First, the rules population is initialized and evaluated.
All rules are evaluated according to equation 1. Thus,
in each iteration the selection operator is applied to se-
lect the best rules on the basis of the fitness function.
Then, the crossover operator is applied to the selected
rules while the population size is not completed. In-
dividuals are randomly selected according to p
m
ut in
order to apply the mutation operator. Finally, the new
population is again evaluated by the fitness function
and the evolutive process restarts. Note that the pro-
cess will be repeated as many times as the maximum
number of preset generations indicates.
2.3 Individuals Codification
The lower and upper limits of the intervals of each
attribute will be represented by the different genes of
an individual. Because the attributes are continuous,
individuals are represented by an real coding. An in-
dividual consists of a not fixed number of attributes
less than n, which represents the number of attribute
in the database.
The representation of an individual consists in two
data structures as shown in Figure 1. The upper struc-
ture includes all the attributes of the database, where
i
j
is the lower limit of the range and s
j
is the upper
limit. The bottom structure indicates the membership
of an attribute to the rule represented by a individual.
The type of each attribute t
j
, can have three values: 0
when the attribute does not belong to the rule, 1 if it
belongs to the antecedent of the rule and 2 when it be-
longs to the consequent part. If an attribute is wanted
to be retrieved for a specific rule, it can be done by
modifying the value equal to 0 of the type by a value
equal to 1 o or 2 depending on the antecedent or con-
sequent.
Figure 1: Representation of an individual of the population.
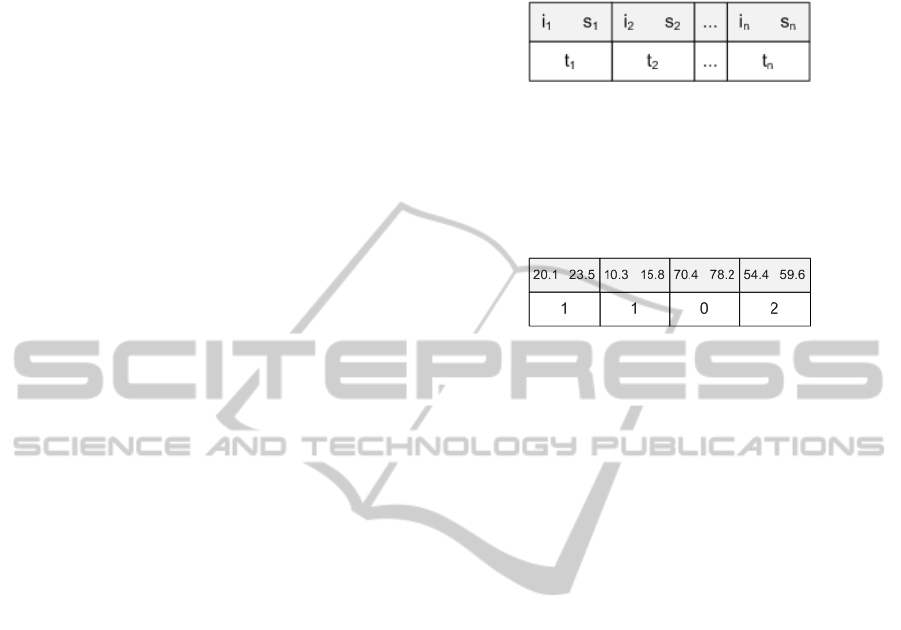
An example of one individual of the population is
shown in Figure 2.
A
1
∈ [20.1, 23.5] and A
2
∈ [10.3, 15.8] =⇒ A
4
∈
[54.4, 59.6].
Figure 2: Example of an individual of the population.
2.4 Initial Population
The number of attributes for each individual is ran-
domly chosen to generate the initial population tak-
ing into account the desired format for the rules. In
addition, the minimum and maximum numbers in the
antecedents and consequents, the minimum and max-
imum number of attributes that belong to rule repre-
sented by an individual are controlled.
2.5 Genetic Operators
The genetic operators implemented in the propose ge-
netic algorithm are: Selection, Crossover and Muta-
tion.
• Selection. An elitist strategy replicating the indi-
vidual with best fitness and a roulette selection-
based method for the remaining individuals ac-
cording to their fitness are used .
• Crossover. Two parents are chosen by the roulette
selection-based method and they are combined to
generate a new individual. The type of all the rel-
evant attributes in both parents are analyzed.
If both parents have an equal type for the same
attribute, it will assigned to offspring. The interval
is obtained as a random value between the limits
of the intervals of both parents.
Nevertheless, if both parents have a different type
for the same attribute, one of the two parents is
randomly chosen and offspring have the intervals
and type attribute of the selected parent.
• Mutation. Individuals of the population are ran-
domly selected in order to apply the mutation de-
MINING QUANTITATIVE ASSOCIATION RULES IN MICROARRAY DATA USING EVOLUTIVE ALGORITHMS
575

pending on a mutation probability p
Mut
. The mu-
tation process consists in modifying individuals
genes, according to a probability p
MutGen
in the
individuals selected. The mutation can be focused
on the attribute type or on the intervals, in which
are possible three separate cases: mutation of the
upper limit, lower limit or both limits of the inter-
val.
For this aim, a random value between 0 and 10%
of the total domain in the attribute is generated
and it is added or subtracted to the limit of the
interval randomly selected.
2.6 Fitness Function
The fitness function calculation involves several mea-
sures that give us information about the rules. In par-
ticular, the most representative are the support and
confidence that will positively affect the rule. How-
ever, it is necessary to take into account a number of
factors with negative affect in the quality of the rule.
In the amplitude of the intervals, the algorithm may
try to extend the intervals to complete the domain of
each attribute. For this aim, it is necessary to include
a measure limiting growth of the intervals during the
evolutive process.
The evaluation function f should be maximized in
the evolutionary process is given by the equation . It
consists in several parameters which values are cal-
culated from the individual multiplied by a weight to
calibrate the effect of each parameter in the overall
evaluation.
f(i) = w
s
· sup+ w
c
· conf − w
r
· recov (1)
+w
n
· nAttrib − w
a
· ampl
where sup is the support, conf is the confidence,
recov is the number of recovered instances, nAttrib is
the number of attributes in the rule, ampl is the av-
erage size of intervals of the attributes belong to the
rule and w
s
, w
c
, w
r
, w
n
and w
a
are weights in order to
drive the process of search of rules.
The meaning of each parameters in the equation
is:
• Support (sop). Percentage of records in the
dataset covered by the rule.
• Confidence (conf ). Conditional probability of
consequent given the antecedent. Confidence is
calculated dividing the support of the rule and the
support of the antecedent.
• Number of Recovered Instances (recub). It is
used to indicate a sample has already been cov-
ered by a previous rule. Rules covering different
regions of search of space are preferred.
• Number of Attributes (natrib). Number of at-
tributes (genes) belong to the rule (individual).
• Amplitude (ampl). Average of intervals size of
the attributes belong to the rule.
3 RESULTS
The results of applying the algorithm proposed in
Section 2 to a dataset acquired from a microarray
experiment related to inflammation and immune re-
sponse are presented. Inflammation is a critical pro-
cess because the human body uses to protect it-
self from infections and lesions. In this experi-
ment, conducted at the University of St. Louis, Mis-
souri(Calvano et al., 2005), the blood of eight volun-
teers is analyzed, four treated with a toxin produces
an inflammatory process and 4 with placebo. Sam-
ples has been taken at 6 time points over 24 hours,
obtaining a total of 48 microarrays.
The algorithm was tested with the following pa-
rameters of AG: 100 for the size of the population,
100 for the number of generations, 20 for the num-
ber of rules to obtain, 0.8 for the mutation probability
p
Mut
of the individuals and 0.2 for the mutation prob-
ability p
MutGen
of each gene in the individual. The fit-
ness function weights are: 1 for w
s
, 0.5 for w
c
, 0.3 for
w
r
, 0.1 for w
n
, and 0.1 for w
a
. The reason to assign
a high value to the weight w
s
is to cover the maxi-
mum number of examples obtained by the rules. The
weight associated to the instances covered by other
rules and the size of the intervals are set to penalize
rules whose intervals are too large and covering ex-
amples already covered by other rules.
The algorithm has been executed 10 times, and
only those rules that cover a minimum of 6 samples
out of 48 (support 12.5 %) have been taken into ac-
count, obtaining a total of 76 rules of the 200 possible
rules (10 executions x 20 rules in each run). The limit
of the support has been set at that value because 6
samples shows data from a complete volunteer, and
such low limit for the support has been chosen be-
cause in this type of experiments we are interested
both in frequent relations, but also in the not so fre-
quent ones (McIntosh and Chawla, 2007).
The average support obtained for the 151 rules
has been 47.17% with a confidence close to 100% for
most of them. The average amplitude of intervals in
the rules was 24.7%, which justifies the use of quanti-
tative rules in place of the classical rules in which the
whole domain of the attribute is taken into account.
The rules obtained have accurately characterized
dataset treated, having two types of rules: those with
a support value between 75 % and 100 %, and those
ICAART 2011 - 3rd International Conference on Agents and Artificial Intelligence
576

Table 1: Analyzed Rules.
Id Rule Sup. (%) Conf. (%) Ampl. (%)
1 215091 s at ∈ [98.35 , 376.99] and 215760 s at ∈ [527.04 , 1168.82] 52 100 17
=⇒ 203944 x at ∈ [890.80 , 5308.61]
2 205119 s at ∈ [783.83 , 1527.60] and 215597 x at ∈ [8301.78 , 9819.85] 20 100 16
=⇒ 212967 x at ∈ [2076.59 , 2592.60]
3 222099 s at ∈ [859.491 , 1425.210] 55 100 17
=⇒ 49327 at ∈ [1517.45 , 2239.45]
with support values less than 50 % where in almost
cases cover records or endotoxin-treated group or
placebo group.
The number of rules covering the placebo group is
significantly higher, which makes sense because this
group has gene expression values more stable and fre-
quent than the group treated with endotoxin(Rubio-
Escudero, 2007). To examine the relevance of the
rules obtained in the studied problem, we have used
the Onto-CC software (Romero-Zliz et al., 2008),
which retrieves information regarding the functional-
ity of a set of genes that is passed as a query, and a PI
value (the probability of intersection) associated with
the relevance of these genes appear together in one
rule. PI is a value to minimize between 0 and 1 and
considered relevant those obtained under 0.05.
The results of only 3 rules are listed in Table 1 for
readability. When Onto-CC is applied, the PI values
obtained for every rule are quite low, indicating the
relevance of grouping these three genes with respect
to these terms, immune response and related terms are
explicitly included.
4 CONCLUSIONS
In this paper we present the result of applying an evo-
lutive technique for extracting association rules from
microarray data. We have seen the rules obtained are
able to successfully characterize the dataset applied,
either covering almost all samples, or covering sam-
ples only one of the two groups in the data: treated
with endotoxin or treated with placebo. In addition,
the mean amplitude of the intervals was 24.7%, which
justifies the use of quantitative rules in place of the
classical rules.
We have shown the relevance of the rules obtained
for the problem studied using the Onto-CC program.
The PI values obtained show significance in the group
of genes found in the rules, and secondly the terms
obtained querying Gene Ontology are closely related
to the problem of inflammation.
Thus, we conclude that the use of quantitative as-
sociation rules, in particular those obtained by the
algorithm proposed, is a valid method for analyzing
microarray data, and we consider it a starting point
for future work, applying this technique to other mi-
croarray data, comparing with other analytical tech-
niques and seeing the importance of the influence
antecedent-consequent obtained by the rules with re-
gard to genetic networks.
ACKNOWLEDGEMENTS
The financial support from the Spanish Ministry of
Science and Technology, project TIN 2007-68084-C-
02, and from the Junta de Andaluca, project P07-TIC-
02611, is acknowledged.
REFERENCES
Calvano, S. E., Xiao, W., Richards, D. R., Felciano, R. M.,
Baker, H. V., Cho, R. J., Chen, R. O., Brownstein,
B. H., Cobb, J. P., Tschoeke, S. K., Miller-Graziano,
C., Moldawer, L. L., Mindrinos, M. N., Davis, R. W.,
Tompkins, R. G., Lowry, S. F., and Large Scale Collab
Res Program, I. A. (2005). A network-based analysis
of systemic inflammation in humans. Nature, 437.
Durbin, R., Eddy, S., Krogh, A., and Mitchison, G. (1998).
Biological Sequence Analysis: Probabilistic Models
of Proteins and Nucleic Acids. Cambridge University
Press.
McIntosh, T. and Chawla, S. (2007). High-confidence rule
mining for microarray analysis. IEEE/ACM Transac-
tions on Computational Biology and Bioinformatics,
4(4):611–623.
Romero-Zliz, R., del Val, C., Cobb, J., and Zwir, I. (2008).
Onto-cc: a web server for identifying gene ontology
conceptual clusters. Nucleic Acids Res, 36(4):W352–
W357.
Rubio-Escudero, C. (2007). Fusion of Knowledge towards
Identification of Genetic Profiles in the Systemic In-
flammation Problem. Ph.D Thesis. Unversidad de
Granada.
Vannucci, M. and Colla, V. (2004). Meaningful discretiza-
tion of continuous features for association rules min-
ing by means of a som. In Proceedings of the Euro-
pean Symposium on Artificial Neural Networks, pages
489–494.
Venturini, G. (1993). SIA: a Supervised Inductive Algo-
rithm with genetic search for learning attribute based
concepts. In Proceedings of the European Conference
on Machine Learning, pages 280–296.
MINING QUANTITATIVE ASSOCIATION RULES IN MICROARRAY DATA USING EVOLUTIVE ALGORITHMS
577
