
LOCALISED TEMPERATURE PERCEPTION
IN HEALTHY ADULTS
Jérôme Foussier
Medical Information Technology, RWTH Aachen, Pauwelsstr. 20, 52074 Aachen, Germany
Jennifer Caffarel, Jürgen Te Vrugt
Philips Technologie GmbH Forschungslaboratorien Aachen, Weißhausstr. 2, 52066 Aachen, Germany
Steffen Leonhardt
Medical Information Technology, RWTH Aachen, Pauwelsstr. 20, 52074 Aachen, Germany
Keywords: Local temperature perception, Peltier element, Temperature sensation rate.
Abstract: This paper presents a testing procedure for local temperature perception with a following evaluation of the
acquired information. Relative temperature changes had to be noticed by the subjects. To apply a
temperature effect a peltier element arrangement, permitting to cool down and heat up with one element, has
been utilized. First results show good correlation with a warmth sensation scale, although highly subjective
parameters have been interpreted. The error rate in detecting small temperature changes is higher than for
larger changes, except for very high changes, which caused temperature misperceptions.
1 BACKGROUND
In some therapies the effect of cooling and heating is
used to treat illnesses (e.g. cryotherapy in pain
management, taking cold showers after a sauna
session or in photo thermal therapy). Another
treatment shows that cooling down fresh burn
wounds to a certain temperature improves healing
and limits tissue damage (Venter, T., Karpelowsky,
J., Rode, H., 2000). The use of superficial heat
results in higher tendons and ligament flexibility,
muscle spasm reduction, pain alleviation, blood flow
elevation or even boosts the metabolism (Kaul M.
P.; Herring S. A., 1994).
In therapies the affected areas sometimes are
smaller so that an overall cooling or heating would
not make more sense than a local temperature
change. In general the human body is a bad
temperature measurement device and the
temperature sensation increases while stimulating
bigger areas
(Parsons, K. C., 2003). It is possible to
believe there is a change to hot temperatures even
when temperature is decreasing. This can be shown
by the “grill effect” (Craig, A. D., 2002) for
example, where two metal plates, one hotter than the
other, both over skin temperature, are placed close-
by, and the person perceives a hot sensation. The
first grill illusion was created by interlaced warm
and cold stimuli at 40°C and 20°C by Thunberg in
1896 (Defrin, R. et al., 2002). Reducing the area
reduces the complexity of the hardware and the
needed power. The stimulation would be more
precise.
Mostly, larger areas of the body are heated up or
cooled down, but what about cooling and heating
local spots and can even small temperature changes
(e.g. ±1°C) be detected on a small area of skin? If
not, how big should the temperature step should at
least be to notice a change and is there a difference
between hot to cold change or cold to hot? This
paper will describe a testing procedure to answer
those questions.
2 TECHNICAL DESCRIPTION
In general the designed system handles temperature
ranges from 17°C to 40°C in a controlled way,
199
Foussier J., Caffarel J., Te Vrugt J. and Leonhardt S..
LOCALISED TEMPERATURE PERCEPTION IN HEALTHY ADULTS.
DOI: 10.5220/0003154801990203
In Proceedings of the International Conference on Biomedical Electronics and Devices (BIODEVICES-2011), pages 199-203
ISBN: 978-989-8425-37-9
Copyright
c
2011 SCITEPRESS (Science and Technology Publications, Lda.)
regarding the safe temperature ranges applied to the
skin, where temperatures below 15°C become
“slightly painful” as described in a study to develop
a European safety standard for touching cold
surfaces (Malchaire, J., et al., 2002). An application
of more than 45°C, close to burn threshold, evokes
pain (Parsons, K. C., 2003).
2.1 Cooling and Heating Device
The cooling and heating device consists of a 2.5cm
high built up peltier element arrangement (Figure 1).
Both sides of the element are glued on 3x3cm large
aluminum plates, of course thermally isolated each
other. Similar arrangements can also be found in
other construction, e.g. for rating the performance of
a peltier element. The bottom “cold” side is applied
to the skin. On the “hot” side, a ribbed heat sink with
a top-mounted fan ensures the dissipation of heat,
which is provoked by the peltier element itself, due
to the general poor energy efficiency of about 50-
60%. By inverting the flow direction of the electrical
current, it is possible to switch the “hot” and the
“cold” side of the peltier element, hence allowing
cooling and heating of the skin with one single
element.
Figure 1: Schematic view of the assembly.
2.2 Temperature Controller
A microcontroller controls the temperature on the
skin side by permanently evaluating the embedded
and calibrated temperature sensor. Using peltier
elements with alternating voltages or currents means
a further loss in efficiency, because the heat transfer
direction is inverted during the negative peaks of the
signal. This is the reason why a microcontroller-
regulated DC controller has been built to prevent the
negative effect and to keep the temperature constant
at the desired value. It also allows temperature
change rates on the skin in the order of 1-3°C/s.
The temperature controller can be managed via a
personal computer and adequate software. With a
graphical user interface (GUI), the investigator is
able to set the output temperature either manually or
automatically with a predefined list. A graph
displays real-time measured temperature values to
be able to control the correct functioning of the
hardware. In addition, an automatic program can be
started, which switches between two fixed
temperatures for a defined duration.
3 TEMPERATURE
PERCEPTION TEST
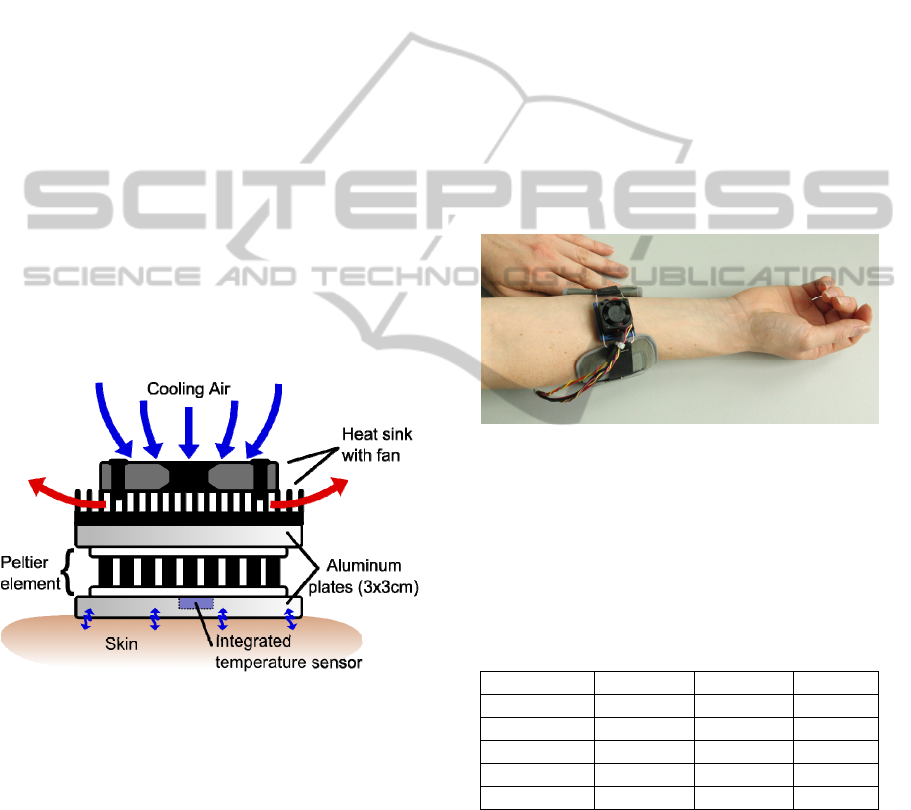
For the test the cooling and heating device was
attached to the forearm (see Figure 2).
Figure 2: Peltier element with fixing cuff applied to the
forearm.
This location is easily accessible, the fat layer is
not very thick and the thin skin is sensitive. In
addition possible hairiness of the person does not
affect the application.
Table 1: Overview of all subjects (values are in the format:
mean (standard deviation)).
Overall Female Male
Number 11 4 7
Over 30 yrs. 6 2 4
Under 30 yrs. 5 2 3
Age 36.8 (10.4) 33.75 (10.1) 38.6 (10.5)
T
neutral
[°C] 33.1 (2.1) 32.3 (0.5) 33.6 (2.6)
Table 1 gives an overview of all the subjects who
attended the test, where T
neutral
gives the individual
perception of the neutral sensed temperature of the
applied element. As not only the temperature but
also the kind of applied material and the contact
pressure play a role in temperature perception, the
neutral temperature is not necessarily equal to the
real skin temperature of the person. This is due to
BIODEVICES 2011 - International Conference on Biomedical Electronics and Devices
200

different contact coefficients and different resulting
contact temperatures t
k
(Lutz, P., 2002).
21
2211
bb
tbtb
t
k
+
⋅
+
⋅
=
(1)
where b
1
and b
2
are the contact coefficients in
125.0 −−
°CmWs , t
1
and t
2
the contact temperatures
of the two materials in °C. Example values for
wood, steel and skin contact coefficients are
b
wood
≈ 400, b
steel
≈ 14000 and b
skin
≈ 1000. At room
temperature (22°C) the contact temperatures
between skin (34°C) and steel/wood are respectively
23°C and 31.5°C. This shows that wood feels
warmer than steel at equal object temperatures. To
feel the aluminum plate as neutral it consequently
has to be heated up and kept at a constant
temperature. It is important that the person has to get
used to the whole element, before the test can be
started to avoid any bias sensation. Afterwards the
test can be initiated:
The whole test procedure consists of five
different subtests:
1. Determining the neutral sensed temperature
T
neutral
of the peltier element
2. Varying the temperature slightly (max. ±Δ3°C)
around T
neutral
randomly
3. Varying the temperature in bigger random steps
(max. –Δ22°C and +Δ6°C to T
neutral
)
4. Cycling in time steps of 20s between two fixed
temperatures (e.g. 18°C ↔ 33°C)
5. Same as 2.
In case of an extreme discomfort, the subjects
were instructed how to remove the element from the
fixation rapidly and by themselves. The subjects
were asked to describe every change they noticed
and to rate their perception (e.g. spatial, temperature
and comfort), without knowing the actual
temperature value. The investigators wrote down
every remark during the test while the computer
displayed and recorded the temperature
measurement values. None of the persons sensed an
extreme discomfort with the applied temperatures.
Each subtest started and ended with the neutral
temperature to avoid any accommodation or greater
loss in sensitivity. The total duration of the test was
approximately 30 minutes for each person.
4 RESULTS AND DISCUSSION
Mainly there are two possibilities to interpret the
obtained information. The first one would be to
determine the difference between two temperature
set points, the second the difference between the
neutral temperature of the person and the set point.
For a start the focus was set on the first possibility,
by gathering all the occurrences of temperature steps
from the test (410 in total). To obtain a
representative graphical evaluation, five temperature
steps have been merged into one group and
normalised to the total number of occurrences in this
group.
Figure 3 shows the result of all persons. “■ 0”
means that the person did not detect a change or was
unsure, “■ ==” denotes a correct (e.g. sensation of
warming for an increase in temperature) and “■ !=”
an incorrect sensed temperature change.
Distinguishing between female/male persons or
under/over 30 years old persons did not produce
significant differences in results. The absolute sums
of the occurrences in the seven ranges are as
follows: [75, 26, 51, 119, 42, 31, 66]. Greater
temperature steps are better distinguishable (>70%)
than smaller steps and uncertainties or incorrect
answers are almost insignificant. The overall
average percentage of incorrect answers is less than
15%.
Grouped temperatures (normalised, m/f)
0,00
0,10
0,20
0,30
0,40
0,50
0,60
0,70
0,80
0,90
1,00
<-12°C -12…-8°C -7…-3°C -2…2°C 3…7°C 8…12°C >12°C
Temperature steps
Occurrences
==
0
!=
Figure 3: Overall evaluation of perceived temperature
steps (normalised for male and female).
The above described test procedure allows
interpreting the average temperature sensation over
the whole testing time. As subtest 2 and subtest 5
use equal temperature steps (see chapter 3), one just
performed at the beginning, the other at the end of
the whole test, it is possible to give a trend on how
the sensitivity altered, especially for small changes
around the neutral temperature (±Δ3°C). The results
for this are given in Table 2, which gives a separate
LOCALISED TEMPERATURE PERCEPTION IN HEALTHY ADULTS
201

view on all, male and female persons, over and
under 30 years old persons. It is clear, that sensing
performance decreases. The subjects found it harder
to detect the small temperature steps after having
performed the two subtests with bigger temperature
steps before. If they had guessed for the temperature
changes, statistically the “==” and the “!=” data
would have changed similarly. In fact only the “==”
degraded significantly and the persons either tended
to say nothing or were confused by the sensation
(reconstructed on the basis of the acquisition
protocol) which leads in higher values for the “0”.
Striking points are the values for female persons in
the “!=” section, where the wrong perception of
temperatures increased instead of falling compared
to the other subjects. This could be explained by the
strong decrease in the “==” and the relative low
increase in the “0” section compared to the male
subjects. The incertitude for sensing a small
temperature change in this test is therefore higher for
female than for male persons.
Table 2: Comparison between the same subtests 2 and 5.
Subtest 2 Subtest 5 Difference
==
All 44.7% 37.8% -6.9%
Female 45.2% 35.5% -9.7%
Male 44.4% 39.2% -5.2%
> 30 years 37% 31.1% -5.9%
< 30 years 53.8% 45.9% -7.9%
!=
All 14.1% 13.4% -0.7%
Female 9.7% 12.9% 3.2%
Male 16.7% 13.7% -3%
> 30 years 15.2% 13.3% -1.9%
< 30 years 12.8% 13.5% 0.7%
0
All 41.2% 48.8% 7.6%
Female 45.2% 51.6% 6.4%
Male 38.9% 47.1% 8.2%
> 30 years 47.8% 55.6% 7.8%
< 30 years 33.3% 40.5% 7.2%
Based on two existing scales of warmth
sensation, the Bedford comfort scale and the
ASHRAE sensation scale (Parsons, K. C., 2003), it
is possible to classify words like “cool”, “warm” and
“neutral” according to Table 3
(Parsons, K. C.,
2003).
Both combined with the delivered comments (a
total count of 341) of the tested persons, noted in the
acquisition protocol, and related to their neutral
perceived temperature, it is possible, even though
not always evident, to generate an intensity map of
the sensation (Figure 4). This is a potential
alternative to interpret the obtained data. In the
graph the temperature difference to the neutral
Table 3: Scales of warmth sensation.
Scale Bedford comfort scale
ASHRAE sensation
scale
7 Much too warm Hot
6 Warm Warm
5 Comfortably warm Slightly warm
4 Comfortable Neutral
3 Comfortably cool Slightly cool
2 Too cool Cool
1 Much too cool Cold
temperature is ranged from -22°C to +7°C on the
abscissa, where 0°C represents the neutral
temperature. The intensities of three temperatures
have been summed up, followed by a normalisation
to 1. The warmth scale is applied to the ordinate,
ranging from 1=cold to 7=hot.
Except for some outliers, especially around -
20°C, caused by a misperception of a big
temperature step (can be seen for “■ !=” in
Figure 3), the linear trend (dotted line) is clearly
noticeable and encourages the use of the sensation
scale as indicator, even if it could seem that the use
of words should deliver very vague information. It is
amazing that persons around the neutral temperature
(±Δ3°C) mostly say that it is comfortable, but cannot
notice small changes reliably (see Table 2).
Figure 4: Temperature sensation map, using a combination
of the Bedford comfort and the ASHRAE sensation scales.
In further work the post-analysis of the test by
another person should be replaced by a scale, where
the persons can enter themselves their perception in
the range of 1-7 (cold-hot). Integrated into a separate
input mask, such as a touch sensitive display, the
data acquisition could be automated as far as
possible thus reducing interpretation errors and the
amount of outliers which would give an even clearer
trend in the temperature sensation intensity map.
Also the effect of placebo could be investigated by
showing the persons “wrong” temperature values
and therefore subconsciously influencing their
temperature perception.
BIODEVICES 2011 - International Conference on Biomedical Electronics and Devices
202

The placement of the element shows one big
disadvantage: the exposure of the arm to the ambient
temperature could lead to a centralization of the
whole body resulting in colder extremities and a
possible lower temperature sensation. Answer to this
issue could be to cover the skin around the element
with a piece of cloth.
To conclude the discussion the results show that
small temperature changes (±Δ2°C in Figure 3) on a
small surface cannot be sensed reliably. For
reliabilities greater than 60% a temperature step of at
least ±Δ8°C is needed. A major difference between a
hot to cold and a cold to hot change could not be
definitively found in this testing, thus needing more
investigation on this open question.
ACKNOWLEDGEMENTS
Research was supervised by Prof. Dr.-Ing. Dr. med.
S. Leonhardt, RWTH Aachen University in Aachen
and has been supported by Dr. J. Caffarel and Dr. J.
te Vrugt of the Philips Research Aachen.
REFERENCES
Venter, T., Karpelowsky, J., Rode, H., 2000. Cooling of
the burn wound: The ideal temperature of the coolant.
In Burns
Kaul M. P.; Herring S. A., 1994. Superficial Heat and
Cold: How to Maximise the Benefits. In The Physician
and Sportsmedicine.
Parsons, K. C., 2003. Human thermal environments: the
effects of hot, moderate, and cold environments on
human health, comfort and performance, 2nd edition
Craig, A. D., 2002. How do you feel? Interoception: the
sense of the physiological condition of the body. In
Nature Reviews Neuroscience 3.
Defrin, R. et al., 2002. Sensory determinants of thermal
pain. In Brain
Malchaire, J., et al., 2002. Temperature Limit Values for
Gripping Cold Surfaces, In The Annals of
Occupational Hygiene.
Lutz, P., 2002. Lehrbuch der Bauphysik, Vieweg+Teubner
Verlag, 5th edition
LOCALISED TEMPERATURE PERCEPTION IN HEALTHY ADULTS
203
