INCREASING RELIABILITY AND INFORMATION CONTENT
OF PULSE OXIMETRIC SAHS SCREENING ALGORITHMS
Nicole Gross, Jennifer Friedmann, Christophe Kunze, Wilhelm Stork
FZI Forschungszentrum Informatik, Haid-und-Neu-Strasse 10-14, Karlsruhe, Germany
Daniel Sánchez Morillo
1
, Antonio Leon Jimenez
2
, Luis Felipe Crespo Foix
1
1
Escuela Superior de Ingeniería Automática, University of Cádiz, Cádiz, Spain
2
Hospital Purta del Mar, University Hospital of Cádiz, Cádiz, Spain
Keywords: SAHS, Sleep apnea, Screening, Pulse oximetry.
Abstract: About 3% of people suffer from sleep apnea-hypopnea syndrome SAHS. SAHS is a sleep associated
respiratory disorder that negatively affects life quality and life expectancy. It is assumed that more than 80%
of SAHS concerned are neither diagnosed nor therapied. Reliable and easy-handling SAHS screening
systems are needed. Within this study, the reliability of pulse oximeter as a well-established, non-invasive
medical device is examined for SAHS screening. Reliability of existing SAHS screening algorithms will be
assessed. Hereby, the focus is on the influence of different desaturation detection strategies and the
dependence on thresholds. Critiques on pulse oximetry as SAHS screening device will be responded. In this
regard, guideline conform grey area integration in SAHS screening (concerning apnea-hypopnea index AHI
between 5 and 15) is recommended. In particular, as by grey area integration an improvement of convenient
SAHS screening algorithm reliabilities of about 7.3% in sensitivity and 8.7 % in specificity was achieved
even in the most reliable tested algorithm. In a final step, room for improvement of screening results
interpretation even without sleep medicine expert skills is indicated. In connection to this, possibilities of
short-term frequency analysis of SpO
2
data are demonstrated in its prospects for individualized SAHS
screening quality.
1 INTRODUCTION
One of the most common sleep disorders is the sleep
apnea-hypopnea syndrome SAHS. SAHS is a sleep
associated respiratory disorder, characterized by
repetitive breathing cessations. The hourly number
of respiratory breath arrests persisting more than 10
seconds (apnea) and reductions of respiratory flow
of at least 50% (hypopnea) is called the apnea-
hypopnea index AHI. AHI allows a classification of
apneic patients (cf. table 1). Threshold for
pathological AHI values is between 5/h and 15/h,
depending on the coexistence of documented
symptoms of excessive daytime sleepiness EDS.
(Downey, 2010) (S3-Guideline, Mayer 2009).
SAHS affects about 3% of people in the
industrialized countries (Young, 1993) whereat the
prevalence increases with male gender and age
Table 1: Guideline for apnea classification (Mayer, 2009).
AHI SAHS classification
AHI<5/h SAHS-healthy
5/h ≤AHI≤15/h
without EDS
SAHS-healthy
5/h ≤AHI≤15/h
with EDS
SAHS (mild)
15/h < AHI < 30/h SAHS (moderate)
AHI ≥ 30/h SAHS (severe)
(WHO World Health Organization). Standard
diagnosis for sleep apnea is the polysomnograpy, a
multi-sensorial physiological measurement to get a
complex sleep profil of the apnea suspect. As the
application of polysomnography is labor-intensive
and requires high technical expertise (Flemons,
2003), this examination is coupled with an overnight
stay in hospital or a aggreditied sleep laboratory.
Apart from high costs, required material and
upcoming waiting times for an examination, by this
438
Gross N., Friedmann J., Kunze C., Stork W., Sánchez Morillo D., Leon Jimenez A. and Crespo Foix L..
INCREASING RELIABILITY AND INFORMATION CONTENT OF PULSE OXIMETRIC SAHS SCREENING ALGORITHMS.
DOI: 10.5220/0003156104380445
In Proceedings of the International Conference on Bio-inspired Systems and Signal Processing (BIOSIGNALS-2011), pages 438-445
ISBN: 978-989-8425-35-5
Copyright
c
2011 SCITEPRESS (Science and Technology Publications, Lda.)
way, patient’s inhibitions to undertake such an
examination must not be neglected.
Nowadays it is assumes that not even 10-20% of
moderate to severe SAHS patients are actually
diagnosed (Finkel, 2009), (Kapur, 1999), (Young,
1997), (Esteller, 2008), (Downey, 2010). Thereby an
early diagnosis and treatment of SAHS is proved to
reduce SAHS associated risk factors such as
fragmented structure of sleep, excessive daytime
sleepiness, loss of concentration and performance
and to augment the risk for cardio-vascular diseases
(Wantke, 2008). Untreated SAHS reduces life
quality and life expectancy for the patients
concerned. The requirement of reliable and easy-to-
use SAHS screening systems is obvious and already
persecuted on the market. Hence, this makes high
demands on the automatic analysis and screening
algorithms of pulse oximetric data.
Besides the medical requirements for reliability of
the screening results, there are several preconditions
that such screening systems should comply for its
application. As such, system should be applicable by
the patient himself after a short introduction by a
general practitioner. An automatic analysis and
interpretation of recorded screening data should be
possible as sleep medical interpretation skills of
recorded data cannot be presupposed (Netzer, 2001).
Widely-used and accepted for SAHS screening is the
overnight analysis of SaO
2
data by a non-invasive,
spectralphotometric pulse oximeter – wearable at the
fingertip or earlap. SaO
2
values determined by pulse
oximetry are called SpO
2
. Pulse oximetry is applied
in SAHS for the detection of desaturation in SpO
2
that are caused by apnea and hypopnea events. The
number of desaturations per hour is called the
desaturation index DI and correlates with AHI. The
intensity of respiratory desaturations is depending on
the apnea-hypopnea intensity and the inital SpO
2
value before the desaturation event.
Summarizing, pulse oximetry is already an easy-
to-use and cost-saving medical analysis device that,
based on automatic analysis of data, is sufficient for
reliable determination of apnea pretest probabilities.
(Wessendorf, 2002)(Mayer, 2009). But final
diagnosis, here the experts agree, is not to be
adviced by a screening system and should be
confirmed in a sleep laboratory.
2 METHODS
Within this study, existing pulse oximetric SAHS
screening algorithms based on time domain analysis
of SpO
2
[%] data are analyzed. Reviewing existing
algorithms, different strategies for apnea classifica-
tion are examined in their influence on reliabity and
comparability of screening results. Hereby, a main
focus of attention is given to the dependence on
thresholds and time windows under consideration.
Actual guidelines consider a grey area 5/h≤AHI≤15,
where an individual diagnosis is indicated. So, we
are going to weigh the pros and cons of grey area
integration into existing screening algorithms. As
future prospect, short-term-frequency analysis of
SpO
2
data is presented as a biosignal instrument to
sharpen the convenience and quality of patient
individual interpretation of SAHS screening results.
2.1 Pulse Oximetric Reference Data
The basis of the following comparisons is the
polysomnographic data of the University hospital
Puerta del Mar in Cádiz (Spain). It is the data of a
standard polysomnogram (Rechtschaffen, 1968)
(GES, 2005) including a fingertip pulse oximeter
(Erich-Jaeger, model number 70750A19, 2 Bytes
sample rate, range 0.0% - 100.0%). The sampling
rate of this pulse oximeter is 8 Hz. Desaturations are
defined to be at least 4 precentage points decreasing
in SpO
2
data without being limited on a certain time
interval. The patient collective includes 115 patients
of different age, gender and sleep apnea severity
code. DI values of patient collective are between 0
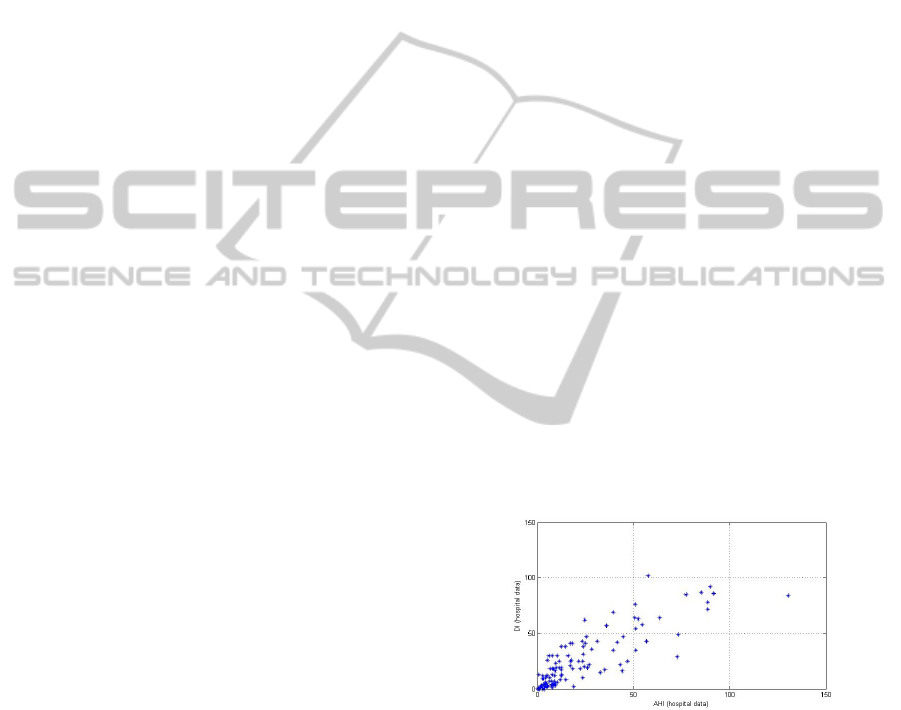
and 102; AHI is between 0.01 and 130. Figure 1
shows the correlation amongst the AHI and DI
values calculated by the hospital data.
Figure 1: Comparison of DI(hospital) and AHI(hospital).
The total correlation coefficient is 0.8436. In lower
AHI values, the correlation increases significantly.
In more specific terms, this means that the area of
AHI and DI <15 (classifier threshold for apnea
healthy and mild apnea patients) are correlated by a
coefficient of 0.9293.
For further calculations DI thresholds for apnea
classification are equalized to the AHI thresholds of
table 1 as there is a direct linear correlation between
DI and AHI values within the patient collective. This
assumption also coincides to preceding studies
INCREASING RELIABILITY AND INFORMATION CONTENT OF PULSE OXIMETRIC SAHS SCREENING
ALGORITHMS
439
(Torre-Bouscoulet, 2007) (Guideline of SEPAR,
2002). To quantify and assess the reliability of
different strategy and threshold compositions in
pulse oximetric SAHS screening algorithms, the
specificity (SP) and sensitivity (SE) (see equation 1)
of the combinations are compared as measurement
for the algorithms reliability.
SE =
right positive
right positive + false negative
SP =
right negative
right negative + false positive
Equation 1: Sensitivity (SE) and Specificity (SP).
2.2 Data Preprocessing
Before study analysis, pulse oximetric data
undergoes an artifact reduction that excludes
unphysiolgical SpO
2
values from data set.
Subsequently a moving average filter follows (cf.
equation 2). 2m+1 is the filter width, k is the index
of the actual data point and m equals 4 (corresponds
to 0.5 seconds of data record). The filter equation is:
∗
=
1
2 + 1
Equation 2: Moving average filter.
In relation to short-term analysis, SpO
2
data will
be downsampled to 1Hz and is filtered by a band
pass filter of bandwidth 0.015 Hz - 0.05 Hz. The
window length for short-term analysis is 60 seconds
with an overlap of 5/6. The estimation of power
spectral densities PSD in short-term frequency
analysis is made by the Yule-Walker algorithm.
Yule-Walker algorithm is an auto-regressive
function consisting of the last N measured values
y(t-1) to y(t-N) of the signal and a noise component
s(t) (cf. equation 3). s(t) is statistically normal
distributed. Mean value of noise is 0; standard
deviation is σ. The specified order of Yule-Walker
algorithm is 30.
(
)
=−
(
−
)
+()
Equation 3: Estimation of PSD via Yule-Walker
algorithm.
3 REALIZATION
By reviewing existing algorithms based on pulse
oximetric measurements, different strategies for
apnea classification can be identified. Within the
following study we will analyse the influence of
individual types of algorithms and thresholds on the
reliabity and comparability of screening results.
3.1 Reliability of Convenient SAHS
Screening Algorithms
Most existing and established algorithms refer to the
typical saw tooth desaturation course of SpO
2
data
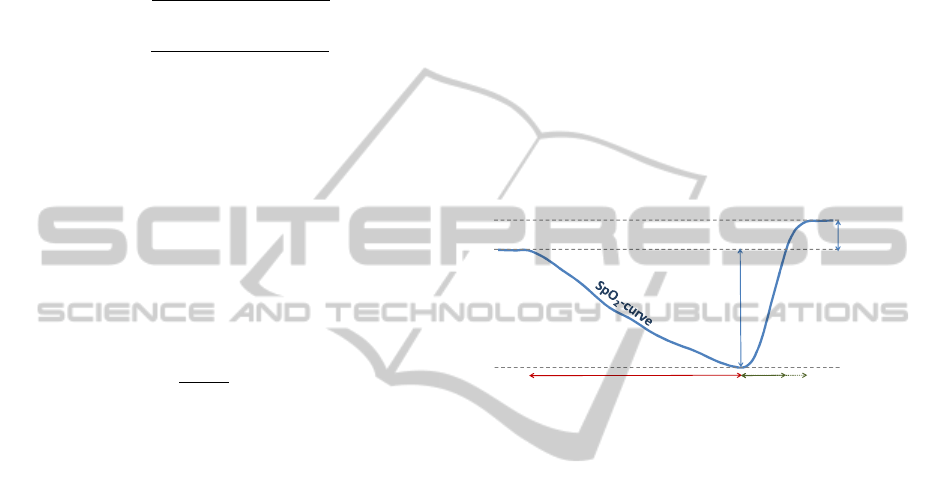
as it results of precursory respiratory events. Figure
2 illustrates such a typical apnea desaturation event
including the subsequent resaturation process.
In principle, two accepted approaches in time
domain algorithms can be differed:
1. Desaturation based algorithms
2. Resaturation based algorithms
Figure 2: Typical course of an apnea caused desaturation.
Desaturation bases algorithms consider the slow
decrease of SpO
2
values, which occurs shortly after
a respiratory event. Frequently used thresholds are
3%, 4% or 5% for desaturation classifiers (Netzer,
2001). Often, there is also a time window indicated
to quantify the decreasing rate of SpO
2
data. Thus,
e.g. Rauscher (1991) examinded a time window of
40 seconds. Resaturation based algorithms focus on
the rapid reincrease of SpO
2
values at the end of
each respiratory event. To rebalance the oxygen
debt, breath frequency at the end of each SAHS
events is usually augmented. This results in an
accelerated increase of arterial oxygen saturation,
possibly with a short-term overshoot of SpO
2
above
of initial values (cf. figure 2). Approved thresholds
are increases of at least 3% within a time window of
10 seconds (Rauscher, 1991).
The following analysis is motivated by the
comparison of the contrast between such diverse
desaturation counting strategies. Desaturation (
↓) and
resaturation (
↑) appendages with different percentage
thresholds within predefined time periods will be
examined in relation to the screening reliability in
comparison to the AHI diagnosis. Reliability of
desaturation classifiers by at least 3% SpO
2
and 4%
SpO
2
decreases (desaturation method)
and
Intensity of
desaturation
[% SpO
2
]
Time of desaturation
p
rocess
Time of resaturation
p
rocess
Short-term
overshoot
of SpO
2
BIOSIGNALS 2011 - International Conference on Bio-inspired Systems and Signal Processing
440
accordingly at least 3% SpO
2
and 4% SpO
2
increases
(resaturation methods) are analyzed. Predefined time
periods are between 10 and 40 seconds generated by
corresponding moving time windows over the
recorded SpO
2
data. Double count of extended
desaturations in neighboring windows is avoided.
Precondition of a new event count is a previous
significant change of slope. In dependence on the
pathological defined AHI between 5 and 15 (cf.
table 1), the limit of a pathological amount of
desaturations per hour was center-defined by DI≥10
(q.v. GES, 2005) (cf. table 2).
Table 2: DI based SAHS classification.
DI classifier SAHS classification
DI < 10/h SAHS-healthy
DI ≥ 10/h SAHS (mild – severe)
The reliability of the DI classifier were assessed
in comparison to the hospital established SAHS-
classifier at AHI≥10 (cf. table 3). For this purpose,
SE and SP were determined. However, the resulting
reliability of all DI based SAHS classifier
modifications turned out to be not truly satisfying.
Even if SE tends to reliable percentages (maximum:
95.46%, mean: 84.89%), SP remains quite low
(maximum: 89.8%, mean: 67.49%) (cf. table 3). The
best composed result in respect to reliability was
reached by desaturation algorithm with desaturation
threshold at 4% in considered time windows of 30
seconds (SE=84.85%; SP=81.6%). According to
these analysis outcomes, we agree with the critics
complaining about the unsufficient specificity of
convenient pulse oximetric algorithms. Nonetheless
it may not be forgotten, that separating at DI=10 and
AHI=10 is a very hard threshold for SAHS
classification. Even actual guidelines (Mayer, 2009)
do not draw such a hard classifier line (cf. table 1).
Often, the algorithm results and the AHI diagnosis
from the hospital (AHI
hospital
) nearly agree and differ
in just a slight amount (total mean deviation of best
valued algorithm: -1.681). Nevertheless the final
classification sometimes fails because of the results
closeness to the classifier threshold.
3.2 Grey Area Integration
According to the German Guideline for apnea
classification, subjects with AHI between 5/h and
15/h are considered as a mild apnea patients if there
are coexisting EDS. If not, the subject is defined as
SAHS-healthy. Identification of EDS is depending
on a visit to a doctor and not possible by
conventional pulse oximetry screening methods.
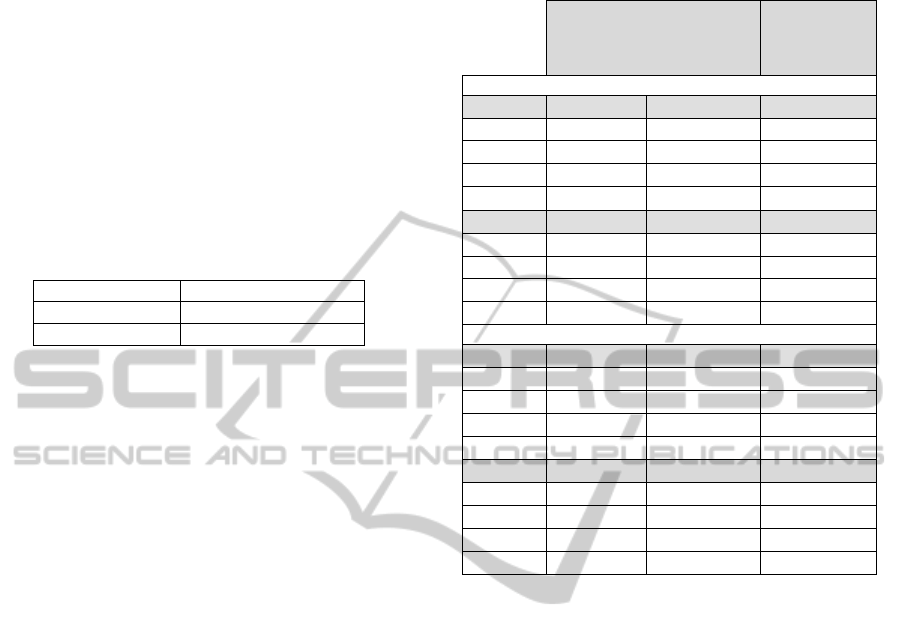
Table 3: Reliability of desaturation and resaturation
counting thresholds.
SAHS classifier
DI
algorithm
≥10
vs.
AHI
hospital
≥10
Mean deviation
Desaturation algorithms
Algorithm
SP (%) SE (%)
3%↓ 10s
77.6 81.82 1.910
3%↓ 20s
59.2 92.42 5.641
3%↓ 30s
57.1 93.94 5.458
3%↓ 40s
53.1 93.94 3.954
Algorithm
SP (%) SE (%)
4%↓ 10s
89.8 66.67 -5.264
4%↓ 20s
81.6 78.79 -1.785
4%↓ 30s
81.6 84.85 -1.681
4%↓ 40s
83.7 69.7 -4.133
Resaturation algorithms
Algortihm
SP (%) SE (%)
3%↑ 10s
59.2 89.4 4.476
3%↑ 20s
47.0 95.46 6.893
3%↑ 30s
47.0 95.46 6.015
3%↑ 40s
49.0 95.46 4.232
Algorithm
SP (%) SE (%)
4%↑ 10s
81.6 75.76 -2.316
4%↑ 20s
73.5 86.36 0.023
4%↑ 30s
69.4 86.36 -0.603
4%↑ 40s
69.4 87.88 -1.924
Applying this guideline considering the existence
of EDS, the previous algorithms will be reviewed.
DI values 5/h ≤DI≤15/h are reassigned to a new
defined grey area (cf. figure 3). The comparison to
hospital values keeps the limit at AHI=10/h.
It is obvious that both, SE and SP increase
significantly by grey are integration (cf. table 4).
The increase in SE values averages about 7%; and in
SP values 2.9%. This becomes apparent in figure 4.
Here, the ROC-curves of all tested algorithm
constellations are visualized in individual subplots.
Within these subplots, a comparison of algorithms
with and without grey area integration is provided.
The improvement of reliability is evident at prima
facie.
Considering the grey area integration, the best
reliability is calculated by the 4% decreasing
algorithm with a time window of 30 seconds. This is
equivalent to the non-grey-area algorithm analysis
result, but compared to the same algorithm without
the grey area classification group, SP improves
by8.7% to SP=90.32% and SE rises by 7.3% to
SE=92.16%. Both values, SP and SE above 90%
leads to the conclusion that pulse oximetry under the
described conditions might be a definitely valuable
and reliable device in screening of SAHS suspects.
INCREASING RELIABILITY AND INFORMATION CONTENT OF PULSE OXIMETRIC SAHS SCREENING
ALGORITHMS
441
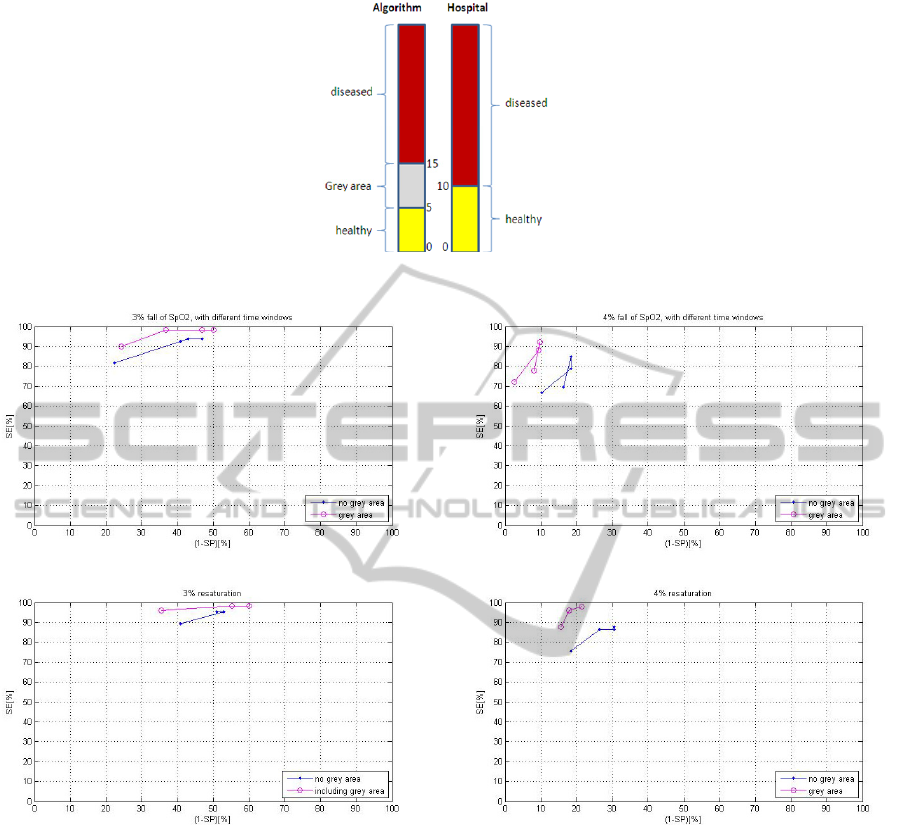
Figure 3: SAHS screening classification algorithm including grey area.
Figure 4: ROC comparing algorithms with and without grey area integration.
Nonetheless, we would emphasize that subject
individual conditions are worth to be focused more
in screening systems. In this concern, a budding
prospect for pulse oximetric SAHS screening will be
presented within the following.
3.3 Prospects of Short-term Analysis in
SAHS Screening Interpretation
In the past, screening algorithms spent only little
attention to the intensity of desaturation events.
Thereby, desaturation events may vary between less
than 4% and up to 20% or more in SpO
2
. For
example, on the one hand, some hypopneas even do
not induce desaturations corresponding to
convenient definitions (e.g. decrease of at least 4%
in SpO
2
). On the other hand, and based on lower
initial SpO
2
values, the decrease of arterial oxygen
saturation proceeds quite fast even within short term
respiratory event. Hence, to determine the intensity
of SAHS caused desaturations, the duration of
desaturation events and the depth of SpO
2
decreases
has to be considered as an additional screening result
factor. In the fallowing we will derive a method
using short-term frequency analysis that permits to
depict the intensity of desaturation events in the
course of sleep in a quantitative, but easily
interpreted graphic image.
Examining the duration of single respiratory
caused desaturation events, it becomes apparent that
desaturations are predominantly of a duration
between 20 and 60 seconds (cf. figure 5).
BIOSIGNALS 2011 - International Conference on Bio-inspired Systems and Signal Processing
442
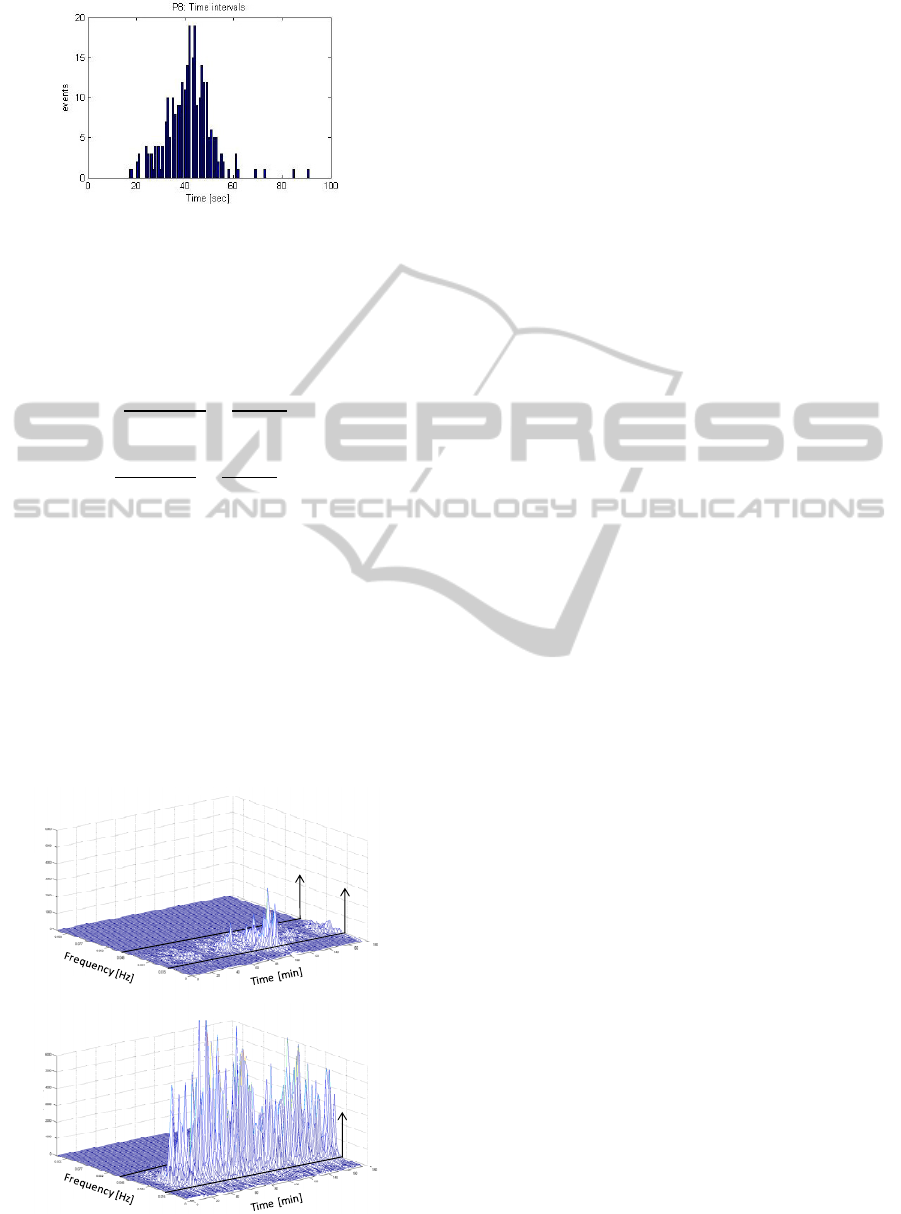
Figure 5: Duration of single desaturation events (e.g.
severe apnea patient).
Transfered to frequency domain, this results in a
minimum frequency of 0.05 Hz and a maximum
frequency of 0.0167 Hz for SAHS typical
desaturations (cf. equation 4).
_
=
1
_
=
1
20
= 0.05
_
=
1
T
_
=
1
60
= 0.0167
Equation 4: Frequency range of typical SAHS caused
desaturations.
Because of the saw tooth behaviour and thus
sinus likewise course of desaturations in SpO
2
, a
peak in power spectral density shapes between
0.0167 and 0.05 Hz (cf. (Gross, 2007) (Zamarrón
(peak between 0.014 Hz - 0.033 Hz), 1999)). The
peak height depends on depth and frequency of the
respiratory events within the considered time
window.
Figure 6: Intensity of desaturation events over sleep time.
The position on the frequency axis gives information
about the mean duration of the events within the
actual interval. Over the time axis, temporal
delimation of events is made possible.
Using short-term frequency analysis on recorded
SpO
2
data, the intensity of desaturation events can
be visualized in a clear and easy to interpret
individual SpO
2
sleep profil (cf. figure 6). Expressed
in simplified terms, it can be assumed, that the
higher the peaks, the more intensive are the
desaturation of the events are. And the more
frequent the peaks, the higher the desaturation
affected sleep time. As distinguished from time
domain presentation of SpO
2
data, non-SAHS
characteristic desaturations (e.g. long-term
desaturations caused by hypoventilation) are filtered
out of the desaturation intensity graphic image.
4 RESULTS
Within this study, we evaluated the reliability of
existing SAHS screening algorithms based on
overnight pulse oximetric records. We could provide
evidence that, in general, resaturation based
algorithms are the more specific algorithms and
desaturation based algorithms are the more sensitive
ones. Nonetheless, and according to actual
assessments on pulse oximetry in use for SAHS
screening, we have to summarize that the reliability
of convenient SAHS screening algorithms is
unsatisfactory. Such conclusion was reached turning
the attention to the maximum SE and SP results.
Thus, all screening algorithms constellations that
deliver a sensitivity of at least 85% do not reach a
specificity above 75%. None of the tested algorithms
stands out by both, a satisfactory high sensitivity and
specificity. Such unreliable result corresponds to the
comparable findings of many other critics on pulse
oximetric screening (Netzer, 2001), (Mayer, 2009) et
alii.
The mean difference of AHI and DI values was
generally quite small, especially in threshold near
SAHS patients, we assumed that the lack in
reliability must occur mainly because of the hard
SAHS classifier threshold. Classifier thresholds are
usually set at a fix and defined value like DI = 10.
Two patient groups result, those with DI < 10 being
the SAHS healthy classified and those with DI ≥ 10
being the SAHS suspects by pulse oximeter
screening. The hard threshold and the fact that AHI
and DI especially in moderate to severe SAHS
patients differ in a certain amount (cf. figure 1) leads
to unsatisfying SE and SP results. This assumption
AHI = 25.5
AHI = 89.9
Power Spectral Density Power Spectral Density
0.05Hz
0.0167Hz
0.0167Hz
INCREASING RELIABILITY AND INFORMATION CONTENT OF PULSE OXIMETRIC SAHS SCREENING
ALGORITHMS
443

was confirmed by including a grey area
characterized by the patient‘s individual need for
diagnosis. The integration of this grey area as an
additional classification group for apnea screening
could significantly improve the reliablity of SAHS
detection. The grey area was implemented in
reference to the actual German guideline that also
earmarks this area for requiring a patient‘s indivi-
dual classification in dependence on coexisting EDS
within these thresholds. The best result was obtained
by a decreasing type algorithm using a decrease
threshold of ≥4% within a moving time window of
30 seconds. The yielded reliability was SE=92.16
and SP=90.32 by a mean deviation of calculated DI
vs. real AHI of -1.68/h. In comparison to the same
algorithms without grey area consideration, this
showed an increase of 7.3% in SE and 8.7% in SP.
In a final manner, we animadvert that generally,
information about the intensity of desaturations gets
lost within existing SAHS screening algorithms.
Extended and deep desaturations (e.g. 40 seconds
and 15%) are not differed from shorter and light
desaturations (e.g. 20 seconds and 5%). In this
regard, we presented the prospects of short-term
frequency analysis of SpO
2
data. Thus, individual
sleep profiles of overnight desaturation
characteristics can be visualized in an easy to
interpret three-dimensional graph. This allows
drawing conclusions on intensity and repetitivity of
desaturation events, even by non sleep medicine
specialists.
5 DISCUSSION
According to sleep medicine guidelines, pulse
oximetry is a reliable medical device for SAHS pre-
test probability assessment; keeping in mind that is
not able to substitute a sleep medical diagnosis via
polysomnography (q.v. Netzer (2001), Wessendorf
(2002)). Thus, pulse oximetry is not able to detect
e.g. neither AHI nor EDS. Convenient SAHS
screening algorithms classify SAHS suspects
according to determinable DI values that can differ
from patients’ AHI. Possible causes of this diversity
of DI and AHI are multiple. For example there are:
- Hypopneas, that by definition are decreases
in breath flow, but that do not have to be
accompanied by pronounced desaturations
(Konietzko, 1998).
- Moving artifacts, that may lead to a over-
estimation of real DI values (Netzer, 2001).
- Physiological dependences like the initial
arterial oxygen saturation or the perfusion at
the point of measurement (Oczenski, 2008).
- Dependences on pulse oximeter model
(Zafar, 2005).
- Dependences of desaturation classifier
definition.
Nonetheless we demonstrated that the reliability
of SAHS pretest results yielded to trustworthy SE
and SP values ≥ 90% in comparison to AHI
diagnosis by polysomnography in sleep laboratory.
Against this background and with regard to the high
prevalence of SAHS we see a high, but still not
exploited potential of pulse oximetry in SAHS
screening and pretest application. Furthermore we
see the requirement and room for improvement of
the analyzability and interpretability of recorded
pulse oximetric screening data even by non-sleep
medicine experts. In this context, we presented
prospects of the short-term analysis of SpO
2
data for
improvement of SAHS screening by individual
SAHS sleep profiles considering desaturation
intensities and its temporal clusters.
REFERENCES
Downey, R., Gold, P. M., Wickramasinghe H., Medscape
2010, Obstructive Sleep Apnea
Esteller, E., Huerta, P., Segarra, F., Matiñó, E., Enrique,
A., Ademà, J. M., Acta Otorrinolaringol Esp. 2008,
Undiagnosed (corrected) cases of obstructive
sleepapnoea syndrome: a new reason for involvement
of otorhinolaryngologists, 59(2):62-9.
Finkel, K. J., Searleman, A. C., Tymkew, H., Tanaka, C.
Y., Saager, L., Safer-Zadeh, E., Bottros, M., Selvidge,
J. A., Jocobsohn, E., Pulley, D., Duntley, S., Becker,
C., Avidan, M. S., Sleep Med 2009, Prevalence of
undiagnosed obstructive sleep apnea among adult
surgical patients in an academic medical center,
10(7):753-8.
Flemons, W. W., Littner, M. R., Rowley, J. A., Gay, P.,
McDowell Anderson, W., Hudgel, D. W., McEvoy, R.
D., Loube, I. L., Chest 2003, Home Diagnosis of Sleep
Apnea: A Systematic Review of the Literature: An
Evidence Review Cosponsored by the American
Academy of Sleep Medicine, the American College of
Chest Physicians, and the American Thoracis Society,
124:1543-1579.
Gross, N., Kunze, C., Stork, W., Müller-Glaser, K., Rojas
Ojeda, J. L., Crespo Foix, L. F., Sánchez Morillo, D.,
León, A., BMT 2007, Schlafapnoeprädiagnose und -
klassifikation basierend auf nicht-linearer Analyse
pulsoximetrischer Daten.
Grupo español de sueño GES, Sociedad Española de
Neumología y Cirurgía Torácico SEPAR 2005,
Documento de consenso nacional sobre el síndrome
BIOSIGNALS 2011 - International Conference on Bio-inspired Systems and Signal Processing
444

de apneas-hipopneas del sueño (SAHS)
Kapur, V., Blough, D. K., Sandblom, R. E., Hert, R., de
Maine, J. B., Sullivan, S. D., Psaty, B. M., SLEEP
1999, The Medical Cost of Undiagnosed Sleep Apnea,
22(6):749-755.
Konietzko, N., Teschler, H., Freitag, L., 1998,
Schlafapnoe, Pathopysionlogie der obstruktiven
Schlafapnoe, 13.
Mayer, G., Fietze, I., Fischer, J., Penzel, T., Riemann, D.,
Rodenbeck, A., Sitter, H. Teschler, H., Somnologie
2009, S3-Leitlinie: Nicht erholsamer Schlaf /
Schlafstörungen.
Netzer, N., Eliasson, A. H., Netzer, C., Kristo, D. A.,
Chest 2001; Overnight Pulse Oximetry for Sleep-
Disordered Breathing in Adults: A Review. 120:625-
633.
Oczenski, W., Georg Thieme Verlag 2008, Atmen –
Atemhilfen – Atmphysiologie und Beatmungstechnik,
8.Auflage, p.370-371.
Rechtschaffen, A., Kales, A., 1968, Manual of
Standardized Technology, Techniques and Scoring
System for Sleep Association for the
Psychophysiological Study of Sleep
Rauscher, H., Popp, W., Zwick, H., Lung 1991,
Computerized Detection of Respiratory Events during
Sleep from Rapid Increase in Oxyhemoglobin
Saturation, 169:335-342.
Torre-Bouscoulet, L., Castorena-Maldonado, A., Baños-
Flores, R., Vázquez-García, J. C., Meza-Vargas, M. S.,
Pérez-Padilla, R., Arch Bronconeumol 2007,
Agreement between oxygen desaturation index and
apnea-hypopnea index in adults with suspected
obstructed sleep apnea at an altitude of 2240m,
43(12):640-54.
Wantke, F., J Kardiol 2008, Beatmungstherapie bei
Schlafapnoe – Indikation und Auswirkungen auf inter-
nistische Erkrankungen – ein Minireview, 15:364-8.
Wessendorf, T. E., Alymov, G., Wang, Y.-M., Stampa, J.
Thilmann, A. F., Teschler, H., Pneumologie 2002,
Pulsoximetrie als Schlafapnoescreening bei
Schlaganfallpatienten, 56:357-362.
Young, T., Palta, M., Dempsey, J., Skatrud, J., Weber, S.,
Badr, S., N Engl J Med 1993, The occurrence of sleep-
disordered breathing among middle-aged adults.
328(17):1230-5.
Young, T., Evans, L., Finn, L., Palte, M., Sleep 1997,
Estimation of the clinically diagnosed proportion of
sleep apnea syndrome in middle-aged men and
women, 20:705-706.
Zafar, S., Ayappa, I., Norman, R. G., Krieger, A. C.,
Wals-leben, J. A., Rapoport, D. M., Chest 2005,
Choice of Oximeter Affects Apnea-Hypopnea Index,
127:80-88.
Zamarrón, C., Romero, P. V., Rodriguez, J. R., Gude, F.,
Clinical Science 1999, Oximetry spectral analysis in
the diagnosis of obstructive sleep apnoea, 97:467-473.
INCREASING RELIABILITY AND INFORMATION CONTENT OF PULSE OXIMETRIC SAHS SCREENING
ALGORITHMS
445
