
FALSE ALARM FILTERING IN A VISION TRAFFIC SIGN
RECOGNITION SYSTEM
An Approach based on AdaBoost and Heterogeneity of Texture
Sergio Lafuente-Arroyo, Saturnino Maldonado-Basc
´
on
Hilario G
´
omez-Moreno and Pedro Gil-Jim
´
enez
Deparment of Signal Theory and Communications, University of Alcal
´
a, Alcal
´
a de Henares, Madrid, Spain
Keywords:
Intelligent transportation system (ITS), Traffic sign setection and recognition system (TSDRS), AdaBoost,
Support vector machines (SVMs), Pattern recognition.
Abstract:
The high variability of road sign appearance and the variety of different classes have made the recognition
of pictograms a high computational load problem in traffic sign detection based on computer vision. In this
paper false alarms are reduced significantly by designing a cascade filter based on boosting detectors and a
generative classifier based on heterogeneity of texture. The false alarm filter allows us to discard many false
positives using a reduced selection of features, which are chosen from a wide set of features. Filtering is
defined as a binary problem, where all speed limit signs are grouped together against noisy examples and it is
the previous stage to the input of a recognition module based on Support Vector Machines (SVMs). In a traffic
sign recognition system, the number of candidate blobs detected is, in general, much higher than the number
of traffic signs. As asymmetry is an inherent problem, we apply a different treatment for false negatives (FN)
and false positives (FP). The global filter offers high accuracy. It achieves very low false alarm ratio with low
computational complexity.
1 INTRODUCTION
Traffic sign detection and recognition tasks based on
vision systems and artificial techniques arise in a
wide range of applications, such as intelligent vehi-
cles that operate automatically, advanced driver as-
sistance systems (ADA), which use the information
captured from sensors surrounding the vehicle to as-
sist the driver or automatic traffic sign inventory in
order to maintain highway infrastructure periodically,
which allows to alert about the lack of visibility of
specific traffic signs.
Independently of the application, time optimiza-
tion is a crucial item in a traffic sign detection sys-
tem and one of the major problems is the high number
of false alarms that the system considers as potential
signs even when the number of positive targets in each
image is too low. As the computational load depends
on the number of samples to analyze, processing time
becomes considerable. In this paper we present a false
alarm filter integrated in a vision system in order to
discard these candidate objects as soon as possible.
There are several approaches to detect traffic
signs. Many of them are based on color segmentation
using different spaces, such as RGB (de la Escalera
et al., 1997) or HSI (Maldonado-Basc
´
on et al., 2007)
considering particular colors of the signs present in
cluttered scenes. Other alternatives use borders detec-
tion, texture detection and genetic algorithms (de la
Escalera et al., 2003). More recently (Bahlmann
et al., 2005) suggested AdaBoost for detection. With
respect to identification module, neuronal networks,
(Fang et al., 2003), and support vector machines,
(Maldonado-Basc
´
on et al., 2007), have been the
recognition techniques most widely used. Specifi-
cally, the last one is well known by their excellent
generalization properties as it can be demonstrated
even when the dataset has a high number of classes.
Other approaches are based on the use of Matching
Pursuit (MP) (Hsu and Huang, 2001) and Human Vi-
sion Models (Gao et al., 2006). Although the input
to these classifiers is in most cases the gray level of
the pixels in the space domain, other researches con-
form the underlying vector extracting features, such
as histograms (Vicen-Bueno et al., 2005), FFT com-
puted after a complex log-mapping of exterior borders
(Hibi, 1996) and wavelets (Hsu and Huang, 2001).
269
Lafuente-Arroyo S., Maldonado-Bascón S., Gómez-Moreno H. and Gil-Jiménez P..
FALSE ALARM FILTERING IN A VISION TRAFFIC SIGN RECOGNITION SYSTEM - An Approach based on AdaBoost and Heterogeneity of Texture.
DOI: 10.5220/0003156402690276
In Proceedings of the 3rd International Conference on Agents and Artificial Intelligence (ICAART-2011), pages 269-276
ISBN: 978-989-8425-40-9
Copyright
c
2011 SCITEPRESS (Science and Technology Publications, Lda.)

(a) (b) (c) (d)
(e) (f)
Figure 1: Examples of segmentation processes. (a), (c), (e) Original images; (b) red mask; (d) achromatic mask; (f) blue
mask.
2 SYSTEM OVERVIEW
An exhaustive description of the traffic sign detection
and recognition system (TSDRS) on which this re-
search is based can be found in (Maldonado-Basc
´
on
et al., 2007) and (Gil-Jim
´
enez et al., 2008). The sys-
tem consists of the following steps: segmentation, de-
tection and recognition. Although this work is fo-
cused in the improvement of the last stage, it is neces-
sary to make a brief description of the whole system.
2.1 Segmentation
The purpose of this stage is to isolate candidate traf-
fic signs from the background of the scene. Color
information, specifically HSI space, is considered in
our system to extract candidate objects from the in-
put image by thresholding. Major advantage of HSI
space is that its color components, Hue and Satura-
tion, are closely related to human perception. In ad-
dition, an extra achromatic decomposition similar to
the one used in (Liu et al., 2002) is implemented. In
Figure 1 some segmentation examples are illustrated,
including only the interest masks for each case.
2.2 Detection
The detection block aim is the identification of the
shape of each candidate blob. Our algorithm com-
pares the signature of the objects under analysis with
the theorethical signatures in a discrete set of angles,
being defined the signature as the distance from the
mass center to the edge of the blob as a function of the
angle. The Figure 2 shows the signature of a triangle.
x
y
r(a)
a
(a)
0
p/4 p/2 3p/4 2p
a(rad)
r( )a
0
0.05
0.1
0.15
0.2
0.25
(b)
Figure 2: Shape signature of a triangular sign. (a) Reference
shape; (b) associated signature.
To make the algorithm invariant to object rotations,
comparisons are performed using the absolute value
of the FFT of the signature.
2.3 Recognition
The purpose of this stage is to identify the informa-
tion related to the pictogram of candidate traffic signs.
This step is implemented by SVM with Gaussian ker-
nel where the input vector is a normalized-size block
in gray-scale for each candidate blob. The strategy
we follow is one-against-all with a number of clas-
sifiers equal to the number of classes that belong to
each case to analyze, regarding to color and shape.
We must point out that only some pattern vectors of
the training set define the decision hyperplane. These
pattern vectors are known as support vectors.
ICAART 2011 - 3rd International Conference on Agents and Artificial Intelligence
270

3 COMPUTATIONAL LOAD
As well as achieving high accuracy, a recognition sys-
tem should also prevent erroneous identification of
non-signs, i.e., limiting the number of false alarms
and even when the purpose is not oriented to real time
applications (in our case we are concerned about road
maintenance tasks), the computation time should be
as low as possible. Computational time required to
process an image in a TSDRS depends on multiple
factors. The most relevant are related to:
1. Image Properties. The properties of the images
to capture are easily configurable through the ac-
quisition system. Computational load in the seg-
mentation stage is strongly influenced by image
size, especially when algorithms work in a pix-
elwise fashion. We can reduce the image size
considering a trade-off between speed and detec-
tion probability since small objects in the scene
are difficult to detect and identify. Furthermore,
in the case of a TSDRS that includes tracking it
is crucial to detect the signs since that appear in
the first frames of the sequence with small sizes.
Other criterion to consider is wether the system
works with grayscale or color images. Processing
with grayscale images demands lower computa-
tional load but color information is lost. With the
purpose to reduce the image analysis a possible
alternative is to define the area to explore.
2. Number of Segmentation Algorithms. As we
demonstrate in (G
´
omez-Moreno et al., 2010)
there’s not an algorithm robust enough to all dif-
ficulties from outdoor environments. For this rea-
son, our TSDRS allows us to work with different
algorithms in parallel although their information
is highly redundant and the load complexity in-
creases.
3. Complexity of the Recognition Module. In a
recognition system based on SVMs the number
of support vectors grows as the number of classes
and training samples do.
In order to find the main bottlenecks and optimize
the system to improve its performance, we analyze
the computation profile. In Table 1 profiles of the
three main stages mentioned are summarized. The
rest of processing time is dedicated to other tasks,
such as image read/write operations. By a simple in-
spection, we can observe that computational load of
the recognition process is approximately 15 and 46
times higher than the corresponding to the detection
stage and segmentation detection stage, respectively.
The reason is a consequence of the high number of
support vectors to manage in the test phase when a
realistic road sign database is considered.
Table 1: Computational load in the three sub-stages of the
TSDRS.
Process CPU cycles
Recognition 49363
Detection 3118
Segmentation 1068
In this way, since the recognition module based on
SVMs is executed for every candidate object, com-
putational cost for each frame increases linearly with
the number of objects at the input of the recognition
stage. Unfortunately, most of theses objects are false
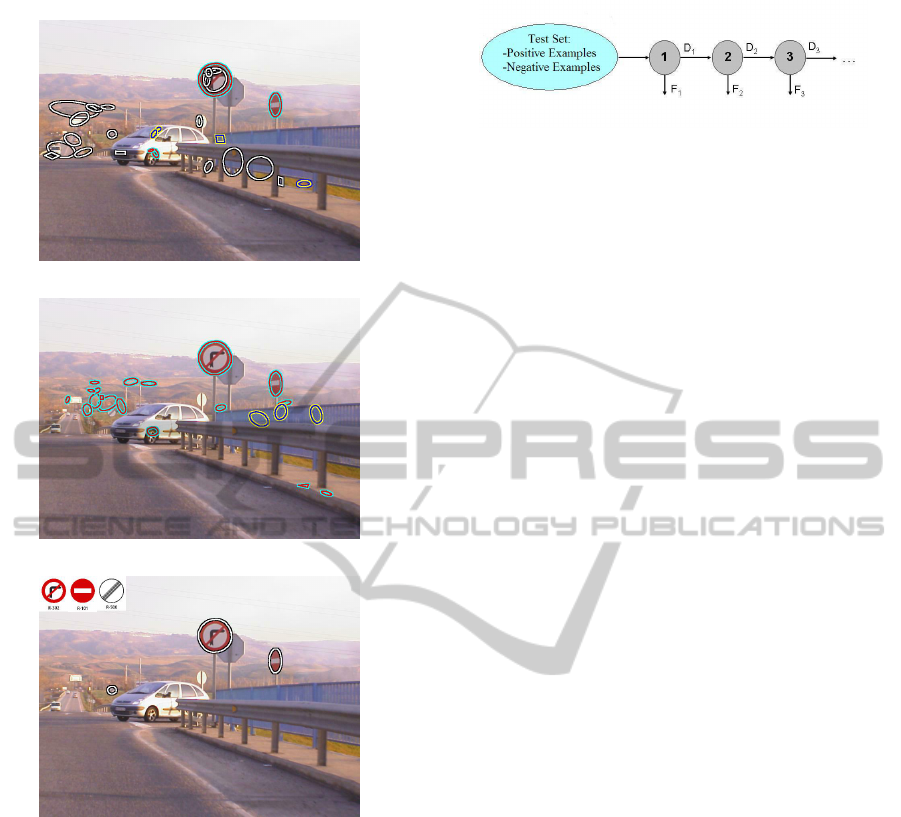
positives. So, in Fig.3 we can observe the output
detection module for an image, to which we apply
two segmentation algorithms. Note that all the de-
tected objects are identified through their correspond-
ing geometric shape. In the recognition stage all false
alarms are discarded, but our aim in this research is to
reduce the number of objects evaluated in this process
due to its computational load.
In this research our proposal is to decrease the
number of false positives at the input of the recog-
nition module in order to minimize the computational
load. The aim is to implement a false alarm filter us-
ing the Viola-Jones detector as a previous step to the
recognition module based on SVM and so, reduce the
load of the TSDRS.
4 FALSE ALARM FILTER
In machine learning community it is well known
that more complex classification functions yield lower
training errors yet having the risk of poor generaliza-
tion. If the main consideration is test set error, struc-
tural risk minimization provides a formal mechanism
to select a classifier with the right balance of com-
plexity and training error. Another significant con-
sideration in classifier design is computational com-
plexity. Since time and error are fundamentally dif-
ferent quantities, no theory can simply select the op-
timal trade-off. Nevertheless, for many classification
functions computation time is directly related to the
structural complexity. In this way temporal risk mini-
mization is clearly related to structural risk minimiza-
tion.
This direct analogy breaks down in situations
where the distribution of classes is highly skewed.
For example, in our TSDRS there may be dozens of
false positives among one or two traffic signs in an im-
age. In these cases we can reach high detection rates
and extremely fast classifications. The key insight is
FALSE ALARM FILTERING IN A VISION TRAFFIC SIGN RECOGNITION SYSTEM - An Approach based on
AdaBoost and Heterogeneity of Texture
271
(a)
(b)
(c)
Figure 3: Candidate objects before the recognition stage.
(a),(b) Candidate objects represented by their correspond-
ing shapes for each segmentation algorithm. (c) Traffic sign
recognition results once detected objects from both algo-
rithms have been integrated.
that while it may be impossible to construct a simple
classifier that can achieve a low training/test error, in
some cases it is possible to construct a simple classi-
fier with a very low false negative rate. For example, it
is relatively simple to construct an extremely fast clas-
sifier with a very low false negative rate (i.e. it almost
never misses a sign) and a 50 false positive rate. Such
a detector should be more accurately called a classifi-
cation pre-filter: when an image region is labeled non-
sign then it can be immediately discarded, but when
a region is labeled sign then further classification ef-
fort is required. Such pre-filter can be implemented
through a cascade of classifiers (see Figure 4), where
Figure 4: Schematic diagram of a detection cascade. The
initial stages eliminates a large number of negative exam-
ples with very little processing. After several layers of pro-
cessing the number of false alarms have been reduced radi-
cally.
each classifier follows the AdaBoost algorithm. In the
design of such structure, several parameters have to be
fixed: maximum false positive rate (F
max
) of the cas-
cade, minimum detection rate (D
min
) of the cascade,
maximum false positive rate ( f
i
|
max
) of the ith clas-
sifier and minimun detection rate (d
i
|
min
) of the ith
classifier. Given a trained cascade of classifiers, the
detection and false positive rate are:
F =
K
∏
i=1
f
i
(1)
D =
K
∏
i=1
d
i
(2)
where K is the number of classifiers, F and D are the
false positive rate and detection rate of the cascade,
respectively, and f
i
and d
i
are the false positive rate
and the detection rate, respectively, of the ith classi-
fier.
Even though there are many stages, most are not
evaluated for many noisy samples since they are dis-
carded at the first stages. In a cascade, computa-
tion time and detection rate of the first stages is crit-
ically important to overall performance. In the cas-
cade structure each stage is implemented according to
the AdaBoost algorithm due to its low computational
complexity in the test phase.
Major extensions of this method have been pro-
posed in two directions: improvement of the algo-
rithm and feature sets.
4.1 Dissociated Dipoles
A more general type of features than the Haar-like
ones, the dissociated dipoles or sticks have been pre-
sented by Balas and Sinha (Balas and Sinha, 2003),
which are composed of a pair of rectangular elements,
named the excitatory dipole and the inhibitory dipole,
respectively (see Fig. 5). As in the case of Haar-like
features, the integral image is used to calculate the
sum of the pixels inside the rectangular regions and
the feature value is equal to the difference between
the values of both dipoles normalized by the number
of stick pixels.
Taking into consideration color information, we
ICAART 2011 - 3rd International Conference on Agents and Artificial Intelligence
272

(a) (b) (c) (d) (e)
Figure 5: Examples of dissociated dipoles. The white re-
gion corresponds to the excitatory dipole whereas the black
region corresponds to the inhibitory region.
(a) (b) (c)
Figure 6: Channels of feature extraction in an example. (a)
Luminance channel, (b) Red Channel, (c) White channel.
propose to apply dipoles in different color compo-
nents. When the dipole is applied to each color chan-
nel, the feature represents the average intensity of a
specified color component over the region. Specif-
ically, we consider four color channels: red, blue,
white and yellow and an additional luminance chan-
nel. Previously to the integral image, we extract the
color mask in the same way than in segmentation
process using HSI for red and blue channels and an
achromatic decomposition for white channel. In Fig.6
we can observe the masks corresponding to the lumi-
nance and the red and achromatic channels for one ex-
ample. The blue and yellow masks are not illustrated
since all pixels have a zero value.
The contribution of a dissociated dipole for each
channel is computed as the difference mentioned
above between the excitatory and inhibitory regions:
Value =
I
channel
N
channel
exc
−
I
channel
N
channel
inh
(3)
In the case of the luminance channel, I
channel
rep-
resents the sum of gray levels in region delimited by
the stick, whereas in each color channel represents the
number of pixels segmented by this color. N
channel
is
the number of pixels of the region which are covered
by the stick.
With the purpose to make qualitative comparisons
between the sticks, we can simplify the expression
considering only the sign of the difference. This ap-
proach presents luminance normalization as advan-
tage.
4.2 Discrete AdaBoost
AdaBoost algorithm finds precise hypotheses by com-
bining several weak classification functions which
have moderate precision. AdaBoost is an iterative al-
gorithm that finds, from a feature set, some weak but
discriminative classification functions and combines
them in a strong classification function:
H =
1,
T
∑
t=1
α
t
h
t
≥
1
2
T
∑
t=1
α
t
= S,
0, otherwise
(4)
where H and h
t
are the strong and weak classification
functions, respectively, and α
t
is a weight coefficient
for each h
t
. Different variants of boosting are devel-
oped: discrete AdaBoost, real AdaBoost, gentle Ad-
aBoost, and so forth. However, we use the first one.
Each weak classifier is defined for a feature j as a
binary response:
h
t
=
1, ifp
j
f
j
< p
j
θ
j
0, otherwise
(5)
where f
j
is the value of the feature j, which is
given by the contribution of a dipole as it is men-
tioned above, θ
j
is the threshold and p
j
is the parity.
For each feature j, AdaBoost determines an optimal
threshold θ
j
for which the classification error on train-
ing database (with positive and negative examples) is
minimized. The weight coefficient for each h
t
is com-
puted as:
α
t
=
1
2
ln
1 −e
t
e
t
(6)
where e
t
is the sum of the weigths associated to the
samples classified wrongly.
4.3 Assymetric Recognition
Asymmetry is an inherent problem in recognition sys-
tems where the number of positive targets is too low
with respect to negative patterns. That is, to achieve a
high detection rate, the cost of missing a target should
be higher than that of a false positive. Cost-sensitive
learning is a suitable way for solving such problems.
However, most cost-sensitive extensions of AdaBoost
are realized by heuristically modifying the weights
and confidence parameters of the discrete AdaBoost.
Thus, there should be different treatment for false
negatives (FN) and false positives (FP), that is, FN
samples are penalized more than FP samples. Since
AdaBoost aims at minimizing the bound of classifica-
tion error which treats FP and FN equally, the sym-
metric AdaBoost algorithm is not optimal for object
detection tasks. To deal with the class imbalance
problem in classification, various asymmetric exten-
sions of AdaBoost have been proposed in the litera-
ture. Most of them directly modify the weights and
confidence parameters of discrete AdaBoost with-
out clarifying the relations to the loss minimization
FALSE ALARM FILTERING IN A VISION TRAFFIC SIGN RECOGNITION SYSTEM - An Approach based on
AdaBoost and Heterogeneity of Texture
273

Figure 7: Examples of the benchmark data set. First row
includes positive samples whereas second and third row in-
clude noisy ones.
of AdaBoost. AdaCost (Fan et al., 1999) proposed
by Fan adopts an approach to make AdaBoost cost-
sensitive. They incorporated a cost adjustment func-
tion β
δ
(i) into the weight updating rule and the com-
putation of δ
t
. The weight updating formula was
modified into
D
t+1
(i) =
D
t
(i)exp(−α
t
y
i
h
t
(x
i
)β
δ
(i))
Z
t
(7)
where α
t
is computed as:
α
t
=
1
2
ln
1 +r
t
1 −r
t
(8)
and r
t
is
r
t
=
∑
i
D
t
(i)y
i
h
t
(x
i
)β
δ
(i) (9)
β=+1 if the output of the classifier is right and β=-1
otherwise. Finally,
β
+1
(i) = −0.5C
i
+ 0.5 (10)
and
β
−1
(i) = 0.5C
i
+ 0.5 (11)
The parameter C
i
is the cost factor assigned to the
i-th sample and is restricted to the interval [0 1].
4.4 Results
The Recognition and Multi-sensorial analysis group
(GRAM) at the Universidad de Alcal
´
a has collected
a complete database of Spanish traffic signs. All the
samples have been extracted from images acquired by
different video-cameras under variable lighting condi-
tions. The stored patterns are 31×31 pixels gray level
with homogeneous background for no-interest pixels.
So, the number of significative components is 961 for
rectangular signs while in circular signs is reduced to
709 and for for triangular signs to 511. Some exam-
ples are shown in Figure 7.
Without loss of generality, in this research we are
concerned about the speed limit signs. The bench-
mark data set is subdivided into three groups: train-
ing, validation and test set. From a total set of 872
positive samples and 3475 negative samples, 50% of
them are chosen randomly as training set, 25% for
the validation set and the remaining 25% forming the
test set. Negative samples have been previously taken
randomly from arbitrary images. The validation set is
used to tune the strong classifier decision thresholds
in order to reach the minimum acceptable correct de-
tection rate and the maximum acceptable false-alarm
rate during cascade training.
In the final detector the selected values for false
positive rate and detection rate of each strong classi-
fier are, respectively, fixed to f
i
|
max
= 0.9 · f
i−1
|
max
and d
i
|
min
= 0.994 · f
i−1
|
min
. Moreover, the false pos-
itive rate and detection rate of the cascade are fixed
to F=0.05 and D=0.9. The structure of the final de-
tector is a 11 layer cascade of classifiers with a total
of 28 features. In Table 2 is summarized the distri-
bution of features among the different stages. The
filter achieves a detection rate of 98.58% (3 positive
samples of 211 were considered false negatives) and
a false positive rate of 5.30% (822 negative samples
of 868 were discarded).
In the case of AdaCost boosting, using the same
parameters for the cascade structure, the detector we
obtained has 6 layers with a total de 28 features. In
Table 3 is summarized the distribution of features
among the different stages. The filter achieves a de-
tection rate of 98.10% and a false positive rate of
4.15%.
Anyway, from the Figure 7, we can observe that
pictograms of signs are well defined. We can take
advantage of this fact binarizing the samples using
Otsu’s method, which chooses a global threshold to
minimize the intraclass variance of the thresholded
black and white pixels. In Figure 8 are illustrated the
samples of Fig 7 after thresholding. For each bina-
rized image we can quantify the heterogeneity of tex-
ture computing for every pixel of coordinates (x,y) the
number the pixels in 8-neighboring that present differ-
ent level respect to it. The value is normalizazed with
respect to the total number of pixels that constitute the
object.
Normalized mean value of heterogeneity is shown
by the solid line in Figure 9, whereas drifts (maximun
and minimun) are shown by the dashed lines for the
different classes. The last label (Index = 10) corre-
sponds to the noisy class. Note that the distribution
shows a higher disparity of values for noisy samples
(class 10) and it may be discriminant enough for many
cases. Thus, only those candidate objects that present
a heterogeneity lower than θ
1
= 0.75 and higher than
θ
2
> 1.80 will be analyzed by the cascade filter. In
fact, 411 negative samples of the 868 (47.35%) that
conform the negative test set were discarded using
ICAART 2011 - 3rd International Conference on Agents and Artificial Intelligence
274
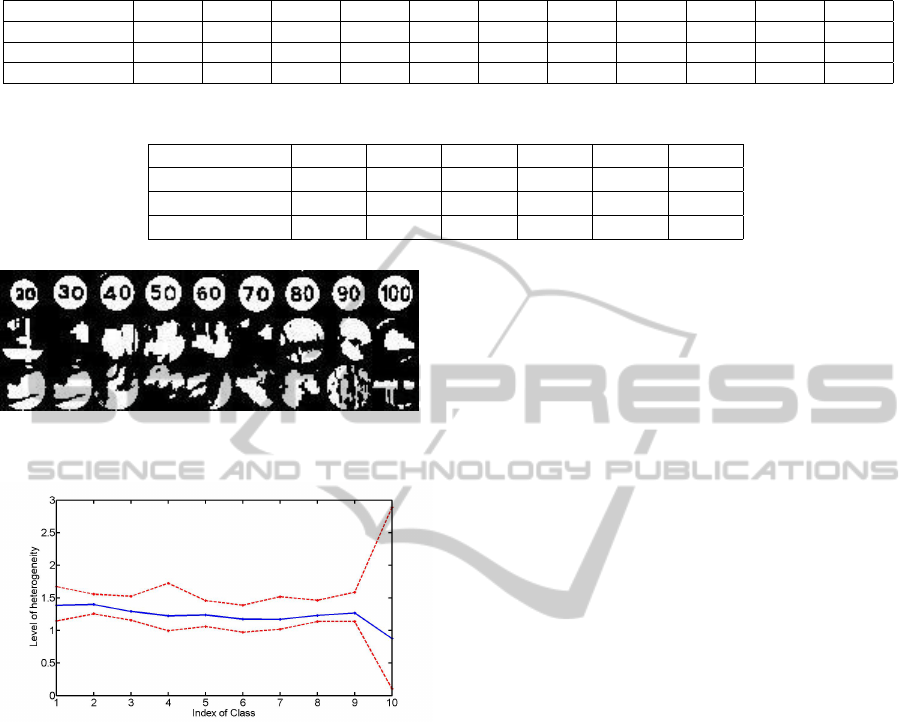
Table 2: Structure, detection rates and false alarm rates of the filter, which includes 11 boosting layers.
L1 L2 L3 L4 L5 L6 L7 L8 L9 L10 L11
No.Features 3 2 2 2 2 4 2 2 3 3 3
Detection Rate 99.0% 99.0% 99.0% 98.5% 98.5% 98.5% 98.5% 98.5% 98.5% 98.5% 98.5%
FA Rate 46.7% 31.2% 26.2% 21.3% 19.1% 16.9% 14.0% 11.0% 8.9% 7.2% 5.3%
Table 3: Structure, detection rates and false alarm rates of the filter based on AdaCost boosting, which includes 6 stages.
L1 L2 L3 L4 L5 L6
No.Features 7 2 5 10 3 1
Detection Rate 100% 100% 99.5% 99.5% 98.1% 98.1%
FA Rate 56.3% 25.9% 11.8% 8.7% 6.5% 4.1%
Figure 8: Binarized samples of the benchmark data set us-
ing Otsu’s method.
Figure 9: Illustration of the response of heterogeneity of
texture for different classes. The solid graph represents the
mean value whereas the dashed ones depict the minimum
and maximum values. The distribution shows a higher dis-
parity of values for noisy samples (class 10) than for the
rest.
this prerequisite. If we integrate this condition in the
cascade filter detection based on AdaCost, the filter
maintains a detection rate of 98.10% but the false pos-
itive rate is decreased until 2.65%. Note than in this
case, almost half of noisy examples are discarded di-
rectly by the condition of heterogeneity of texture be-
fore filtering. Furthermore, the false alarm ratio is
improved due to the heterogeneity texture.
Although cascades of boosted ensembles exhibit
real-time performance, training time ranges from days
to weeks. The factors that affect the training time are
the amount of training samples and feature-set size
that depends on the actual image dimensions of train-
ing samples. The traditional training approach has a
run-time of O(N · T · log(N)), where N represents the
number of samples and T is the number of features.
In our case, we work with a Sun Java WorkStation
and the training requires approximately 12 hours of
computation for 1600 features.
5 CONCLUSIONS
In this paper we present a false alarm filter based on a
cascade of boosted classifiers. The filter is integrated
in a vision system to detect and recognize traffic signs.
In this application the number of positive targets is
too low with respect to negative patterns and the com-
putational load of recognition task depends directly
on the number of samples to identify. In order to
decrease the number of candidate signs to be recog-
nized, the filter has the capacity of discard many false
positives with very low operations using the structure
of Viola-Jones. One of the main goals of this filter
is to include a first discriminant classifier based on a
measurement of heterogeneity texture. By combining
both techniques, the system achieves a very low false
alarm rate with low computational load.
Since in this work, we are concerned about speed
limit signs, our future work will be devoted to imple-
ment this approach with the whole set of traffic sign
set. Furthermore, the enormous time that Viola-Jones
algorithm demands in training process, makes it an
open item to research.
REFERENCES
Bahlmann, C., Zhu, Y., Ramesh, V., Pellkofer, M., and
Koehler, T. (2005). A system for traffic sign detection,
tracking, and recognition using color, shape, and mo-
tion information. In Intelligent Vehicles Symposium,
Proceedings, IEEE, pages 255–260.
Balas, B. and Sinha, P. (2003). Sticks: Image-representation
via non-local comparisons. Journal of Vision, 3(9).
FALSE ALARM FILTERING IN A VISION TRAFFIC SIGN RECOGNITION SYSTEM - An Approach based on
AdaBoost and Heterogeneity of Texture
275

de la Escalera, A., Armingol, J., and Mata, M. (2003). Traf-
fic sign recognition and analysis for intelligent vehi-
cles. Image and Vision Computing, 21:247–258.
de la Escalera, A., Moreno, L., Salichs, M., and Armingol,
J. (1997). Road traffic sign detection and classifica-
tion. Industrial Electronics, IEEE Transactions on,
44(6):848–859.
Fan, W., Stolfo, S., Zhang, J., and Chan, P. (1999). Adacost:
misclassification cost-sensitive boosting. In Proceed-
ings of International Conference on Machine Learn-
ing, pages 97–105.
Fang, C., Chen, S., and C., F. (2003). Road sign detection
and tracking”. IEEE Trans. on Vehicular Technology,
52(5):1329–1341.
Gao, X., Podladchikova, L., Shaposhnikov, D., Hong, K.,
and Shevtsova, N. (2006). Recognition of traffic signs
based on their colour and shape features extracted us-
ing human visual models. Journal of Visual Commu-
nication and Image Representation, 17(4):675–685.
Gil-Jim
´
enez, P., Maldonado-Basc
´
on, S., G
´
omez-Moreno,
H., Lafuente-Arroyo, S., and L
´
opez-Ferreras, F.
(2008). Traffic sign shape classificaction and localiza-
tion based on the normalized FFT of the signature of
blobs and 2D homographies. Elsevier Science. Signal
Processing, 88(2943):2955.
G
´
omez-Moreno, H., Maldonado-Basc
´
on, S., Gil-Jim
´
enez,
P., and Lafuente-Arroyo, S. (2010). Goal-evaluation
of segmentation algorithms for traffic sign recogni-
tion. IEEE Trans. on Intelligent Transportation Sys-
tems. Accepted for publication.
Hibi, T. (1996). Vision based extraction and recognition
of road sign region from natural color image, by us-
ing hsl and coordinates transformation. In Proc. of
the 29th. Int. Symposium Automotive Technology and
Automation, Florence, Italy.
Hsu, S. H. and Huang, C. L. (2001). Road sign detection
and recognition using matching pursuit method. Im-
age and Vision Computing, 19:119–129.
Liu, H., Liu, D., and Xin, J. (2002). Real-time recognition
of road traffic sign in motion image based on genetic
algorithm. Proc. of the 1st. Int. Conference on Ma-
chine Learning and Cybernetics, pages 83–86.
Maldonado-Basc
´
on, S., Lafuente-Arroyo, S., Gil-Jim
´
enez,
P., G
´
omez-Moreno, H., and L
´
opez-Ferreras, F. (June
2007). Road-sign detection and recognition based on
support vector machines. Intelligent Transportation
Systems, IEEE Transactions on, 8(2):264–278.
Vicen-Bueno, R., Gil-Pita, R., Rosa-Zurera, M., M. Utrilla-
Manso, M., and L
´
opez-Ferreras, F. (2005). Multilayer
perceptrons applied to traffic sign recognition tasks.
In Proc. of the 8th International Work-Conference on
Artificial Neural Networks,IWANN, pages 865–872.
ICAART 2011 - 3rd International Conference on Agents and Artificial Intelligence
276
