
WIRELESS DEVICE FOR NONINVASIVE RECORDINGS
OF CARDIO-RESPIRATORY SIGNALS
Pedro Giassi Junior, João Fernando Refosco Baggio, Raimes Moraes
Electrical Engineering Department, Federal University of Santa Catarina, Florianópolis, Brazil
Maurício Gonçalves de Oliveira
Medical School Hospital, Federal University of Santa Catarina, Florianópolis, Brazil
Keywords: Heart rate variability, Autonomic nervous system, Respiratory sinus arrhythmia, Esmolol, Atropine,
Wireless communication.
Abstract: This work describes a portable device that acquires two ECG leads, pulse photopletismography waveform
and respiratory flow waveform that are sent, using wireless Bluetooth protocol, to a notebook where they
are shown on the screen in real time and are also stored into the hard disk. Example of recording during
cardiac autonomic activity blockade is presented. The results show that the developed system is a suitable
tool to study autonomic modulation of the heart rate variability in different scenarios.
1 INTRODUCTION
The autonomic activity is usually assessed by means
of the heart rate variability (HRV) that has been
applied to several clinical studies related to
cardiological and non-cardiological conditions.
Indexes obtained from the HRV in the time and
frequency domains are used to point out changes of
the autonomic nervous system (ANS) activity. By
means of spectral analysis, power measurements of
low-frequency (LF=0.04 to 0.15Hz) and high-
frequency (HF= 0.15 to 0.4Hz) components of the
HRV are employed to quantify the activities of the
sympathetic (SNS) and parasympathetic nervous
systems (PNS), respectively, during cardiovascular
regulation (TASK FORCE, 1996).
Despite their widespread use, there is no
consensus on the suitability of these indexes as
autonomic outflow markers (Parati et al., 2006).
Breathing strongly modulates the HF components of
the HRV and, in a less significant way, the LF
components as well (Brown et al., 1993). These
modulations occur due to the direct neural coupling
among breathing, HR control centers of the brain
and venous return changes induced by the
intrathoracic pressure variation (Saul and Cohen,
1994). Therefore, HF power is simultaneously
affected by the PNS activity and by the breathing.
The arterial blood pressure (ABP), by means of the
baroreflex mechanism, also acts on the HR control
centers of the brain, contributing to HR oscillations
in the LF and HF bands (Cavalcanti, 2000).
From the above, it is possible to state that LF
power, HF power and the LF/HF ratio do not
provide reliable figures on the ANS activity and
sympathovagal balance (Parati et al., 1995). These
arguments suggest that the HRV has limited value to
characterize the autonomic system role on the
cardiovascular regulation (Chen and Mukkamala,
2008). To obtain indexes that may better
characterize the autonomic cardiovascular
regulation, additional physiological data have been
used (Chen and Mukkamala, 2008). Pulse
photopletismography waveform (PPG) and
respiratory flow waveform (RFW) may provide
valuable clinical information to overcome HRV
limitations.
This work describes a portable device that
acquires ECG, PPG and RFW that are transmitted to
a computer by radio-frequency. The device
portability makes it suitable for application in
different clinical scenarios. Examples of clinical
recordings using the developed system are
presented.
363
Giassi Junior P., Fernando Refosco Baggio J., Moraes R. and Gonçalves de Oliveira M..
WIRELESS DEVICE FOR NONINVASIVE RECORDINGS OF CARDIO-RESPIRATORY SIGNALS.
DOI: 10.5220/0003158803630367
In Proceedings of the International Conference on Biomedical Electronics and Devices (BIODEVICES-2011), pages 363-367
ISBN: 978-989-8425-37-9
Copyright
c
2011 SCITEPRESS (Science and Technology Publications, Lda.)

2 SYSTEM DESCRIPTION
The developed system consist of a portable
electronic device and software for Windows® OS.
The device samples ECG, PPG and RFW that are
sent to a notebook. Software presents the acquired
signals on the screen and records them into the hard
disk in real time.
2.1 Hardware
The portable device has transducers and circuits to
acquire, process and transmit the physiological
signals to the notebook. It can be divided in three
parts: acquisition and conditioning unit, control unit
and communication interface unit.
The acquisition and conditioning circuits process
ECG, PPG and RFW signals. In order to prevent
data loss due to movement artifacts or poor skin-
electrode contact, ECG from 2 leads are acquired
and recorded. Connected to the ECG lead wires,
there are passive first order low pass (LP) RC filters
with cut-off frequency (f
c
) of 8 kHz to attenuate
electromagnetic interference (EMI). The next stage
consists of an instrumentation amplifier (IA) AD620
(Analog Devices) with a gain (G) of 100. The
amplified ECG is applied to a Butterworth band-pass
filter ranging from 0.5 to 100 Hz that was built by
cascading a first order high-pass (HP) and a third
order LP filters. It removes half-cell potential and
attenuates interfering signals such as EMG. The
ECG signal is further amplified (gain from 10 to 15
adjusted by a potentiometer) and added to DC offset
(1.25V). The conditioned ECG ranges from 0 to
2.5V, being within the dynamic range of the analog
to digital converter (ADC). The circuits described
above were implemented with the operational
amplifier TLC2254 (Texas Instruments) that has low
power consumption (35µA typical). Figure 1 shows
the block diagram of the ECG amplifier.
For the PPG acquisition, the circuit shown in
Figure 2 was assembled. An infrared light emitting
diode (LED) with the wavelength of 850 nm
(SFH4252 - OSRAM) and a photodiode (OPT101 –
Burr-Brown) are placed on opposite faces of the
subject’s finger to measure the light attenuation
produced by the blood perfusion and other tissues.
Figure 1: Block diagram of the ECG circuit, containing
low-pass (LP) filters, instrumentation amplifier (IA), high
pass (HP) filter, baseline displacement (Σ), sample-and-
hold (S/H) and analog to digital converter (ADC).
The electric current supplied to the LED is
controlled by a potentiometer in order to adjust the
signal intensity for each individual. A LP filter
(f
c
=10Hz) avoids noise interference. The PPG
generated by the light attenuation has low (related to
skin absorption, sensor displacement and long-term
changes of the mean arterial blood pressure) and
high frequency components (associated to finger
blood volume changes during the heart beat). To get
the blood volume curve (PPG-AC) with a better
resolution, a HP filter (f
c
=0.8 Hz) attenuates the DC
component of the PPG. This allows the components
of higher frequency to be amplified by an adjustable
gain (G) in the next stage without saturation. A LP
filter (f
c
=10Hz) removes noise of higher frequencies
and an offset of 1.25 V is added to the signal to fit
its amplitude to the ADC range.
RFW is obtained with a circuit based on thermal
anemometry (Figure 3). A Wheatstone bridge
contains a heated (70° C) glass sealed bead NTC
thermistor (QTMB-16C3 - Quality Thermistor). The
thermistor is placed ahead of the volunteer nostril.
When there is no air flow, the bridge is balanced and
its output is 0V. The breathing cools the NTC,
changing its resistance and the bridge balance. The
power supplied to maintain the NTC temperature
constant is an indirect measurement of the RFW.
As for the ECG amplifier, passive first order LP
RC filters (f
c
= 8 kHz) removes the EMI. The bridge
output is amplified by an IA (AD620), with an
adjustable gain G, and applied to the transistor base
that controls the emitter voltage supplied to the
bridge. The emitter voltage, proportional to the
square root of the flow velocity, is also amplified
and filtered by a LP anti-aliasing filter (f
c
=6 Hz).
1.25V offset is added to the signal to make its range
compatible to the ADC input.
After their amplification and filtering, the five
signals are simultaneously acquired by a sample-
and-hold IC (SMP-04) at a frequency of 1 kHz. A
microcontroller (ADuC841) that has an ADC built-
in converts the signals, one by one, to a 12 bits
word. It carries out the conversion in 8 µs with a
voltage resolution of 0.61mV (1LSB =2.5 V/4096).
Figure 2: The PPG waveform is sampled by two different
channels. One acquires the whole PPG waveform; the
other attenuates the DC component to allow further
amplification that improves the resolution of the higher
frequency components.
BIODEVICES 2011 - International Conference on Biomedical Electronics and Devices
364

Figure 3: Respiratory flow waveform circuit.
The wireless data transmission is carried out by a
Bluetooth module (v1.2 Protocol - KC11 ––
KCWireFree) that receives the sampled data from
the microcontroller serial port. The data transmission
occurs in the bypass mode at rate of 115 kbps,
reaching the Bluetooth receiver module connected to
the notebook USB up to a distance of 100m.
2.2 Software
Software for the notebook was developed in C++
programming language for Windows® OS.
To establish the wireless communication, it is
firstly necessary to run a Windows application that
makes the Bluetooth modules (portable device and
computer) to recognize each other and creates a
virtual serial port COMx to be accessed by the
acquisition software. The software main window
allows the user to select the virtual serial port to
receive the data. The received waveforms are plotted
and stored in real time. Since Borland C++ Builder
graphic libraries are relatively slow for real time
applications, the PlotLab library (Mitov Software)
was used.
The instantaneous heart rate (IHR), calculated
from one of the ECG channels, are also shown on
the screen (beats per minute) during the signal
acquisition to better supervise the subjects’ clinical
state. Six windows simultaneously show the ECG1,
ECG2, IHR, PPG, PPG-AC and RFW (Figure 4).
Each channel is recorded into the hard disk in a
separated file using binary format (16 bits Intel
PCM). Subject’s data (name, age, height and
weight), as well as the date and the time of the
clinical trial, can be typed and stored along with the
signals.
3 EXPERIMENTAL TRIALS
This section describes the use of the developed
system during clinical trials to assess the effect of
SNS and PNS blockade on the HRV. These
experiments are being carried out in the Medical
School Hospital of the Federal University of Santa
Catarina/Brazil after being approved by its Research
Ethics Committee (Project 529/10). Written
informed consent was obtained from the subjects
who took part in the experiments.
Two ECG leads, PPG, PPG-AC and RFW are
recorded for each experimental setting. The
volunteers are divided in two groups. Initially, the
signals are recorded in supine and standing postures
for both groups. An interval of five minutes between
these measurements allows the hemodynamic
recovery of the subject. These data are used as
reference for the other measurements described
below. For the first group, intravenous bolus of
esmolol (3 mg/kg) is administered by an infusion
pump at consecutive intervals of 3 minutes, being
the HR observed. The procedure is repeated until the
HR stops dropping (β-sympathetic blockade).
Following that, the volunteer´s signals are again
recorded for the supine and standing postures. At
last, the subjects receive 0.03 mg/kg of atropine
(Jose and Taylor, 1969) to produce a total autonomic
blockade (double blockade) and their signals are
again recorded for the same two postures.
For the second group, the same protocol is
repeated, but with the drugs applied in reverse order.
Atropine is injected first, blocking vagal stimulus.
Afterwards, esmolol is administered to bring the
total autonomic blockade about. Throughout the
recordings, the respiratory activity is guided by a
metronome, following three breathing patterns. For
each experimental condition (control, β-sympathetic
or vagal blockade and total autonomic blockade), the
subjects are asked to breathe at the fixed rates of 12
and 15 breaths/min (respiratory frequency of 0.2 and
0.25 Hz, respectively) during two minutes (each
rate) and at a random rate, during six minutes. The
random breathing phase followed a Poisson
distribution with periods from 1 to 15 seconds, mean
of 5 s (Berger et al., 1989). The random breathing
protocol allows a better analysis of the autonomic
activity since the respiratory spectra broadens,
preventing the coupling between the respiratory
frequency and the HF or LF HRV components. The
metronome is an independent application software
Figure 4: Software main window during acquisition of
signals from a volunteer.
WIRELESS DEVICE FOR NONINVASIVE RECORDINGS OF CARDIO-RESPIRATORY SIGNALS
365
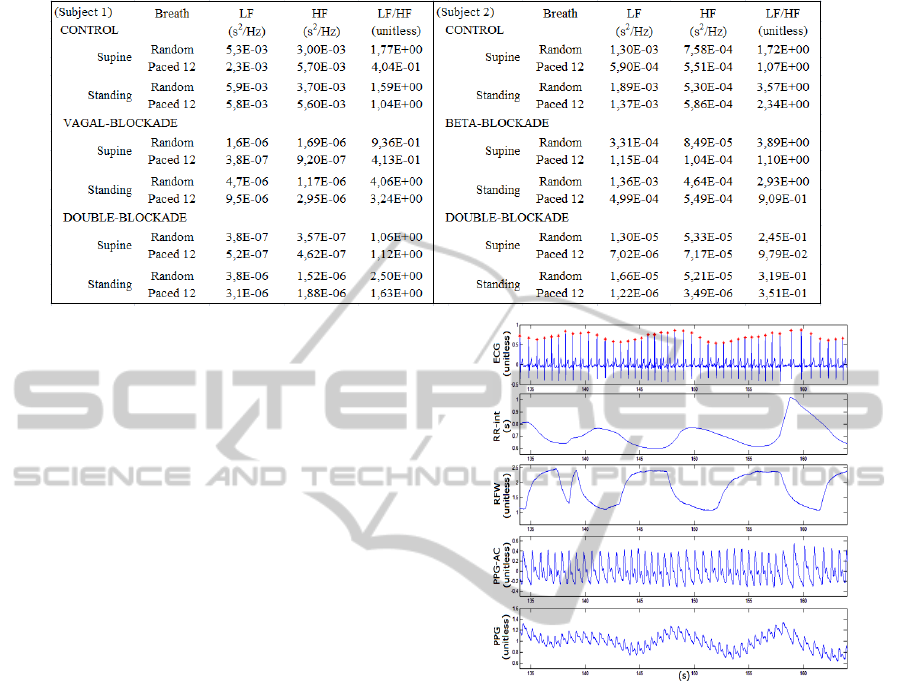
Table 1: Spectral power measurements of the HRV bandwidths for 2 subjects breathing at random rates.
that shows the respiratory patterns mentioned above
as sinusoidal waves on the screen that the volunteer
has to follow.
During the experiments, the subject’s arterial
pressure was acquired by a sphygmomanometer in
intervals of 3 minutes and annotated in another file.
Such measurements provide data to investigate the
role of the pressure on the HRV. These data will be
also used to investigate the relation of the pulse
wave transit time (PWTT), measured from the ECG
and PPG-AC, as an indirect measurement of the
instantaneous arterial pressure, as proposed in other
works (Lass et al., 2004).
3.1 Data Analysis
A typical recording segment of 30 seconds (Figure
5) shows one of the acquired ECG channels (lead
II), RR-interval, RFW, PPG-AC and PPG. The RR-
interval waveform was obtained by identifying the R
waves of the ECG (red dots) using algorithm based
on Ghaffari et al. (2008). Their fluctuations reveal
the breath modulation of the HR, that is, the
respiratory sinus arrhythmia (RSA). The RSA can be
better assessed by spectral analysis. The spectra of
the HRV and RFW waveforms were calculated for a
subject breathing at two different rates (0.2 Hz and
0.25 Hz) as shown in Figure 6. In this case, the HF
spectral peak shifts from one to the other breathing
rate. Therefore, if the subject reduces his breathing
rate, for instance, from 0.16 to 0.12Hz, the LF power
increases and the HF power decreases without
modification of the ANS activity.
To illustrate the effects of the ANS blockers,
spectral analysis of the HRV was carried out for a
subject. The LF, HF and LF/HF ratio data obtained
is shown on Table 1. The left column shows the
measurements for the first group subject; the right
column presents the measurements for the second
Figure 5: ECG, RR-interval, RFW, PPG-AC and PPG
time series. The red dots correspond to the R wave
detection used to calculate the instantaneous heart rate.
group subject. During vagal blockade, the HF power
decreased markedly, as expected. However, there is
difference between its values obtained during the
random or paced breathing since, for the second
case, the RSA is within the HF bandwidth. During
the double-blockade, the results are similar. On the
other hand, during the β-blockade, the LF power and
LF/HF ratio did not decrease, as one could expect,
not revealing sympathetic activity. These findings
confirm the drawbacks of such indexes.
4 DISCUSSION
The developed device has unique characteristics
since it simultaneously samples different
physiological signals that are usually acquired using
different equipments. Thus, cardio-respiratory
BIODEVICES 2011 - International Conference on Biomedical Electronics and Devices
366

signals can be registered without any cable
connection, reducing sources of artifacts and
providing mobility during the recordings. The
conditioning circuits demonstrated suitable gains for
the desired measurements and good immunity
against spurious interferences during recordings in
the Hospital. Two ECG leads are acquired by the
device to avoid data loss. In case of electrode
displacement or deterioration of the electrode-skin
interface, the RR interval can be still calculated
using the other lead. Concerning the transmission
distance, the Bluetooth connection proved to be
reliable (no data loss) over a range of 20 m even
with obstacles. The elimination of the cables besides
reducing artifacts, provides more comfort to the
subjects during the recordings.
Figure 6: Example of respiratory modulation of the HRV.
The breathing rate was increased from 0.2 Hz (a) to 0.25
Hz (b) as can be seen in the RFW spectrum. As result, the
HF peak of the HRV is also shifted in the RR spectrum.
The PPG signal provides information on the
long-term changes of the mean ABP that can be used
together with the PPG-AC to better estimate the
systolic and diastolic pressure in future researches.
The presented results are similar to the ones
obtained by Chen and Mukkamala (2008) who used
propranolol, a non-selective β blocker. Signals of
other volunteers are being acquired as described
above to set a data bank that will be used to
investigate indexes that may better characterize the
ANS activity.
5 CONCLUSIONS
A wireless non-invasive system for the recording of
cardio-respiratory signals was described. Due to its
portability, the system can be used in different
scenarios, being a valuable tool for research.
The synchronized recordings of ECG, RFW and
PPG allow a better assessment of the interactions
among cardio-respiratory variables and their effect
on the HRV.
Digital signal processing techniques and
mathematical modelling will be applied to the
acquired data to further investigate the
cardiovascular regulation by the ANS.
REFERENCES
Akselrod, S., Gordon, D., Madwed, L. B., Snidman, N. C.,
Shannon, D. C., Cohen, R. J., 1985. “Hemodynamic
regulation: investigation by spectral analysis”. Am J
Physiol Heart Circ Physiol, 249: H867–H875.
Berger, R. D.; Saul, J. P.; Cohen, R. J., 1989. “Assessment
of Autonomic Response by Broad-Band Respiration.
IEEE TRANSACTIONS ON BIOMEDICAL
ENGINEERING, vol. 36, n. II.
Brown, T. E., Beightol, L. A., Koh, J., Eckberg, D. L.,
1993. “Important influence of respiration on human R-
R interval power spectra is largely ignored”. J Appl
Physiol. Nov;75(5):2310-7.
Cavalcanti, S., 2000. “Arterial baroreflex influence on
heart rate variability: a mathematical model-based
analysis”. Med. Biol. Eng. Comput., 38, 189-197.
Chen, X., Mukkamala, R., 2008. “Selective quantification
of the cardiac sympathetic and parasympathetic
nervous systems by multisignal analysis of
cardiorespiratory variability”. Am J Physiol Heart Circ
Physiol. 294: H362-H371.
Ghaffari, A., Golbayani, H., Ghasemi, M., 2008. “A new
mathematical based QRS detector using continuous
wavelet transform”. Computers and Electrical
Engineering, v. 34, p. 81-91.
Jose, A. D., Taylor, R. R. 1969. “Autonomic blockade by
propranolol and atropine to study intrinsic myocardial
function in man”. The Journal of Clinical
Investigation. November; 48(11): 2019–2031.
Lass, J., Meigas, K., Karai, D., Kattai, R., Kaik, J.,
Rossmann, M. 2004. “Continuous blood pressure
monitoring during exercise using pulse wave transit
time measurement”. Proc. IEEE EMBS. Sept 1-5.
Parati, G., Saul, J. P., Di Rienzo, M., Mancia, G., 1995.
“Spectral analysis of blood pressure and heart rate
variability in evaluating cardiovascular regulation – A
critical appraisal”. Hypertension. 25:1276-1286.
Parati, G., Mancia, G., Rienzo, M. D., Castiglioni, P.,
Taylor, J. A., Studinger, P., 2006.
“Point:Counterpoint: Cardiovascular variability is/is
not an index of autonomic control of circulation”. J Ap
Phy,: 676–682.
TASK FORCE OF THE EUROPEAN SOCIETY OF
CARDIOLOGY AND THE NORTH AMERICAN
SOCIETY OF PACING AND
ELECTROPHYSIOLOGY, 1996. “Heart rate
variability: standards of measurement, physiological
interpretation, and clinical use.” Circ., 93:1043–1065.
WIRELESS DEVICE FOR NONINVASIVE RECORDINGS OF CARDIO-RESPIRATORY SIGNALS
367
