
AUTOMATIC SYSTEM FOR BLOOD TYPE CLASSIFICATION
USING IMAGE PROCESSING TECHNIQUES
Ana Ferraz, Vania Moreira, Diana Silva, Vítor Carvalho and Filomena O. Soares
Industrial Electronics Dept., University of Minho, Campus de Azurém, Azurém, Guimarães, Portugal
Keywords: Blood Types, Image Processing, IMAQ Vision.
Abstract: There is still not yet available a low-cost commercial equipment to determine blood types in an emergency
situation. This paper presents the development of a low cost system, based on image processing techniques,
that allows the automatic determination of human blood types in emergency situations. The experimental
method is based on the plate test where the serums specifics of blood types determination are mixed with
the sample blood of the donor. The mixtures blood/serums are captured through a CCD camera and
analyzed using the software IMAQ Vision from National Instruments. The developed image processing
methodology and the obtained results are detailed. The first prototype for automatic human blood
determination is presented.
1 INTRODUCTION
The determination of blood type can be performed
using various experimental tests (Datasheet of
Diamed, 2008) (Datasheet of Diamed-ID, 2008).
The plate test, used in this work, allows the
determination of blood type in a short time. It
consists of mixing the specific reagents of blood
type determination, with the patient blood. The
result depends on the occurrence or absence of
agglutination (Datasheet of Diamed, 2008). The
agglutination of erythrocytes is observed
macroscopically, in a short time, allowing using
image processing techniques to detect the
occurrence or absence of agglutination and therefore
the determination of the corresponding blood type.
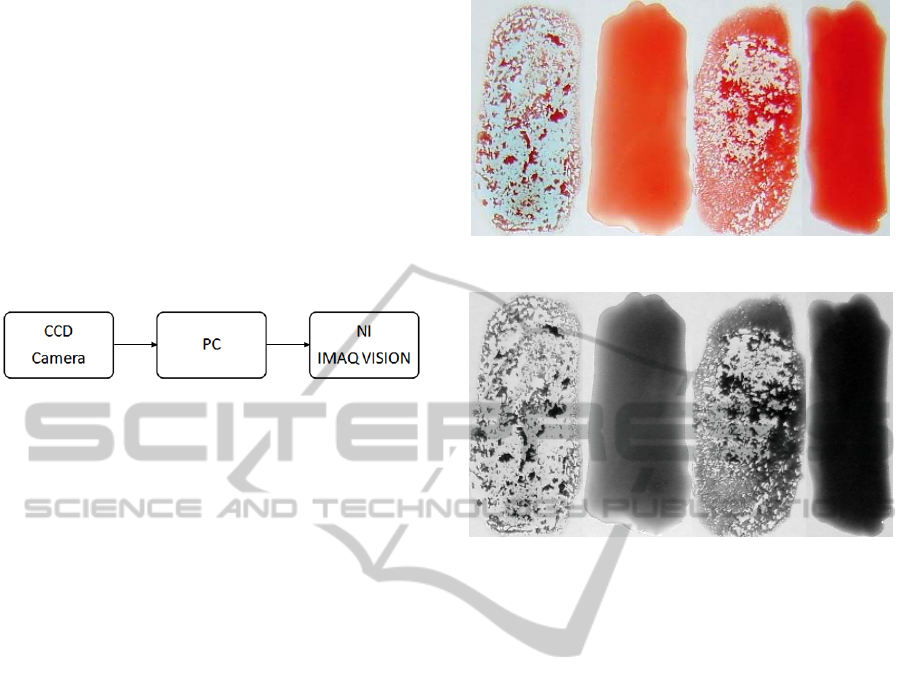
In Figure 1, it is presented an image that shows the
difference between the occurrence and absence of
agglutination.
Currently, for the determination of blood types it
is required human intervention, not only in
performing the analytical procedures, as well as in
reading and interpreting the results, being then the
process more susceptible to errors (Alexander,
2007). With the aim to fulfil that gap and to
automate the determination of blood types, some
devices were developed (Alexander, 2007)
(Anthony, 2005) (Lambert, 2005). However, they
have high costs and present some limitations
compared to the method proposed in this work.
Figure 1: (a) Occurrence of agglutination. (b) Absence of
agglutination.
Preliminary studies performed by the research
team allowed the development of a software tool
based on image processing techniques, able to detect
the occurrence of agglutination. However, the
methodology was not fully automatic, requiring the
users to select the image area to quantify (Ferraz,
Carvalho and Brandão, 2008) (Ferraz, Carvalho and
Brandão, 2010). In this sense, this paper presents a
new system to automatically determine the blood
type. The methodology presented in this work is
innovative and at low-cost, being an added value to
commercial solutions.
a)
b
)
368
Ferraz A., Moreira V., Silva D., Carvalho V. and O. Soares F..
AUTOMATIC SYSTEM FOR BLOOD TYPE CLASSIFICATION USING IMAGE PROCESSING TECHNIQUES.
DOI: 10.5220/0003159003680373
In Proceedings of the International Conference on Biomedical Electronics and Devices (BIODEVICES-2011), pages 368-373
ISBN: 978-989-8425-37-9
Copyright
c
2011 SCITEPRESS (Science and Technology Publications, Lda.)
2 IMAGE ACQUISITION
PROCESS
As the reaction of agglutination is macroscopically
visible, the sample images were captured in real
size, using a CCD camera (Sony Cyber-shot DSC-
S750) with 7.2 megapixel resolution.
To analyze the acquired images, an image
processing application was developed using the
IMAQ Vision software from National Instruments
(IMAQ, 2004). Figure 2 shows the schematic of the
designed system.
Figure 2: Designed system schematic.
3 DEVELOPED SOFTWARE
The software application developed is presented in
this section, where it is detailed each image
processing technique employed. For each step (3.1
to 3.10), it is shown the effect that the applied
technique has in the former image, using IMAQ
Vision software.
3.1 Image Buffer: Add Copy (1)
Stores a copy of the original image with the four
samples (mixed blood/serum) in Buffer # 1 of the
image buffer for later use, Figure 3. Final results will
be overlaid on this image (IMAQ, 2004) (Klinger,
2003) (Relf, 2003).
As the original image will suffer a series of
changes, later there is a need for the original image,
this function allows saving the original image.
3.2 Color Plane Extraction: RGB
Green Plane
Allows extracting the green plane from an RGB
image, Figure 4 (
IMAQ, 2004) (Klinger, 2003) (Relf,
2003).
The original image is a RGB image that must be
processed to allow the determination of the
occurrence of agglutination.
Figure 3: Original image.
Figure 4: Image resultant from applying the Color Plane
Extraction: RGB Green Plane function.
3.3 Filters: Convolution Highlight
Details
The convolution filter highlights the regions in the
image where there are sharp changes in pixel values.
These regions correspond to the boundaries of the
samples and other noisy pixels that may be present
in the image. The convolution kernel highlights the
edges of an image and in this case, the function uses
a 3 x 3 kernel (IMAQ, 2004) (Klinger, 2003) (Relf,
2003).
The next function is a threshold function that is
used to separate certain structures of the image. In
this case, it is used to separate the samples
blood/serum of the background, once this function
segments the image in two regions, designated
region “particle” and “region background” (IMAQ,
2004) (Klinger, 2003) (Relf, 2003).
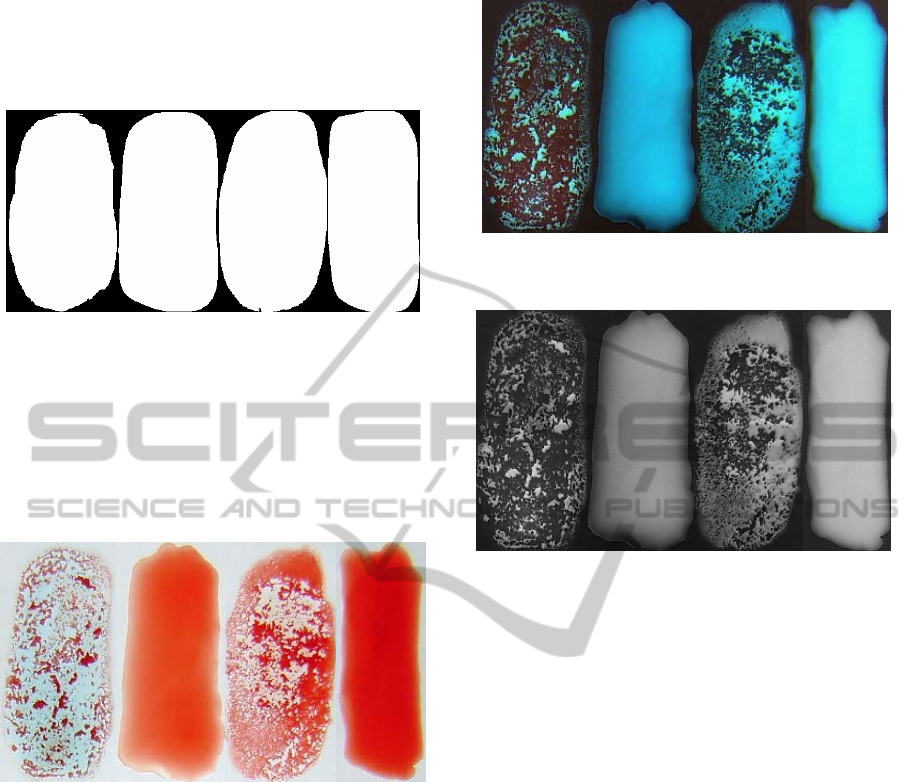
3.4 Threshold
This function applies a threshold to the image
resulting of previous function based on the
Minimum and Maximum threshold values
introduced. All pixels that are not contained between
the Minimum and Maximum values are set to 0 and
all pixels that fall inside the range are replaced by 1
AUTOMATIC SYSTEM FOR BLOOD TYPE CLASSIFICATION USING IMAGE PROCESSING TECHNIQUES
369

(IMAQ, 2004) (Klinger, 2003) (Relf, 2003). In this
function the Minimum value is 128 and the
Maximum value is 255.
The Minimum and Maximum threshold values
were determined by trial and error, when developing
the algorithm, and were kept constant afterwards.
The result of applying this function is presented in
Figure 5.
Figure 5: Image resultant from applying the Manual
Threshold.
This function is then combined with the Local
Threshold: Niblack function,, allowing isolating the
particles corresponding to the mixed blood and
serum.
3.5 Local Threshold: Niblack
Calculates a threshold value for each pixel based on
the statistics of the surrounding pixels. This
algorithm compensates the high lighting variations.
This function uses a kernel; in this case the kernel
size is 115 width and 132 height (
IMAQ, 2004)
(
Klinger, 2003) (Relf, 2003).
Using the previous feature to define the borders
in the image to isolate particles, results in the image
shown in Figure 6.
Figure 6: Image obtained by applying the Local
Threshold: Niblack function to Figure 5.
3.6 Adv. Morphology: Fill Holes
Fills all the holes that are present in the particles.
Holes are filled with a pixel value of 1. The resulting
binary image contains entire particles, without holes,
corresponding to the samples blood/serum (IMAQ,
2004) (Klinger, 2003) (Relf, 2003).
3.7 Adv. Morphology: Remove Small
Objects
This function removes the small particles and the
possible noise in the binary image resulting from the
previous function. It eliminates particles that are not
relevant to the analysis. The particles that are
removed by an iteration of erosion are assumed to be
noisy particles (IMAQ, 2004) (Klinger, 2003) (Relf,
2003).
This function is used to eliminate the small
particles that can interfere in the analysis of the
image. Small drops of blood or serum in the
background of the image are not relevant to the
analysis, and should be therefore removed.
3.8 Adv. Morphology: Remove Border
Objects
It eliminates particles that are at the border of the
image. It removes particles that are not needed for
the analysis of the image, preventing interference
from unwanted particles (IMAQ, 2004) (Klinger,
2003) (Relf, 2003).
This step is necessary to eliminate particles that
are joined together due to high kernel placed in the
Local Threshold: Niblack function, but in fact
should be separated.
3.9 Particle Analysis
This step is particles corresponding to each mixture
blood/serum. These necessary to analyze the
properties of the particles in the image, considered
as four particles can be analyzed using various
properties, being the determination of the center of
mass the most important in this work (IMAQ, 2004)
(Klinger, 2003) (Relf, 2003). This function is
essential because it defines a coordinate system and
the region to analyze.
The result of the previous function is a table that
contains the properties selected and their values. The
values of Center of Mass X and the Center of Mass
Y will be used in the following function.
BIODEVICES 2011 - International Conference on Biomedical Electronics and Devices
370
3.10 Threshold
As described in 3.4.The result of this function is
presented in Figure 7.
Figure 7: Image obtained by applying the Manual
Threshold function.
3.11 Image Buffer: Retrieve Buffer # 1
It retrieves the copy of the original color image, so
that it can be used by the next function. The original
image has the four samples blood/serum, Figure 8
(IMAQ, 2004) (Klinger, 2003) (Relf, 2003).
Figure 8: Image obtained by applying the Image Buffer:
Retrieve Buffer function in the image of Figure 7.
3.12 Color Operators: Not Or
This step performs a logical OR operation between
the original image input image and the original
image stored in the buffer. This is a bit-wise
operation (IMAQ, 2004) (Klinger, 2003) (Relf,
2003). The result of this function is presented in the
image of Figure 9.
3.13 Color Plane Extraction: HSL
Luminance Plane
This function is used to extract the luminance plane
from the color image obtained with the previous
function (IMAQ, 2004) (Klinger, 2003) (Relf,
2003), Figure 10.
Figure 9: Image obtained by applying the Color Operators:
Not Or function in the image of Figure 8.
Figure 10: Image obtained by applying the: HSL
Luminance Plane function in the image of Figure 9.
3.14 Set Coordinate System
This function defines a coordinate system based on
the stage of particle analysis. The particle analysis
function gives the coordinates necessary to calculate
the center of mass, used in this function. Chosen the
mode horizontal and vertical motion because it
allows adjusting the region of interest positions
along the horizontal and vertical axes (IMAQ, 2004)
(Klinger, 2003) (Relf, 2003).
The definition of the region of interest is an
important task in this method. Based on the
coordinate system, it is selected the region to be
analyzed, depending of the center of mass of the
particle calculated through the particle analysis
function.
This function will be repeated for each of the
particles in analysis. In this case, it will be repeated
four times, one for each blood/serum sample.
3.15 Quantify
It measures the intensity of the pixels in the region
of interest selected, Figure 11. This step uses the
Reposition Region of Interest that when enabled, it
dynamically repositions the region of interest based
on the coordinate system previously defined. Also, it
AUTOMATIC SYSTEM FOR BLOOD TYPE CLASSIFICATION USING IMAGE PROCESSING TECHNIQUES
371
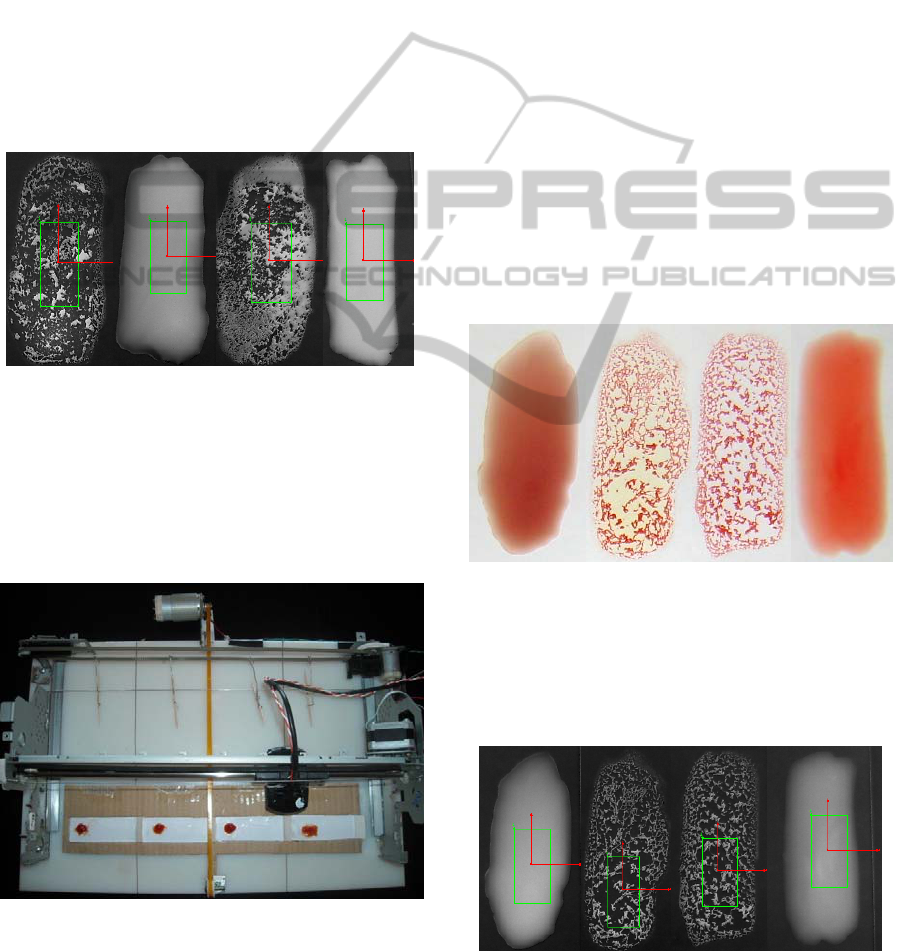
uses the Reference Coordinate System that indicates
the coordinate system to link the region of interest
(IMAQ, 2004) (Klinger, 2003) (Relf, 2003).
The result of the application of this function
consists of a table that contains the area (percentage
of the analyzed surface in relation to the complete
image), the mean value (mean value of the pixels),
the standard deviation (standard deviation of the
pixels) and the minimum and maximum values of
the pixels (IMAQ, 2004) (Klinger, 2003) (Relf,
2003).
This function allows identifying the occurrence
of agglutination in a sample blood/serum based on
the standard deviation value of the pixels.
As in the previous function, this step is repeated
for each of the particles in analysis.
Figure 11: Result of applying the Quantify function.
4 SYSTEM PROTOTYPE
A prototype system that automatically determines
the human blood type, based on the plate test
procedure, was designed (Figure 12).
Figure 12: Prototype developed.
The blood and the four serums drops are
manually placed in the plates inserted in the mobile
drawer, actuated by a DC motor. In the first blade, it
is placed reagent anti-A, in the second reagent anti-
B, in the third anti-AB reagent and finally in the
fourth, reagent anti-D, in accordance to the testing
procedure previously described.
The system is switched on and the drawer moves
to the mixing area, where the mixture blood/serum is
promoted in each blade. It must be referred that
there is no contamination between the four samples.
Next, the drawer moves to the image capture zone.
A step motor moves a Glossy 5 Mega pixels webcam
along the samples for capturing the four images. The
images are saved for future analysis. The system is
controlled by Arduíno microcontroller
(http://www.arduino.cc/).
5 RESULTS
The proposed methodology was tested with several
standard blood types samples. In this section, are
presented the results obtained when applying the
image processing methodology to four blood/serum
samples of a donor blood type, Figure 13.
Figure 13: Blood/serum samples. (a) Serum Anti-A. (b)
Serum Anti-B. (c) Serum Anti-AB. (d) Serum Anti-D.
Figure 14 shows the final images obtained with
the application of image processing techniques to the
original sample images of Figure 13. The
corresponding quantification is presented in Table 1.
Figure 14: Image resulting from application of the image
processing techniques developed, to images of Figure 13.
(
b)
c)
d)
(
a)
(
b)
a) b)
c)
d)
b)
BIODEVICES 2011 - International Conference on Biomedical Electronics and Devices
372
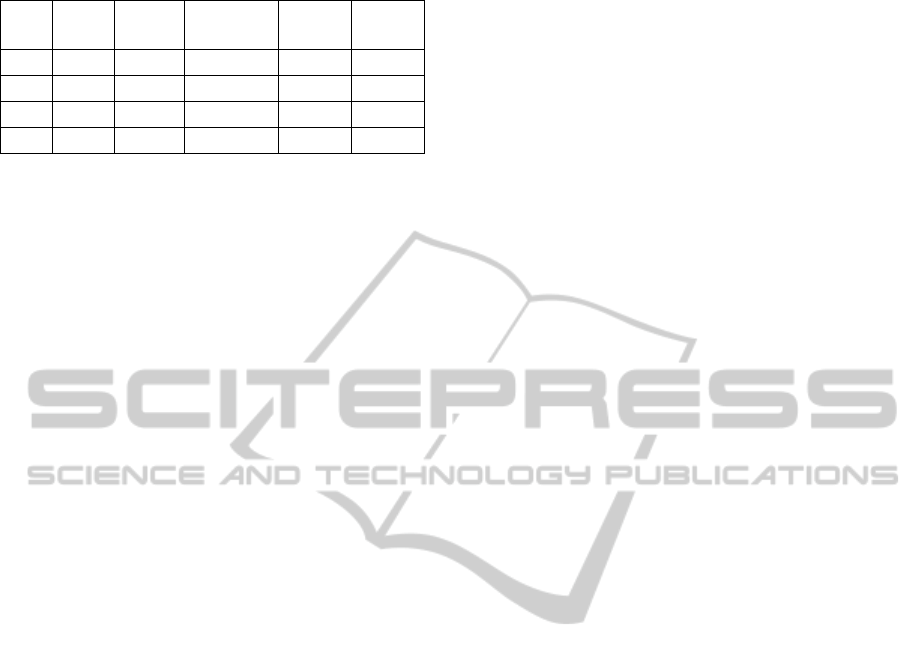
Table 1: Results of quantification of images of Figure 14.
Fig. Area Mean
Value
Standard
Variation
Min
Value
Max
Value
(a) 0,9 162,1 7,7 137,0 181,0
(b) 0,8 56,9 45,1 5,0 201,0
(c) 0,9 62,2 42,7 9,0 199,0
(d) 0,8 146,0 8,8 109,0 173,0
Analyzing Figure 14, it is observed that the
agglutination occurred in images (b) and (c), but not
in images (a) and (d). By correlating this information
with the information from Table 1, it is observed
that the standard deviation, in the images (b) and (c)
is well above 16, while in the images (a) and (d),
the standard deviation is less than 16. The value 16
for the standard deviation is a limit established for
determining the occurrence of agglutination in a
sample. This value was established from trial and
error. Thus, it is observed that when agglutination
occurs, the standard deviation is much higher than
the one obtained when agglutination does not occur,
allowing thus identifying the occurrence of
agglutination and consequently identifying the blood
type of a patient. In this example, given that the
agglutination has occurred in the presence of serum
anti-B (Figure 14-b) and in the presence of serum
anti-AB (Figure 14-d), the blood type presented is B
negative. Note that the agglutination occurs in the
presence of serum anti-AB, because the patient had
B antigens in their red blood cells that agglutinated
in the presence of anti-B antibodies existing in
serum. However, the serum anti-AB, also had anti-A
antibodies, that have not reacted because the patient
did not have A antigens, justifying the slightly less
value of agglutination (42.7), compared to that
obtained with serum anti-B (45.1).
4 CONCLUSIONS AND FUTURE
WORK
With the proposed system, based on image
processing techniques, it is possible to automatically
determine the blood type of a patient, by detecting
the occurrence of blood agglutination. This approach
allows the determination of blood type of a patient,
safely, and it can be used in emergency situations as
the results are obtained within a short time (2
minutes). The PC hardware requisites of the
prototype are minimal and IMAQ software package
allows the correct and fast determination of blood
types.
In future, we intend to optimize the prototype,
reducing human intervention in the procedures.
Another objective is to ensure that the developed
device is portable, allowing its use near the patient,
avoiding travel to the lab that only cause more time
consuming.
REFERENCES
Datasheet of Diamed AG,1785 Cressiers/Morat, Cressier,
2008.
Datasheet of Diamed-ID Micro Typing System, Card-ID.
Diaclon ABO\Rh for patients. Cressier, 2008.
Alexander, S. P., 2007. An Integrated Microoptical
Microfluidic Device for Agglutination Detection and
Blood Typing [Master Thesis]. California: University
of North of Carolina.
Anthony, S. R., 2005. A Simplified Visible/Near-Infrared
Spectrophotometric Approach to Blood Typing for
Automated Transfusion Safety [Master´s thesis].
California: University of North Carolina.
Lambert, J. B., 2005. A Miniaturized Device for Blood
Typing Using a Simplified Spectrophotometric
Approach [Master´s thesis]. California: University of
North Carolina.
Ferraz, A., Carvalho, V., Brandão, P., 2008. Determinação
Automática do Tipo Sanguíneo de Humanos
Utilizando Técnicas de Processamento de Imagem,
CBIS 2008. Bazil: São Paulo.
Ferraz, A., Carvalho, V., Brandão, P., 2010. Automatic
Determination of Human Blood Types using Image
Processing Techniques, BIODEVICES 2010. Spain:
Valencia.
IMAQ, 2004. IMAQ Vision Concepts Manual, National
Instruments, Austin.
Klinger, T., 2003. Image Processing with LabVIEW and
IMAQ Vision, Prentice Hall. New Jersey.
Relf, C. G., 2003. Image Acquisition and Processing with
LabVIEW, CRC Press.
AUTOMATIC SYSTEM FOR BLOOD TYPE CLASSIFICATION USING IMAGE PROCESSING TECHNIQUES
373
