A NEW AND EFFICIENT VESSEL SEGMENTATION METHOD
FROM COLOR RETINAL IMAGES
Alauddin Bhuiyan
1,2
, Ryo Kawasaki
1
, Ecosse Lamoureux
1,3
, Kotagiri Ramamohanarao
2
and
Tien Y. Wong
1,3
1
Centre for Eye Research Australia, Royal Victorian Eye and Ear Hospital
The University of Melbourne, Melbourne, Australia
2
Department of Computer Science and Software Engineering, The University of Melbourne, Melbourne, Australia
3
Singapore Eye Research Institute, National University of Singapore, Kent Ridge, Singapore
Keywords:
Retinal image, Vessel segmentation, Canny edge detection, Gaussian smoothing, Region growing technique,
Edge profiling.
Abstract:
Retinal blood vessel changes (e.g., vessel caliber) are important indicators for earlier diagnosis of cardiovas-
cular diseases. To quantify the changes automatically, a reliable vessel detection is essential. However, blood
vessel detection in retinal image is complicated by a huge variation in a number of factors such as local con-
trast, vessel width and vessel central reflex. In this paper, we propose a new technique to detect retinal blood
vessels which is able to address these issues. The core of the technique is a new vessel edge selection method
which combines the method of finding edge pattern and edge profiling techniques. Experimental results show
that 92.40% success rate in the identification of vessel start-points and 88.73% success rate in tracking the
major vessels.
1 INTRODUCTION
Recent research suggests that retinal vessel caliber
changes can be a predictive factor for cardiovascular
diseases (CVDs) which result in a large number of
deaths in developed and developing countries every
year. According to world health statistics, every year
about 17.1 million people die from CVDs. The num-
ber is expected to increase to 23.4 million by 2030
(World-Health-Statistics, 2008) due to increases of
obesity and aged population. Studies show that reti-
nal arteriolar narrowing is independently associated
with risk of stroke (Wong et al., 2001), heart disease
(Wong et al., 2002a), diabetes (Wong et al., 2002b)
and hypertension (Wong et al., 2004b). Earlier di-
agnosis of these diseases is possible through periodic
screening which can significantly reduce the risk of
disease severity and consequently, decrease the num-
ber of deaths and other complications. Blood vessel
detection is the first step for determining vessel width
and analyzing the generalized narrowing of retinal
blood vessels.
Although a large number of algorithms (Youssif
et al., 2008),(Al-Diri et al., 2009),(Martinez-Perez et
al., 2007),(Lam and Yan, 2008),(Sofka and Stewart,
2006) have been proposed for the detection of blood
vessels, a huge improvement in detection procedures
remains a necessity for the detection of vessels in the
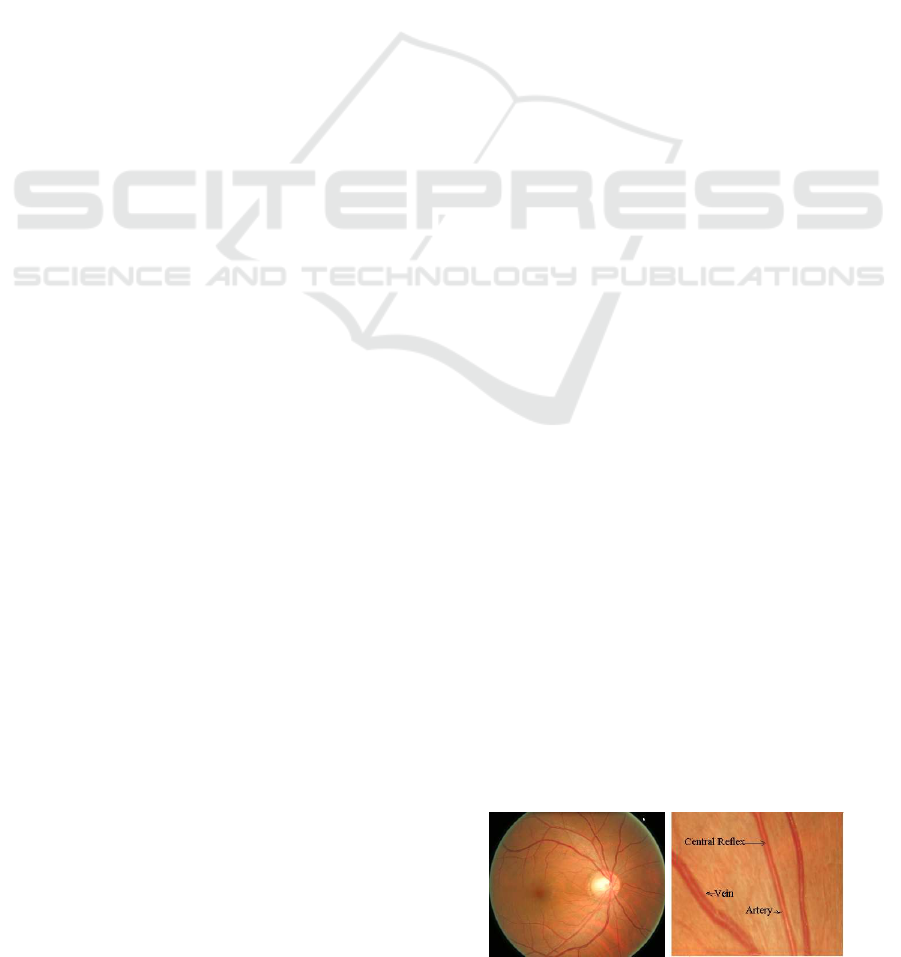
presence of central reflex (Figure 1) and poor contrast
images. Specifically, these techniques need further
improvement to address vessel detection accurately
with the presence of vessel central reflex. The central
reflex is a bright strip running down the center which
causes a complicated intensity cross-section. Locally,
this may be hard to distinguish from two side-by-
side vessels and has been discussed previously in
(Sofka and Stewart, 2006). In this paper, we pro-
pose a novel method for vessel segmentation which
addresses these challenges in retinal image modality.
Our paper is a further improvement on the existing
vessel detection algorithm in the presence of vessel
central reflex.
(a) (b)
Figure 1: A retinal image (a) and cropped image showing
the retinal artery, vein and the central reflex (b).
467
Bhuiyan A., Kawasaki R., Lamoureux E., Ramamohanarao K. and Y. Wong T..
A NEW AND EFFICIENT VESSEL SEGMENTATION METHOD FROM COLOR RETINAL IMAGES.
DOI: 10.5220/0003161404670471
In Proceedings of the International Conference on Bio-inspired Systems and Signal Processing (BIOSIGNALS-2011), pages 467-471
ISBN: 978-989-8425-35-5
Copyright
c
2011 SCITEPRESS (Science and Technology Publications, Lda.)
The rest of the paper is organized as follows. Sec-
tion 2 describes our proposed vessel segmentation
method which includes the edge detection, edge re-
construction, edge profiling and filtering, and finally,
vessel identification. Section 3 provides the Experi-
mental Results and Discussion. Conclusion and fu-
ture research directions are drawn in section 4.
2 THE PROPOSED METHOD
We have proposed a method for vessel detection
through edge tracking which is reported in (Bhuiyan
et al., 2010). In this paper, we further improved the
method by applying canny edge detection, edge re-
construction and edge profiling method. In our pro-
posed method, blood vessels are extracted based on
edge tracking and vessel morphological information.
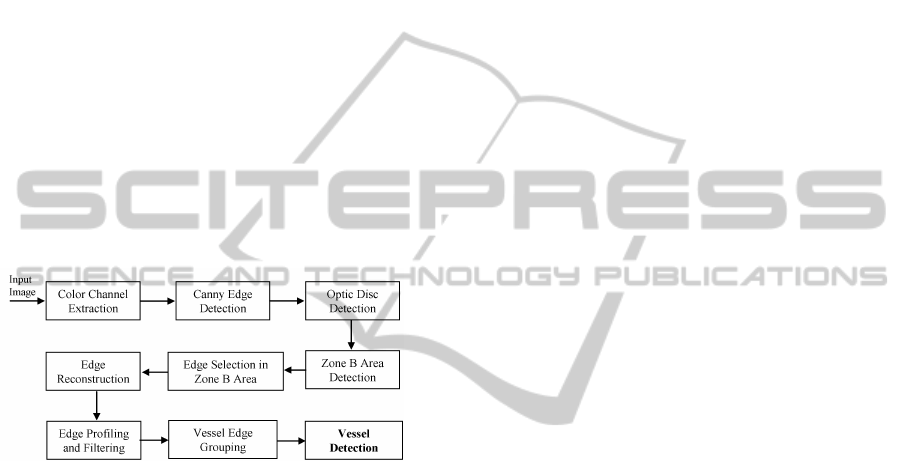
The overall method for vessel detection is shown in
Figure 2.
Figure 2: The overall method of retinal blood vessel detec-
tion.
2.1 Edge Detection
As our ultimate focus is on the measurement of vessel
caliber which requires vessel edge information, there-
fore, we apply edge based vessel segmentation ap-
proach. To detect vessel edges, we apply Canny edge
detection algorithm (Canny, 1986). We mentioned
that retinal image contrast varies hugely in image lo-
cal position. For this type of scenario, we consider
Canny edge detection algorithm to mark as many real
edges in the image as possible. We consider retinal
Green channel image which has the highest contrast
between vessel and background for all three color
channels in an RGB image. To remove impulse noise
and other abrupt artifacts from the Green channel im-
age, we apply Median filtering and then apply canny
edge detection algorithm. This approach allows us to
achieve better results for edge detection.
We note that our main focus is to detect the ves-
sel from zone B area, from which the vessel caliber
is computed and the original Central Retinal Artery
Equivalent (CRAE) and Central Retinal Vein Equiv-
alent (CRVE) formulae are derived (Hubbard et al.,
1999). Therefore, we aim to trace the vessels from the
zone B area only. Zone B is the circular region which
starts at 1*OD-diameterand ends at 1.5*OD-diameter
from the OD-center in the retinal image and signif-
icantly used for retinal blood vessel analysis (Wong
et al., 2004). The zone B area is computed based on
optic disc (OD) center and its radius. We have devel-
oped an OD detection and center computation method
which is reported in (Bhuiyan et al, 2009).
2.2 Edge Tracking from Zone B Area
Once we compute the zone B area, we track the in-
dividual edges for profiling and filtering to find the
actual vessel edges. From the zone B area, we scan
the canny edge detected image and track each of the
individual edges and corresponding pixels by region
growing technique (Gonzalez and Woods, 2008).
2.3 Edge Reconstruction
Because of the central reflex properties it may be pos-
sible that a central reflex edge merge with a vessel
edge (Figure 3) or with another central reflex edge.
This situation will create noisy profile for a real ves-
sel edge. In order to overcome this situation, once
we trace the edges individually, we check if there is
any edge which merges with another edge. We check
each edge if there is any junction point (which is a
merging point of 3 edge-segments) within the edge
points. Once we recognize this instance, we map the
vessel segments for this point. We measure the slope
of the segments locally by considering this point and
another short distance point in each of the segments.
From this, we select the two edge segments which
have the closest slope and discard the other segment.
2.4 Edge Profiling
The edge profiling method filters out the noise and
backgrounds, and selects the edges which have more
likelihood of vessel edges. The method checks the
intensity levels on both sides of an edge within a spe-
cific direction. For this, each of the edge pixels is con-
sidered to obtain two pixels’ positions (on both sides
of the edge pixel) which are located at a certain nor-
mal distance from the edge pixel. For this, each pixel
along with its neighboring pixel in the edge are con-
sidered as the line end-points. The slope and actual
direction of the line are computed to find the points
on both sides of the current edge pixel. The method is
as follows.
BIOSIGNALS 2011 - International Conference on Bio-inspired Systems and Signal Processing
468

Let us consider the two end-points of the line are
(x
1
,y
1
) and (x
2
,y
2
), and the angle θ (actual angle in
the image) is computed from the slope and direction
of the line which are slope and direction. Let us as-
sume that (x
2
,y
2
) is the second end-point i.e., located
further from the OD compared to the first end point;
we find the value of θ as follows. If θ < 0 and if
y
2
≥ y
1
& x
2
≥ x
1
then θ = θ+ π. On the other hand,
if θ < 0 and if y
2
≤ y
1
& x
2
≤ x
1
then θ = θ + 2π.
If θ > 0 and if y
2
≥ y
1
& x
2
≤ x
1
then θ = θ + π.
Once the actual angle is computed, the point located
on left side of the edge point (x
2
,y
2
) is computed as:
((y
2
− r ∗ sin(θ + π/2)),(x
2
+ r ∗ cos(θ + π/2)) and
the point on right side of the edge point is: ((y
2
− r∗
sin(θ+3π/2)),(x
2
+r∗cos(θ+3π/2)) where r is the
normal distance from the point (x
2
,y
2
).
After computing the pixel positions on both sides
of each of the edge points, the intensity levels for
these position in the image are obtained. For this,
we consider the Green channel image after Gaus-
sian smoothing (Gonzalez and Woods, 2008). Usual
vessel edge profile is high-to-low for the outside-to-
inside pixels’ intensity levels and low-to-high for the
inside-to-outside pixels’ intensity levels. For blood
vessels, this profile is consistent, whereas for noise,
this profile is random. Therefore, the consistent pro-
file value for each of the potential edges is considered
for filtering the true vessel edges and for discarding
the noisy edges. Figure 3 shows the traced edges and
the edges obtained from edge profiling method.
2.5 Potential Vessel Edge and Position
Identification
After profiling the edges the length of an edge is also
computed to check if it passes a certain threshold
value for a vessel edge. Then an edge is defined as the
first edge of a vessel if it returns the profile value for
high-to-low. Similarly, the edge is defined as the sec-
ond edge if the profile value is low-to-high. Following
this, we check if there is any disjointed edge by ex-
tending the edge based on extrapolation into a cer-
tain distance. To control the direction of the exten-
sion points, the edge slope is computed by local edge
points through the edge end point and another point
within 5 pixel distance from it. We merge the edges
once the edge type matches. Following this, we sort
the edge position to combine the edges as vessel edge.
The edge positions are sorted based on angular posi-
tion of each of the edges around the OD. We consider
the OD center and edge start point (closer end point
of the edge from OD) to compute the angle. Based on
the position we consider each of the edges to merge
as vessel edge.
(a)
(b)
Figure 3: Image showing the detected edges of noise and
central reflexes (left), and detected actual edges after profil-
ing (right).
2.6 Vessel Identification and Centerline
Detection
For merging the vessel edges we check the sorted
edges and consider the first edge and second edge in
a sequence and within a certain distance. Generally,
after applying the edge detection, two edges are ob-
tained for any blood vessel if there is no central reflex.
If there is a central reflex in the vessel, it may be two
or three or four edges based on the intensity levels of
the central reflex edges. We consider this information
for merging edges into blood vessels.
In general, the central reflex is approximately 1/3
of the vessel width (Kaushik et al., 2007). Consider-
ing this, we merge the edge labeled as first and sec-
ond edge if there is no other first or second or first-
second combination within approximately same dis-
tance. The distance is measured as the Euclidian dis-
tance between the two edge start-points. If we have
first-first-second combination of the edges, we check
the overall distance between the first and last edge,
and between the middle and last edge. If the condi-
tions satisfy the edges to be part of a vessel, we de-
fine the edges belong to an individual vessel. Similar
approach is applied for first-second-second combina-
tion. For the first-second-first-second combination we
check all the distances; the first first-second pair, the
second first-second pair, the second-first (i.e., the sec-
ond and third edge which is the width of the central
reflex) and the first and last edge pair (i.e., the width
of that cross-section). If these distances satisfy the
vessel edge-central reflex properties, we define these
as a single vessel. Otherwise, the first first-second
A NEW AND EFFICIENT VESSEL SEGMENTATION METHOD FROM COLOR RETINAL IMAGES
469
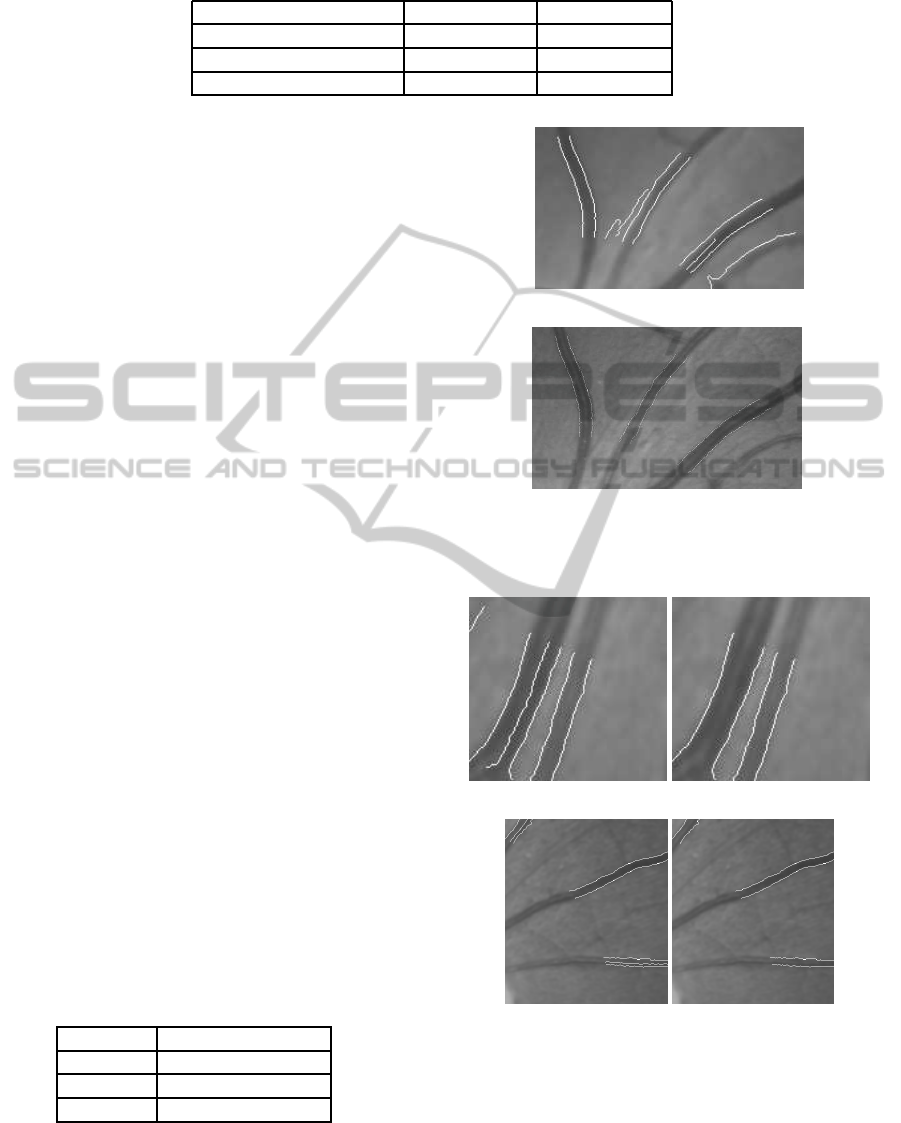
Table 1: Results of edge start-point detection.
Large Vessels Small Vessels
Total Number (manual) 292 164
Automatic Detection 270 116
Accuracy 92.47% 70.73%
edge pair is defined as one vessel and the second first-
second starts to compute the next vessel edge merging
process. Figure 4 and 5 shows the output images for
vessel detection in different circumstances. Once we
define the vessel and its edges we then track the cen-
terline from averaging the edge-pixels’ locations.
3 EXPERIMENTAL RESULTS
AND DISCUSSION
We analyzed fifteen retinal images obtained from the
Singapore Malay Eye Study (SiMES) dataset (Wong
et al., 2004c) which are randomly selected by reti-
nal image graders and applied our method to pro-
duce the output images indicating the detected ves-
sels. Each image size of 2048x3072 was taken from
using a digital non-mydriatic retinal camera (Canon
CR-DGi with a 10D SLR backing). It has taken ap-
proximately 8.47 seconds on MATLAB 7.8 to pro-
duce each output image on a 2.53 GHz Pentium(R) 4
CPU with 3.2 GB of RAM. Experimental results of
the accuracy of starting point detection are shown in
Table 1. Large vessels are defined as those vessels
which are more than 45 µm in diameter. We note that
we compute the vessel diameter in microns by consid-
ering the distance between the pixels in microns (from
calibrating the camera). After computing the vessel
diameter in microns, those vessels with diameter less
than 45 µm are defined as small vessels and are ig-
nored for the CVD prediction (Hubbard et al., 1999).
We observe that vessel start-point detection accuracy
is 92.47% for large vessels and overall vessel start-
point (i.e., both major and minor) detection accuracy
is 81.60%. Based on these start-points, overall large
vessel detection accuracy is 88.73% (Table 2).
Table 2: Results of Vessel Tracking.
Number of Vessels
Actual 142
Detected 126
Accuracy 88.73%
(a)
(b)
Figure 4: Image showing the detected edges with noise and
central reflexes (left), and detected vessels (right).
(a) (b)
(c) (d)
Figure 5: Cropped image showing detected vessel and cen-
tral reflex edges (a) and (c), and their corresponding de-
tected vessel images (b) and (d). Image showing correctly
detected vessels within the positions of two side-by-side
vessels with central reflexes (b).
BIOSIGNALS 2011 - International Conference on Bio-inspired Systems and Signal Processing
470

4 CONCLUSIONS AND FUTURE
WORK
In this paper, we discussed a novel method for de-
tection of blood vessels from color retinal images.
Our method is highly accurate in detecting blood ves-
sels with central reflex. The novelty of our method
lies in the detection of blood vessels with vessel and
central reflex edge tracking with varying contrast. A
user friendly interface is developed to select the miss-
ing start points and to identify the missing vessels
from which the width will be measured automatically.
Based on the method, we are in the process of devel-
oping a new technique for vessel width measurement.
The results for vessel width measurement and CVD
prediction model will be reported later.
ACKNOWLEDGEMENTS
The research has been supported by National Health
and Medical Research Council (NHMRC) Australia
development grant (2008).
REFERENCES
Al-Diri, B., Hunter, A., and Steel, D. (2009). An active
contour model for segmenting and measuring reti-
nal vessels. IEEE Transactions on Medical Imaging,
28(9):14881497.
Bhuiyan, A., Kawasaki, R., Lamoureux, E., Ramamoha-
narao, K., and Wong, T. Y. (2010). Vessel segmen-
tation from color retinal images with varying contrast
and central reflex properties. Proceedings of the In-
ternational Conference on Digital Image Computing:
Techniques and Applications (DICTA), pages 16.
Bhuiyan, A., Kawasaki, R., Wong, T. Y., and Kotagiri, R.
(2009). A new and efficient method for automatic op-
tic disc detection using geomatrical features. In the
proceedings of World Congress on Medical Physics
and Biomedical Engineering (IFMBE Proceedings),
25/IV:11311134.
Canny, J. (1986). A computational approach to edge de-
tection. IEEE Trans. Pattern Analysis and Machine
Intelligence, 8(6):679698.
Gonzalez, R. C. and Woods, R. E. (2008). Digital Image
Processing. Pearson Prentice Hall, third edition.
Hubbard, L. D., Brothers, R. J., King, W. N., Clegg, L.
X., Klein, R., Cooper, L. S., Sharrett, A. R., Davis,
M. D., and cai, J. W. (1999). Methods for evaluation
of retinal microvascular abnormalities associated with
hypertension/ sclerosis in the atherosclerosis risk in
commuties study. Ophthalmology, 106:22692280.
Kaushik, S., Tan, A. G., Mitchell, P., andWang, J. J. (2007).
Prevalence and associations of enhanced retinal arte-
riolar light reflex a new look at an old sign. Ophthal-
mology, 114:113120.
Lam, B. S. Y. and Yan, H. (2008). A novel vessel segmen-
tation algorithm for pathological retinal images based
on the divergence of vector fields. IEEE Transactions
on Medical Imaging, 27(2):237246.
Martinez-Perez, M. E., Hughes, A. D., Thom, S. A.,
Bharath, A. A., and Parker, K. H. (2007). Segmen-
tation of blood vessels from red free and fluorscein
retinal images. Medical Image Analysis, 21:4761.
Sofka, M. and Stewart, C. V. (2006). Retinal vessel center-
line extraction using multiscale matched filters, confi-
dence and edge measures. IEEE Transactions on Med-
ical Imaging, 25(12):15311546.
Wong, T. Y., Klein, R., Couper, D. J., Cooper, L. S., Sha-
har, E., Hubbard, L., Wofford, M. R., and Sharrett, A.
R.(2001). Retinal microvascular abnormalities and in-
cident stroke: the atherosclerosis risk in communities
study. Lancet, 358(9288):11341140.
Wong, T. Y., Klein, R., Sharrett, A. R., Duncan, B. B.,
Couper, D. J., Cooper, L. S., Tielsch, J. M., Klein,
B. E., and Hubbard, L. D. (2002a). Retinal arteriolar
narrowing and risk of coronary heart disease in men
and women: The atherosclerosis risk in communities
study. Journal of the American Medical Association,
287(9):11531159.
Wong, T. Y., Knudtson, M. D., Klein, R., Klein, B. E. K.,
Meuer, S. M., and Hubbard, L. D. (2004a). Comput-
erassisted measurement of retinal vessel diameter in
the beaver dam eye study. American Academy of Oph-
thalmology, 111:11831190.
Wong, T. Y., Ronald, K., Sharrett, A. R., Duncan, B. B.,
Couper, D. J., Klein, B. E. K., Hubbard, L. D., and
and, F. J. N. (2004b). Retinal arteriolar diameter and
risk for hypertension. Annals of Internal Medicine,
140:248255.
Wong, T. Y., Ronald, K., Sharrett, A. R., Duncan, B. B.,
Couper, D. J., Klein, B. E. K., Hubbard, L. D., and
Nieto, F. J. (2004c). Retinal arteriolar diameter and
risk for hypertension. Annals of Internal Medicine,
140:248255.
Wong, T. Y., Ronald, K., Sharrett, A. R., Schmidt, M. I.,
Pankow, J. S., Couper, D. J., Kleinand, B. E. K., Hub-
bard, L. D., and Duncan, B. B. (2002b). Retinal arte-
riolar narrowing and risk of diabetes mellitus in mid-
dleaged persons. Journal of the American Medical
Association, 287(19):252833.
World-Health-Statistics ((last accessed on 07 Septem-
ber, 2008)). Ten highlights in health statistics:
Part 1, page 23. http://www.who.int/whosis/whostat/
EN WHS08 Part1.pdf.
Youssif, A. A. A., Ghalwash, A. Z., and Ghoneim, A. A.
S. A. (2008). Optic disc detection from normalized
digital fundus images by means of a vessels direction
matched filter. IEEE Transactions on Medical Imag-
ing, 27(1):1118.
A NEW AND EFFICIENT VESSEL SEGMENTATION METHOD FROM COLOR RETINAL IMAGES
471
