
RETINAL VASCULAR NETWORK MODEL
An Automatic Approach
Alauddin Bhuiyan, Baikunth Nath and Kotagiri Ramamohanarao
Computer Science and Software Engineering, The University of Melbourne, Melbourne 3010, Australia
Keywords:
Vascular bifurcation/branching and crossover point, Binary tree, Invariant features, Tree traversal algorithm,
Disease prediction.
Abstract:
In this paper, we propose a retinal vascular network model, which is an automatic process of generating a
graph representation (i.e., a tree) of the retinal blood vessels and includes vessel geometrical features. It maps
the retinal blood vessels and can facilitate vascular features such as the vessel width, bifurcation angle, among
others to predict or earlier diagnose cardiovascular and related diseases. The proposed tree-model is based
on vessel’s centerline, cross-sectional width, and bifurcation, branching and crossover points. The optic disc
center is computed using the Hough transformation and vessel centerlines are tracked from out side its radius.
Blood vessels are fragmented as vessel-segments based on the bifurcation, branching and crossover points.
For each blood vessel we construct a binary tree which is linked in the root of the tree-model. Our automated
method achieves an accuracy of 91.23% in extracting the vessel-segments.
1 INTRODUCTION
Recent research suggests that retinal imaging can play
an important role in prediction or earlier diagnosis
of diseases. For example, research shows that reti-
nal vessel caliber changes are associated with hyper-
tension, diabetes and cardiovasculardiseases (CVDs).
Usually, the retina is analyzed by direct viewing or
a semi-automatic method. However, direct viewing
of the eye or the manual analysis of the retinal pho-
tographs is time-consuming and expensive as it re-
quires human effort. Semi-automatic method also re-
quires an expert intervention and significant amount
of time. Thus an automated image analysis should
play a central role in analyzing large volume of im-
ages.
An automatic method of mapping the retinal vas-
culature and corresponding features, with high accu-
racy, will greatly enhance the speed and significantly
reduce the costs involved in diagnosing diseases.
This paper presents a retinal vascular network model
(i.e., tree-model) to achieve these goals. Although a
number of schemes (Pinz et al., 1998),(Chow et al.,
2006),(Li and Qu, 1998),(Mattes et al., 1999) has
been proposed to represent image features in a tree
structure, none of these methods is concerned with
retinal vascular imaging. The tree-model is an auto-
mated method for mapping the blood vessels and cor-
responding features in a color retinal image. It repre-
sents the vascular features in a graph form shown in
Figure 1b. The features are incorporated in consider-
ation of their importance in the diagnosis of diabetes,
hypertension or cardiovascular diseases.
Several research articles (Lin et al., 2009), (Zhou
et al., 2005), (Martinez-Perez et al., 2002), (Taarn-
hoj et al., 2008), (Stanton et al., 1995), (Hart et al.,
1999) have appeared on retinal vascular feature anal-
ysis for disease diagnosis. Most of these techniques
are manual or semi-automatic, require expert inter-
vention and none of these techniques is based on a
graphical representation of the vascular features. In
(Martinez-Perez et al., 2002), the authors have pre-
sented a method which can trace an individual vessel
and summarize its features. Another method for ves-
sel tracing is presented in (Lin et al., 2009). None of
the methods obtain vascular features with maintain-
ing actual vessel-segments’ hierarchy. None of these
techniques is able to match the vascular features from
two images based on vessel-segments’ hierarchical
position, which is important for patient’s longitudinal
studies.
Previous methods of tree representations (Mat-
tes et al., 1999),(Li and Qu, 1998),(Mosorov,
2005),(Chow et al., 2006) mainly consider the global
higher level features (i.e., histogram) and segmented
regions as corresponding features of the images. For
233
Bhuiyan A., Nath B. and Kotagiri R..
RETINAL VASCULAR NETWORK MODEL - An Automatic Approach.
DOI: 10.5220/0003161602330238
In Proceedings of the International Conference on Bio-inspired Systems and Signal Processing (BIOSIGNALS-2011), pages 233-238
ISBN: 978-989-8425-35-5
Copyright
c
2011 SCITEPRESS (Science and Technology Publications, Lda.)
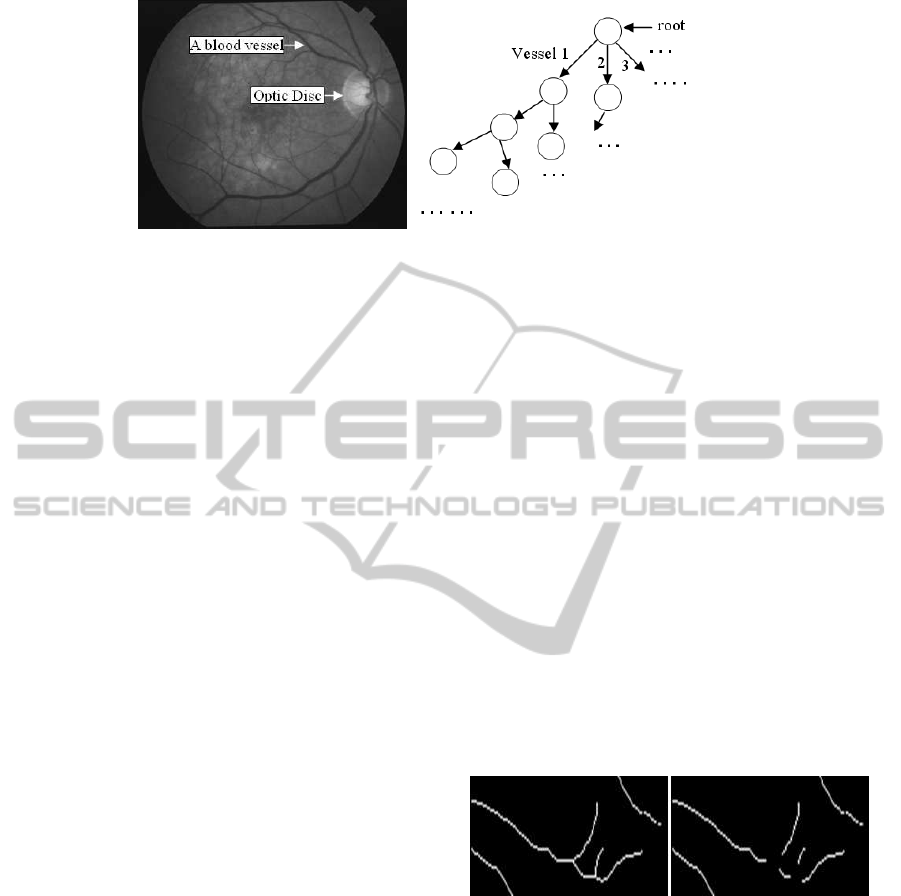
(a) (b)
Figure 1: A retinal image showing the blood vessels (a) and proposed graph model of the retinal vascular network (b).
instance, an image is represented with its histogram
on the root and the local region based features on
the children nodes of a tree, which is used for image
classification. None of these schemes consider a reti-
nal vascular network and its feature(s) representation
which is the main focus in our work.
The rest of the paper is organized as follows. Sec-
tion 2 provides the method of tree-model construc-
tion, and section 3 provides evaluation of the tree-
model. Conclusions are drawn in section 4.
2 TREE-MODEL
CONSTRUCTION
The tree-model is constructed by traversing through
the vessel centerline image. The details of the tree-
model construction procedureare described in the fol-
lowing subsections.
2.1 Vessel Centerline Detection
In (Bhuiyan et al., 2007a) a method is presented for
blood vessel segmentation based on the texture prop-
erty analysis of vessel and non vessel parts in the color
retinal image. Following this a morphological skele-
tonisation operation is applied on the segmented im-
age to extract the vessel centerlines.
2.2 Vessel Landmarks Classification
A method for blood vessel bifurcation, branching and
crossover point (landmark points) detection using the
vessel geometrical features is proposed in (Bhuiyan
et al., 2007b). Vessel centerline image and a width
measurement method (Bhuiyan et al., 2008) are used
for landmark points classification process.
2.3 Fragmenting Vessel Centerlines
We fragment the vessel centerlines into different
vessel-segments based on the landmark points and
use this fragmented centerline image to construct the
tree-model. This is for searching and traversing the
vessel centerlines as well as constructing the tree-
model conveniently. For fragmenting the vessel cen-
terlines, we use the landmark points along with the
corresponding vessel-segments’ start or end points.
The landmark points and their corresponding vessel-
segments’ start or end points are obtained from land-
mark points classification method (Bhuiyan et al.,
2007b). We compute the connectivity (i.e., the path)
between each landmark point and its corresponding
vessel-segment’s start or end points, and delete the
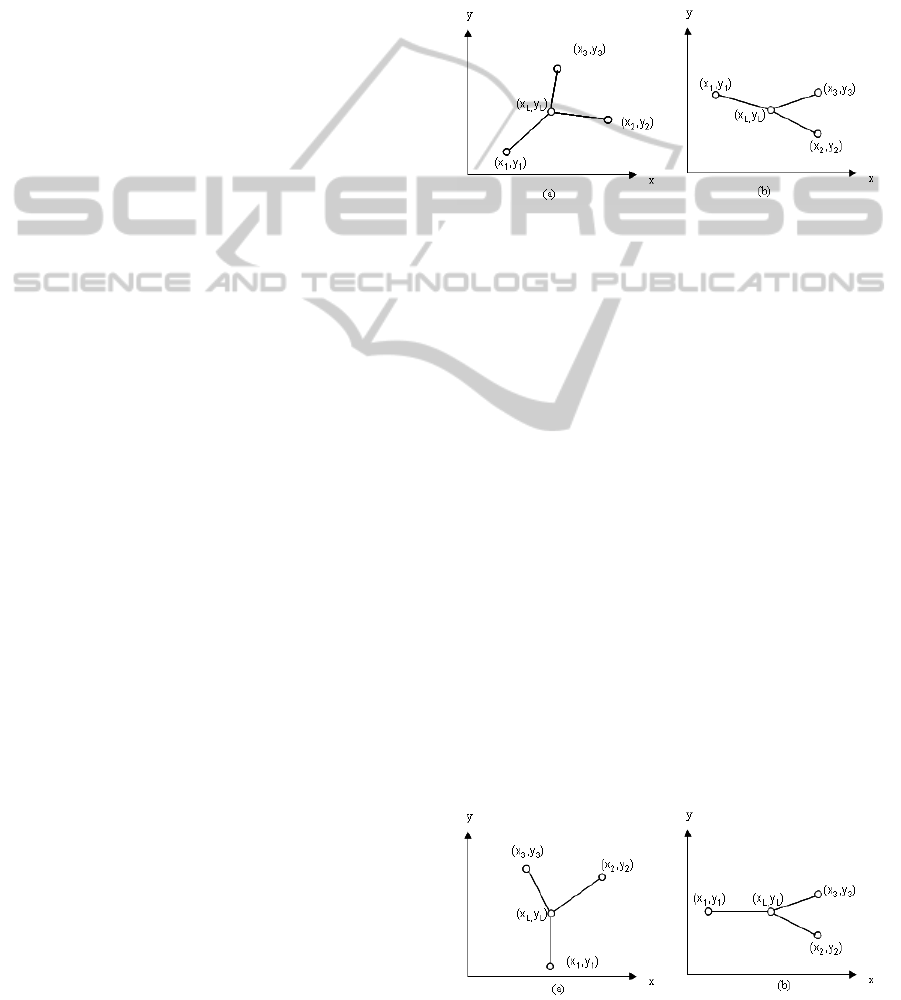
connectivity for fragmenting the centerlines. Figure
2 shows a cropped vessel centerline image (left) and
its fragmented output image (right).
Figure 2: A cropped vessel centerline image (left) and its
fragmented output image (right).
2.4 Optic Disc Center Computation
Optic disc center is computed by applying Hough
transformation on the optic disc region in the image.
To detect the optical disc, we find a rough estimation
of pixel positions by thresholding the retinal image on
intensity value. Then we determine a square region on
which we search for a circular object. Hence, we can
apply Hough transformation in a smaller region which
provides more efficiency in optic disc center compu-
tation. We apply Hough transformation in the edge
image which we obtained earlier.
BIOSIGNALS 2011 - International Conference on Bio-inspired Systems and Signal Processing
234
2.5 Binary Tree Construction
After computing the optic disc center and radius, we
find the vessel centerline pixels by searching in a cir-
cular region outside this radius. Once a vessel center-
line pixel is found, it is inserted into the root of the
tree-model and a binary tree construction starts for
this vessel. This starting pixel is considered for ini-
tiating the traversal process in the fragmented vessel
centerline image.
The traversal process uses the 3 × 3 connectiv-
ity mask to find the neighboring pixels in the vessel-
segment. The mask is applied by considering the
starting pixel of any vessel-segment as its center.
Once a neighboring pixel is found it replaces the pre-
vious one. Each time a pixel position is considered
a flag value is assigned so that this pixel is not con-
sidered for the next time. Once the traversal process
reaches the vessel-segment’s end point, it stops if it
belongs to a bifurcation or a branch. The features
of this vessel-segment are computed and inserted into
the corresponding node in the tree-model. Using this
vessel-segment’s end point we determine the starting
point of the daughter vessels and the landmark point.
After receiving the starting points, we classify their
corresponding vessel-segments as the left and right
children in the tree-model for the current parent. We
discuss this in the next section. The vessel-segment,
which is classified as a left child, is considered for
continuing the process. The right vessel-segment’sin-
formation is inserted into a stack and considered latter
for constructing the tree-model.
For crossover points we use flag values for the
end points. We determine the landmark point for
the current vessel-segment’s end point and find the
other vessel-segments’ start or end points. Then we
measure the slopes considering the line segments be-
tween the landmark and vessel segments’ start or
end points. The traversal process selects the vessel-
segment, which has the closest slope value to the cur-
rent vessel-segment.
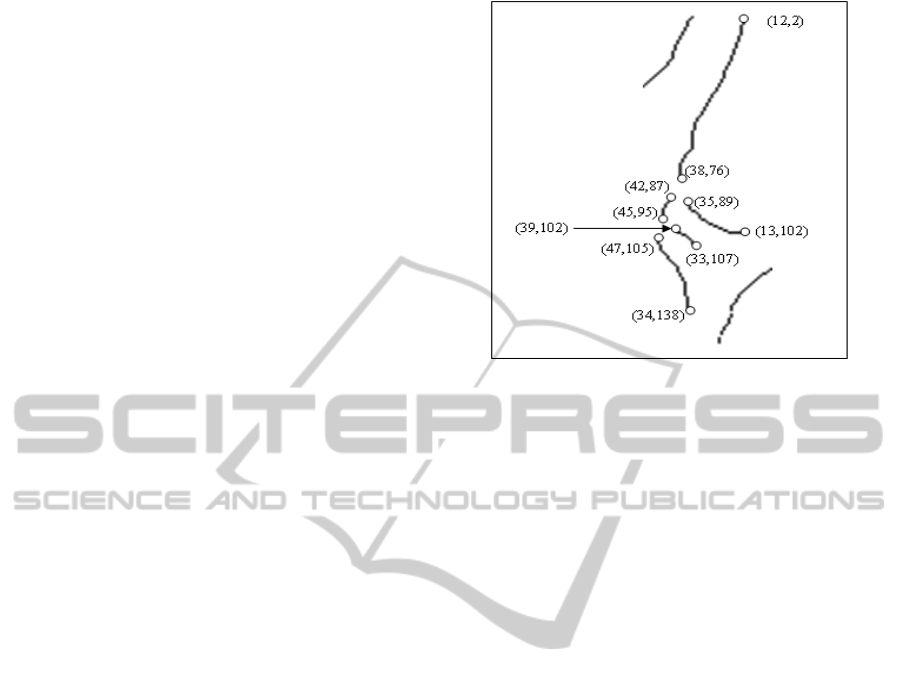
Determination of Left Child and Right Child in
the Tree-model
A vessel-segment is classified as the left or right child
in the tree-model, based on its starting point location
around the parent vessel. Let us consider Figure 3.
Assume that the end point returned by the traversal
process is (x
1
,y
1
). Using this end point, we determine
other two vessel-segments’ starting points (x
2
,y
2
) and
(x
3
,y
3
) along with the landmark point (x
L
,y
L
). From
these points, we can obtain the centerline equation as
follows
(x− x
1
)/(x
1
− x
L
) − (y− y
1
)/(y
1
− y
L
) = 0 (1)
We compute the slope of the line (i.e., vessel-
segment) as m = (y
1
− y
L
)/(x
1
− x
L
). We fit (x
2
,y
2
)
and (x
3
,y
3
) to the above line equation. If the slope
m > 0 (as in Figure 3(a)) and (x
2
,y
2
) returns a value
less than the value returned by (x
3
,y
3
) for the left
hand side in line equation (2), we assign (x
2
,y
2
) (i.e.,
its vessel-segment) as a left child in the tree-model,
otherwise it is a right child. If the slope m < 0 (as in
Figure 3(b)), the rules are opposite.
Figure 3: Vessel-segment appears with positive slope (a)
and negative slope (b).
If the centerline segment is parallel to x-axis or y-
axis (Figure 4) we find the positions (as left or right)
of these points as follows. If the vessel-segment is
parallel to y-axis (i.e., x
L
− x
1
= 0), at first we con-
sider if y
L
− y
1
> 0 (as in Figure 4(a)). In this case,
if x
2
> x
3
, (x
2
,y
2
) is on the left side. Otherwise it
is on the right side. If we invert the vessel direction
in Figure 4(a), i.e., y
L
− y
1
< 0, the rules are oppo-
site. Similar rules are applied for the vessel-segments
which are parallel to x-axis (Figure 4(b)).
Once we classify these vessel-segments starting
points as left and right children, we consider the left
child (i.e., vessel-segment) to be inserted into the tree-
model. The right child (i.e., starting point) is inserted
into a stack along with the address of its parent node
(to be considered latter). We implement the stack us-
ing a linked list so that it can handle essentially any
number of elements dynamically.
Each time the traversal algorithm returns a vessel-
segment’s end point, using this we search for the land-
mark point and starting points of the daughter vessel-
segments. If there is no start point, the traversal pro-
Figure 4: Vessel-segment appears as parallel to y-axis (a)
and x-axis (b).
RETINAL VASCULAR NETWORK MODEL - An Automatic Approach
235
cess is terminated. Then we compute the vascular fea-
tures for the current vessel-segment and insert them
into the corresponding node in the tree-model. Fol-
lowing that we access the stack for a vessel-segment’s
start point along with its parent address in the tree-
model. Then consider this vessel-segment for insert-
ing into the tree-model. If there is a start point of a
vessel-segment, we trace this vessel-segment and in-
sert its features into the corresponding node in the
tree-model. This process continues until the end of
the entire vessel or the stack is empty. Once a ves-
sel is considered for the tree-model, the binary tree
construction is started for the next vessel and so on.
2.6 Appending Vascular Features
The vascular features are added to each node, which
represents a vessel-segment. Each time a node is in-
serted, it also includes the corresponding vascular fea-
tures. Some vascular features require daughter vessel-
segments information. These are: ratio of trunk
width and branch width, acute angle between par-
ent and smaller daughter vessel, and bifurcation an-
gle. For these we need to consider the related vascu-
lar features for parent and daughter vessel-segments.
Therefore, a node includes only the features of the
same vessel-segment if it does not have any daughter
vessel-segments.
3 EVALUATION OF THE
TREE-MODEL
CONSTRUCTION
We evaluate our technique using two publicly avail-
able data sets with images of diseased retinas; the
STARE database (Hoover et al., 2000),(STARE-
project, 2006) and the DRIVE (Staal and Abramoff,
2004). We demonstrate the feature analysis using the
STARE database which has labeled images of dia-
betic and normal retinas. It took approximately 1.69
minutes using MATLAB version 7.5 to produce each
output tree-model on a 2.66 GHz Pentium 4 Duo CPU
with 3.25 GB of RAM. For evaluating our method, we
considered the vessel-segments’ hierarchy and posi-
tional information (i.e., daughter vessel as left or right
to the parent vessel) and observe if they are repre-
sented similarly in the tree-model.
For each image, we selected the starting point co-
ordinates of a vessel, i.e., actual starting position of
a vessel-segment (Figure 5). We observed the tree-
model to see if this point was assigned in the root.
Then we tracked the end point of that vessel-segment
Figure 5: A cropped vessel-segments with marked end
points.
and checked whether it is assigned to corresponding
binary tree of the tree-model or not (Table 1). Fol-
lowing that we considered the daughter vessels on the
labeled image and then checked the tree-model if they
are correctly assigned as left and right children nodes
in the corresponding binary tree. We continued this
process until the end of each vessel and stopped after
considering all the vessels in an image.
Table 2 shows the number of calculated vessel-
segments in a manually labeled image and the number
of vessel-segments that were represented by the cor-
responding binary tree in the tree-model. When the
number of vessel-segments were correctly inserted
into the corresponding binary tree in the tree-model, it
is true positive or agreed (column 4). The number of
vessel-segments that were missed in the correspond-
ing binary tree of the tree-model, shown as missed
(column 5). When a vessel-segment was inserted in
the binary tree of the tree-model but is not a part of
the binary tree (i.e., belong to another vessel) it is spu-
rious (column 6). After finding these segments for all
vessels we used the following formula to compute er-
ror in constructing the tree-model for an image.
Error = (Segments missed + Spurious seg-
ments)/(Total number of vessel-segments).
For each vessel the accuracy (1 − error) × 100 is
obtained in percentile. Then we measure the accuracy
of constructing the tree-model for an image by aver-
aging the accuracy of all the vessels. We considered
forty images (twenty from DRIVE and twenty from
STARE database) for evaluation process and achieved
an overallaccuracy of 91.23%. Table 3 shows the pro-
cess on five different images. We note that the con-
struction accuracy of the tree-model depends on the
segmentation of the blood vessel. If the segmentation
BIOSIGNALS 2011 - International Conference on Bio-inspired Systems and Signal Processing
236
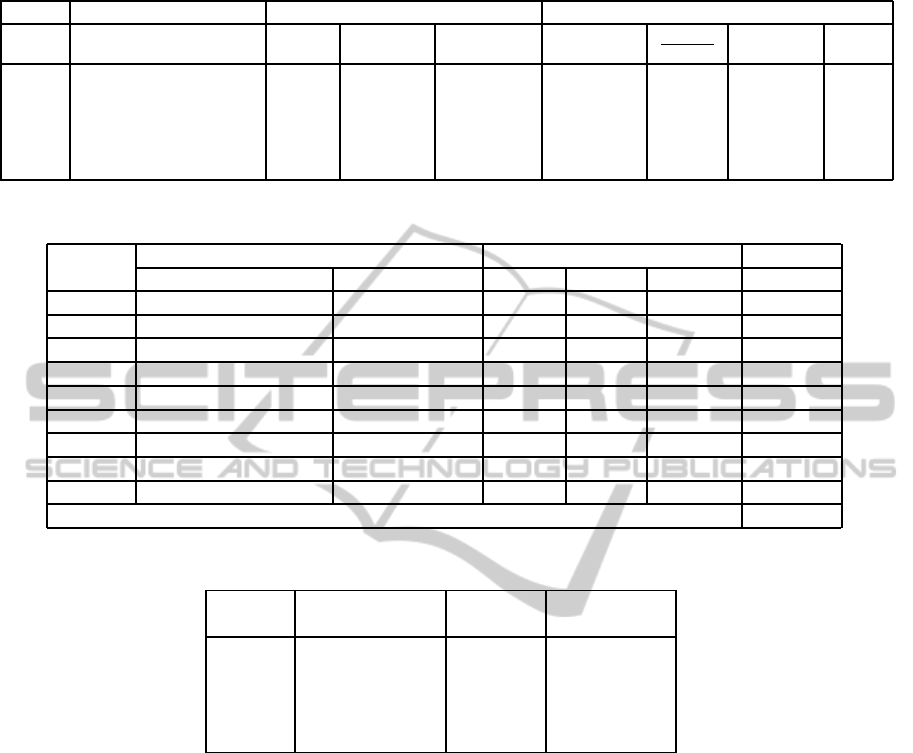
Table 1: A binary tree representation of a blood vessel with node values.
End Point Coordinate nodes Values
Index x y parent left child right child Tortuosity
W
2
2
+W
2
3
W
2
1
Bi Angle L/W
1 38 76 0 2 3 0.112 1.223 0.893 21.25
2 45 95 1 4 5 0.112 1.032 0.793 6.12
3 13 102 1 0 0 0.08 0 0 14.12
4 34 138 2 0 0 0.15 0 0 14.89
5 33 107 2 0 0 0.112 0 0 5.23
Table 2: The evaluation of tree-model for an image.
Vessel Tree-Model Construction Post Analysis Accuracy
Number Total Vessel-Segment Number in Tree Agreed Missed Spurious (%)
1 12 10 10 2 0 83.33
2 7 7 7 0 0 100
3 14 12 10 2 2 71.43
4 9 9 8 0 1 88.89
5 11 11 11 0 0 100
6 11 11 11 0 0 100
7 6 6 6 0 0 100
8 12 12 11 1 1 83.33
9 5 5 5 0 0 100
Average Accuracy 91.89
Table 3: Overall Accuracy on Tree-Model Construction.
Image Total Accuracy Average
Number Vessel-Segment (%) Accuracy(%)
1 80 91.89
2 67 92.98
3 79 90.05 91.44
4 82 89.29
5 73 93.01
method fails to obtain a minor vessel, the next process
fails to obtain the landmark point. Consequently, we
missed a node in the tree-model.
Among the vascular features, we evaluated the
width measurement accuracy against five different
graders and the results are reported in (Bhuiyan et al.,
2008). Further, the accuracy of bifurcation and
branching angle measurement along with landmark
classification are reported in (Bhuiyan et al., 2007b).
Blood vessel tortuosity is reported in (Bhuiyan et al.,
2010).
4 CONCLUSIONS
In this paper we proposed and evaluated a new
method for constructing a vascular network model
(the tree-model). We used the vessel centerline and
edge image and classified landmark points to con-
struct this tree-model. We computed vascular features
which are significant for disease diagnosis and pro-
vided an example of using the tree-model in disease
diagnosis.
The primary goal of our research is to facilitate
and access the vascular features efficiently by repre-
senting these in a graphical form. The medical practi-
tioners can access and analyze these vascular features
according to their requirements.
Our experimental results establish that the method
can be readily used in medical applications with high
accuracy. Further, we envisage that the tree-model
will be very efficient in finding the correspondingves-
sels for matching two images. In this tree structure,
each vessel segment can be searched with O(log n)
operations where n is the number of vessel-segments.
The proposed tree-model is based on the blood
vessel segmentation accuracy, and the tree-model is
achieving 91.23% construction accuracy. We are cur-
RETINAL VASCULAR NETWORK MODEL - An Automatic Approach
237

rently investigating various approaches to improve
our segmentation method based on texture, edge in-
formation and Markov random field. This should fur-
ther enhance the accuracy of the tree-model construc-
tion.
Our contributions in this paper are summarized
below:
• We proposed a new and efficient method to con-
struct a tree-model, which includes a number of
significant vascular invariant features.
• The tree-model is an automatic process to repre-
sent the vascular features and can readily be used
in feature analysis for earlier diagnosis of differ-
ent diseases.
REFERENCES
Bhuiyan, A., , Nath, B., Chua, J., and Ramamohanarao, K.
(2008). Vessel cross-sectional diameter measurement
on color retinal image. Communications in Computer
and Information Science, 25:214–227.
Bhuiyan, A., Nath, B., Chua, J., and Kotagiri, R. (2007a).
Blood vessel segmentation from color retinal images
using unsupervised classification. In the proceedings
of the IEEE International Conference of Image Pro-
cessing, pages 521–524.
Bhuiyan, A., Nath, B., Chua, J., and Ramamohanarao, K.
(2007b). Automatic detection of vascular bifurcations
and crossovers from color retinal fundus images. Pro-
ceedings of Third International IEEE Conference on
Signal-Image Technologies and Internet-Based Sys-
tem (SITIS), pages 711–718.
Bhuiyan, A., Nath, B., Ramamohanarao, K., Kawasaki, R.,
and Wong, T. Y. (2010). Automated analysis of retinal
vascular tortuosity on color retinal images. Journal of
Medical Systems, pages 1–15.
Chow, T. W. S., rahman, M. K. M., and Wu, S. (2006).
Content-based image retrieval by usingtree-structured
features and multi-layer self-organizing map. Pattern
Analysis and Applications, 9:1–20.
Hart, W. E., Goldbaum, M., Cote, B., paul Kube, and nel-
son, M. (1999). Measurement and classification of
retinal vascular tortuosity. International Journal of
Medical Informatics, 53:239–252.
Hoover, A., Kouznetsova, V., and Goldbaum, M. (2000).
Locating blood vessels in retinal images by piece-wise
threshold probing of a matched filter response. IEEE
Transactions on Medical Imaging, 19(3):203–210.
Li, X. and Qu, X. (1998). Matching spatial relations
using db-tree for image retrieval. Proceedings of
the International Conference on Pattern Recognition
(ICPR’98), 2:1230–1234.
Lin, K.-S., Tsai, C.-L., and Sofka, M. (2009). Vascu-
lar tree construction with anatomical realism for reti-
nal images. In the Proceedings of Ninth IEEE Inter-
national Conference on Bioinformatics and Bioengi-
neering, pages 313–318.
Martinez-Perez, M. E., Hughes, A. D., Stanton, V., Si-
mon A Thom, N. C., Bharath, A. A., and Parker,
K. H. (2002). Retinal vascular tree morphology: A
semi-automatic quantification. IEEE Transactions on
Biomedical Engineering, 49(8):912–917.
Mattes, J., Richard, M., and Demongeot, J. (1999). Tree
representation for image matching and object recogni-
tion. Proceedings of the 8th International Conference
on Discrete Geometry for Computer Imagery, LNCS
1568:298–309.
Mosorov, V. (2005). A main stem concept for image match-
ing. Pattern Recognition Letters, 26:1105–1117.
Pinz, A., Bernogger, S., Datlinger, P., and Kruger, A.
(1998). Mapping the human retina. IEEE Transac-
tions on Medical Imaging, 17:606–619.
Staal, J. and Abramoff, M. D. (2004). Ridge-based ves-
sel segmentation in color images of the retina. IEEE
Transactions on Medical Imaging, 23(4):501–509.
Stanton, A. V., Wasan, B., Cerutti, A., Ford, S., Marsh, R.,
Sever, P. P., Thom, S. A., and Hughes, A. D. (1995).
Vascular network changes in the retina with age and
hypertension. Journal of Hypertension, 13:1724–
1728.
STARE-project (2006). http://www.ces.clemson.edu/
∼ahoover/stare/. last accessed on 21 November.
Taarnhoj, N. C. B. B., Munch, I. C., Sander, B., Kessel, L.,
Hougaard, J. L., and Kyvik, K. (2008). Straight ver-
sus tortuous retinal arteries in relation to blood pres-
sure and genetics. British Journal of Ophthalmology,
92:1055–1060.
Zhou, P., Wang, M., and Cao, H. (2005). Research on fea-
tures of retinal images associated with hypertension
and diabetes. Proceedings of the 2005 IEEE Engineer-
ing in Medicine and Biology 27th Annual Conference,
pages 6415–6417.
BIOSIGNALS 2011 - International Conference on Bio-inspired Systems and Signal Processing
238
