
SINGULAR VALUE DECOMPOSITION (SVD) AND BLAST
Quite Different Methods Achieving Similar Results
Bráulio Roberto Gonçalves Marinho Couto
Centro Universitário de Belo Horizonte / UNI-BH, Av. Professor Mário Werneck 1685, Belo Horizonte, Brazil
Macelo Matos Santoro
Departamento de Bioquímica e Imunologia, UFMG, Av. Antonio Carlos 6627, Belo Horizonte, Brazil
Marcos Augusto dos Santos
Departamento de Ciência da Computação, UFMG, Av. Antonio Carlos 6627, Belo Horizonte, Brazil
Keywords: Genomics, Matrix analysis, BLAST, SVD.
Abstract: The dominant methods to search for relevant patterns in protein sequences are based on character-by-
character matching, performed by software known as BLAST. In this paper, sequences are recoded as p-
peptide frequency matrix that is reduced by singular value decomposition (SVD). The objective is to
evaluate the association between statistics used by BLAST and similarity metrics used by SVD (Euclidean
distance and cosine). We chose BLAST as a standard because this string-matching program is widely used
for nucleotide searching and protein databases. Three datasets were used: mitochondrial-gene sequences,
non-identical PDB sequences and a Swiss-Prot protein collection. We built scatter graphs and calculated
Spearman correlation (ρ) with metrics produced by BLAST and SVD. Euclidean distance was negatively
correlated with bit score (ρ>-0.6) and positively correlated with E value (ρ>+0.7). Cosine had negative
correlation with E value (ρ>-0.7) and positive correlation with bit score (ρ>+0.8). Besides, we made
agreement tests between SVD and BLAST in classifying protein families. For the mitochondrial gene
database, we achieved a kappa coefficient of 1.0. For the Swiss-Prot sample there is an agreement higher
than 80%. The fact that SVD has a strong correlation to BLAST results may represent a possible core
technique within a broader algorithm.
1 INTRODUCTION
Comparison of protein sequences is one of the most
fundamental issues in Bioinformatics. The dominant
methods of such analysis are based on character- by-
character matching, made by rapid but not very
sensitive algorithms with heuristics, known as
BLAST – the basic local alignment search tool
(Altschul et al., 1990). Even with good performance,
these methods still have difficulties, due to
computational complexity and other issues, as
problems with genetic recombination and genetic
shuffling (Vinga and Almeida, 2003). BLAST, for
example, is inherently subjective and highly
sensitive to the substitution matrix used in cut-off
points and applied gap penalties, that are difficult to
define and when altered, can produce conflicting
results (Krawetz and Womble, 2003) and even
“BLASTphemy” when users are unable to interpret
its results (Pertsemlidis and Fondon III, 2001).
Database redundancy, very common in a large
protein sequence collection, is another problem for
BLAST, slowing down searches and reducing the
significance of an alignment because of the linear
dependency of BLAST E value and the database size
(Holm and Sander, 1998).
Several methods for comparing sequences and
complete genomes, which do not explicitly use
comparisons of character-by-character, have been
proposed and successfully applied as alternative to
alignments approaches (Wu et al., 1992; Stuart et al.,
2002; Stuart & Berry, 2004; Yuan et al., 2005; Dong
189
Roberto Gonçalves Marinho Couto B., Matos Santoro M. and Augusto dos Santos M..
SINGULAR VALUE DECOMPOSITION (SVD) AND BLAST - Quite Different Methods Achieving Similar Results.
DOI: 10.5220/0003162301890195
In Proceedings of the International Conference on Bioinformatics Models, Methods and Algorithms (BIOINFORMATICS-2011), pages 189-195
ISBN: 978-989-8425-36-2
Copyright
c
2011 SCITEPRESS (Science and Technology Publications, Lda.)
et al., 2006; Teichert et. al, 2007; Liu et al., 2008;
Jun, S.R. et al., 2010). In this paper, proteins are
recoded as p-peptide frequency matrix that is
reduced by singular value decomposition (SVD), in
a latent semantic indexing information retrieval
system as described by Stuart (Stuart et al., 2002)
and adapted by Couto (Couto et al., 2007). We first
represented proteins as vectors and then calculated
sequences similarities using linear algebra methods.
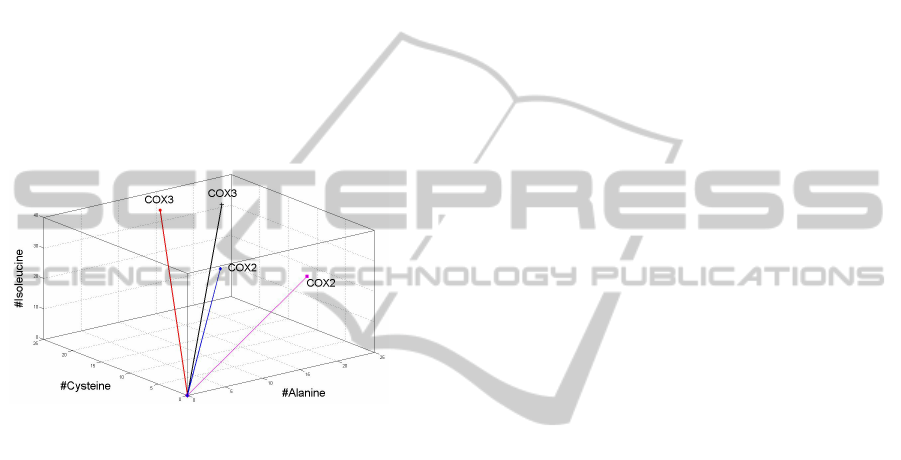
Figure 1 shows the simplest case where proteins
are represented as three-dimensional vectors (3D):
frequencies of Cystein, Alanine and Isoleucine are
used to recode mitochondrial genes for four species.
It is interesting to notice that protein vectors from
the same family (COX3 and COX2) point to the
same direction, which can be measured by the cosine
among the vector angles (Eldén, 2006).
Figure 1: Representation of proteins as three-dimensional
vectors.
The first objective here is to assess the
relationship among similarity metrics from SVD,
cosine and Euclidean distance, bit score and E value,
statistics used by BLAST. We applied a scatter
graph analysis and Spearman’s rank correlations
technique to do so (ρ). The second objective is to
verify if there is an agreement, when an unknown
sequence is classified or identified, among SVD
results and the “gold standard”, defined by the most
similar BLAST hit. This was made by analysis of
percent agreement, kappa coefficient, sensitivity,
specificity and ROC curve (Altman, 1991). We
chose BLAST as a standard because this string-
matching program “has become the single most
important piece of software in the field of
bioinformatics” and it is widely used for nucleotide
searching and protein databases (Korf et al., 2003).
According to Google, the first paper describing
BLAST (Altschul et al., 1990) was cited over 23,000
times (www.scholar.google.com).
2 SYSTEM AND METHODS
2.1 Programs and Datasets
Programs implemented for this analysis were written
in MATLAB (The Mathworks, 1996), using its
inbuilt functions (SVD, sparse matrix manipulation
subroutines etc). Three datasets were used in this
paper. The first evaluated database had 64 vertebrate
mitochondrial genomes composed of 832 proteins
from 13 known gene families (ATP6, ATP8, COX1,
COX2, COX3, CYTB, ND1, ND2, ND3, ND4,
ND4L, ND5 and ND6). This curated protein
database was downloaded from the online
information by Stuart et al. paper (Stuart et al.,
2002). The file "pdb_seqres.txt.gz", located in
http://bioserv.rpbs.jussieu.fr/PDB/, was the second
database. This file has 121,556 redundant protein
sequences from PDB (Protein Data Bank), which
was reduced to 37,561 non-identical sequences. A
randomly sample of 40,000 sequences from the
Swiss-Prot section of the Universal Protein Resource
(UniProt) was the third protein collection
(http://www.uniprot.org/downloads).
2.2 Vector Representation of Proteins
Before one can apply the linear algebra methods
used here, it is necessary to represent proteins as
vectors in a high-dimensional Euclidean space.
Firstly, we consider a bio molecular sequence as
a complex written language, so its analysis can be
very similar to that used by Information Retrieval
Systems, where large amounts of textual information
are organized, compared and categorized. In this
case, individual protein sequences correspond to
‘passage’ of text, whereas peptides of a given size
(p) serve as ‘words’ (Stuart et al., 2002). Hence,
sequences are recoded as p-peptide frequency values
using all possible overlapping p-peptides window.
With 20 amino-acids it is generated a 20
p
x n matrix,
where p is the word-size and n is the number of
proteins to be analyzed. In these matrices, proteins
are treated as documents and the p-peptides as terms,
which allow the problem to be solved by linear
algebra methods (Eldén, 2006).
The amino-acid word-size p that can be used to
build the p-peptide frequency matrix varies from one
to four. The utility of larger peptides is yet to be
explored, but to use 5 or more amino-acids can be
result in computational problems. With five amino-
acids the frequency matrix will be 3,200,000 rows,
most of that with zero. This structure is huge and
hard to handle. Besides computational issues, larger
BIOINFORMATICS 2011 - International Conference on Bioinformatics Models, Methods and Algorithms
190

peptides will lead to problem during the similarity
search step. According to Stuart (Stuart et al., 2002),
tripeptides may prove useful with highly diverged
sequences and tetrapeptides with highly related
proteins. On the other hand, larger peptides will
remain real undetected similarity, even between very
highly related proteins.
Representing proteins as frequency vectors of p-
peptides has the limitation that it does not consider
the occurrences order of p-peptides in the sequence.
Despite this possible ambiguity, several studies have
shown that this approach is surprisingly effective in
discriminatory analysis of protein sequences (Vinga
and Almeida, 2003). Anyway, before using this
protein vector representation, we made an analysis
of its ambiguity rate according to the number of
amino-acids (p) in the matrix of frequency protein-
peptide. We compared 26,675 non-identical proteins
longer than 100 amino-acids and selected from the
PDB dataset. To identify ambiguities during vector
recoding, we compared 355,764,475 sequences-
pairs. The percentage of ambiguity felt from about
4%, when used only one amino-acid in the matrix of
frequencies (p=1) to less than 0.5% in proteins with
two or more amino-acids. The percentage of
uncertainty was calculated considering the number
of different sequences with the coding for all
sequences that were compared pair-to-pair (26,675).
It is noteworthy that in all pairs with identical vector
coding, even among the 1,267 pairs with p=1, the
protein involved was exactly the same, with minor
changes of amino-acids in some positions. This
happened because, before analysis, we removed
from the PDB database only sequences with 100%
identity. We can say that the ambiguity is a
theoretical possibility in principle but not in practice.
2.3 Singular Value Decomposition
After the generation of the p-peptide frequency
matrix (M) representing each dataset with n
sequences, the matrix itself is subjected to SVD
(Deerwester et al., 1990; Berry et al., 1995) and
factorized as M = USV
T
. Where U is the p x p
orthogonal matrix having the left singular vectors of
M as its columns, V is the n x n orthogonal matrix
having the right singular vectors of M as its
columns, and S is the p x n diagonal matrix with the
singular values
σ
1
≥ σ
2
≥ σ
3
... ≥ σ
r
of M in order along
its diagonal (r is the rank of M or the number of
linearly independent columns or rows of M). This is
performed by many software, including MATLAB
(The Mathworks, 1996), used in this work. The
matrix (U) is related to the p-peptides of the dataset,
whilst (V) is associated with the proteins studied.
The central matrix (S) contains the singular values
of (M) in decreasing order. These singular values are
directly related with independent characteristics
within the dataset. Actually, the largest values of (S)
provide meaning of the peptides and proteins in the
matrix (M). On the other hand, the smaller singular
values identify less significant aspects and the noisy
inside the dataset (Eldén, 2006). The number of
significant singular values from SVD analysis shows
how many process or groups can be hidden in
database.
For the sequence similarities analysis, instead of
using the original matrix M, a rank reduction of M is
done by using the k-largest singular values of M, or
k-largest singular triplet U
k
, S
k
, V
k
, where k < r. The
truncated matrix M
k
= U
k
S
k
(V
k
)
T
has two main
advantages. Reduced dimensionality makes the
problem computationally approachable, which is
crucial in whole genome analysis. Besides, and very
important, the rank reduction improve accuracy of
protein matrix by discarding noise and reducing the
variability in p-peptide usage for the same protein
family (Couto et al., 2007). The choice of k, the
number of singular values that must be used in the
reconstruction of the protein matrix after SVD, is
critical and normally empirically decided. Ideally,
the k factor or matrix dimension must be large
enough to fit all the real structure in the data, and
small enough not to fit the sampling error or
unimportant details. In this work we used the
method proposed by Everitt and Dunn, that
recommends analyzing the relative variances of each
singular values. Singular values which relative
variance is less than 0.7/n, where n is the number of
proteins in the document-term matrix, must be
ignored (Everitt and Dunn, 2001).
3 RESULTS
Firstly, we analyzed 620 sequences randomly
selected from the first database with mitochondrial
gene families. BLAST, actually bl2seq.exe program
with default parameters, were used to compare each
pair of sequence, which totalling 191,890
comparisons. The same proteins were recoded as
vectors in a high-dimensional space that was
reduced by SVD and analyzed according to the
methods described by Couto (Couto et al., 2007).
Scatter plots were built and suggested that Euclidean
distance is negatively related with bit score, but
positively correlated with E value. For the cosine we
found a negative association with E value and a
SINGULAR VALUE DECOMPOSITION (SVD) AND BLAST - Quite Different Methods Achieving Similar Results
191
positive relationship with bit score. Those results are
consistent because, the higher cosine, the more
similar are the two protein vector. The same happens
with BLAST bit score. As the E value, the smaller
Euclidean distance between the end points of two
protein vectors, the more similar are the sequences.
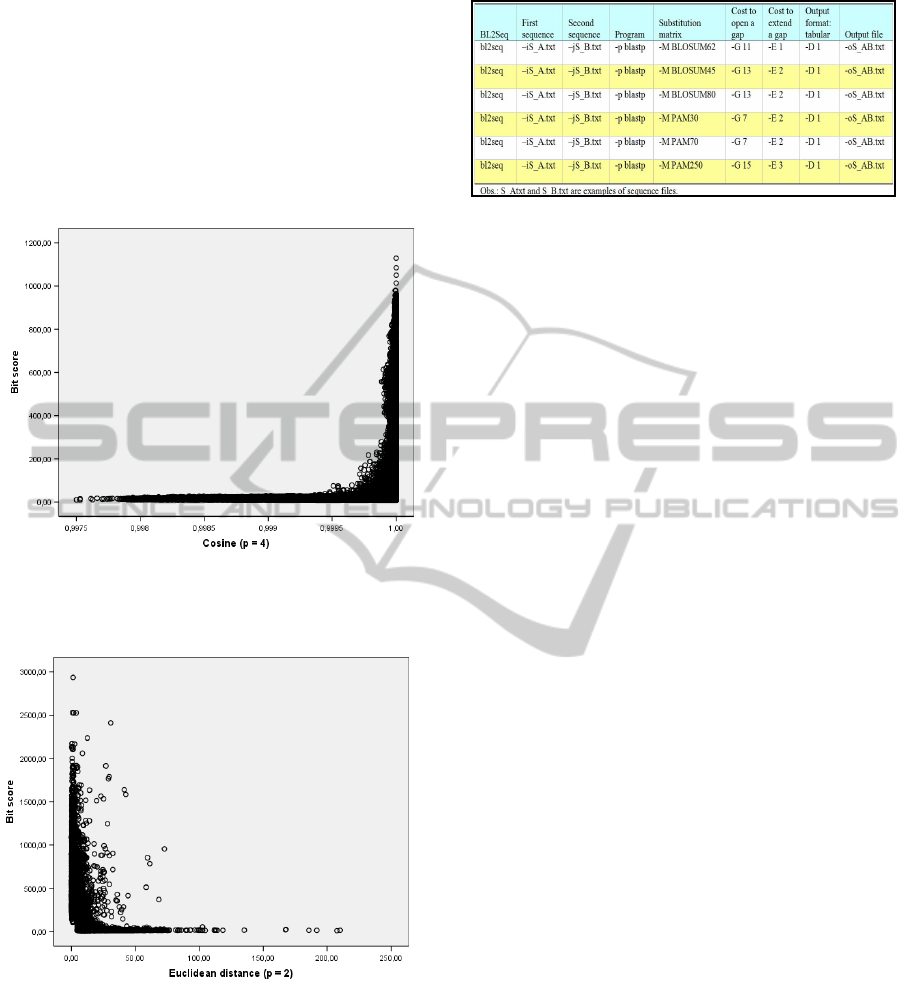
Figure 2 and 3 presents respectively scatter graphs
between the bit score and cosine and between the bit
score and Euclidean distance.
Figure 2: Scatter graph for mitochondrial gene dataset:
cosine of angle between protein vectors has a positive
correlation with BLAST bit score.
Figure 3: Scatter graph for mitochondrial gene dataset:
Euclidean distance between protein vectors has a negative
correlation with BLAST bit score.
For the second database, 27,361 non-identical
PDB sequences longer than 100 amino-acids were
compared with BLAST and SVD. In this analysis,
the first protein was compared with the second, than
was compared with the third and so on, which
totalled 27,360 comparisons. Figure 4 shows the
parameters used by bl2seq.exe program analysis.
Figure 4: BLAST parameters used in the PDB database.
We built scatter graphs and calculated Spearman
correlations (ρ) among bit score and E value from
the most similar BLAST hit, respective cosine and
Euclidean distance from SVD (Figure 5). All plots
had the same shape that observed for the first
database. For BLAST analysis we also compared the
results obtained by applying different substitution
matrix: BLOSUM62, BLOSUM45, BLOSUM80,
PAM30, PAM70 and PAM2050. The Euclidean
distance was negatively correlated with bit score
(ρ>-0.6) and positively correlated with E value
(ρ>+0.7). For the cosine we found a negative
correlation with E value (ρ>-0.7) and a positive
correlation with bit score (ρ>+0.8). It is interesting
that the correlation between E value and bit score
was not exactly 1.0 because of rounding errors.
Besides the correlation analysis, we made an
agreement test between SVD and BLAST in
classifying protein families. For the mitochondrial
gene families database, we used a sample of 212
sequences from the 13 gene families as queries (test
set), and the other proteins (620) were used to
generate the frequency matrix (training set): the
kappa coefficient between SVD and BLAST was 1.0
(agreement = 100%). If we use the first three
significant singular values from the SVD analysis of
the thirteen gene families’ database, we can generate
a three-dimensional graph showing how these genes
can be visualized in space (Figure 6). It is interesting
how the families are well separated in space, which
facilitates classification.
In another analysis, the 27,360 pair-to-pair
comparisons made by BLAST and SVD of the PDB
sequences, were evaluated in order to asses the
agreement of both techniques in detecting biological
significance. The gold standard for a biological
significant alignment was defined by an E value less
than 0.05 obtained using BLOSUM62 as the
substitution matrix (Pertsemlidis and Fondon III,
2001). The area under the ROC curve (AUC) was
estimated for both, cosine, Euclidean distance and
for the frequency matrix using one, two, three and
four peptides. The eight AUCs estimated were
BIOINFORMATICS 2011 - International Conference on Bioinformatics Models, Methods and Algorithms
192
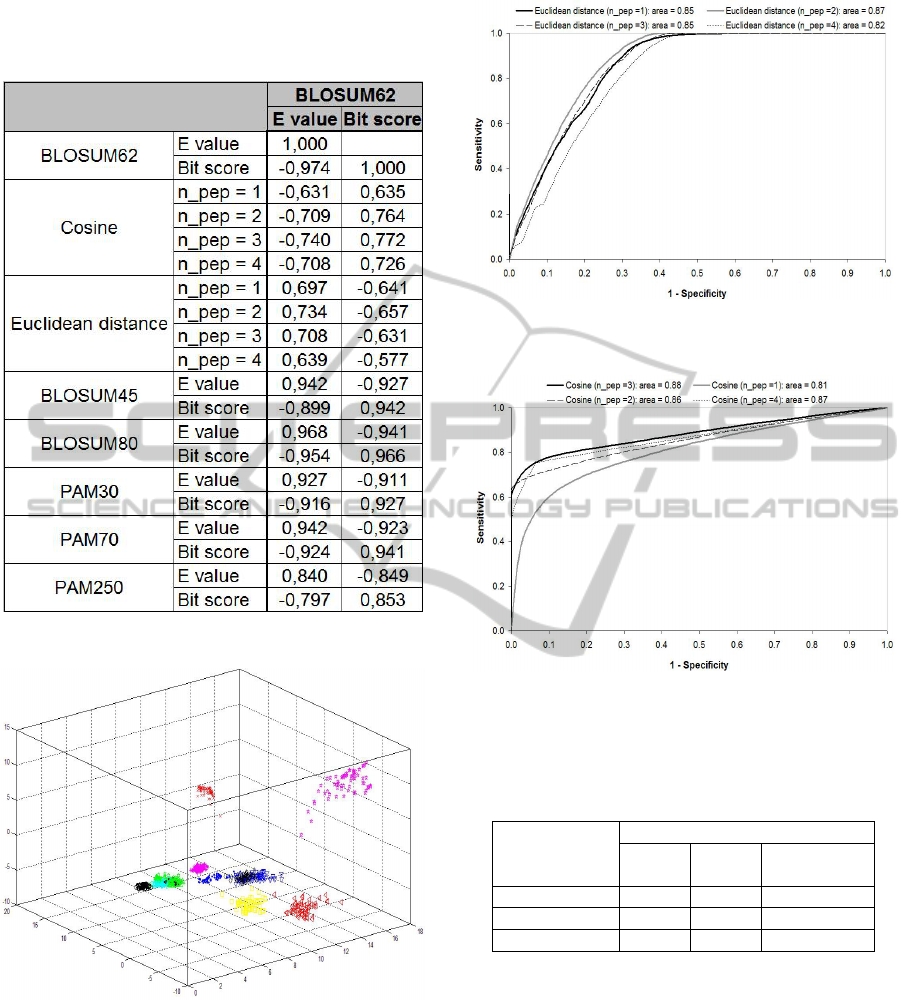
higher than 0.80 (Figures 7 and 8), which indicates a
good performance of SVD in detecting biological
significant similarities (Altman, 1991).
Figure 5: Correlation matrix: BLAST versus SVD.
Figure 6: Visualization of mitochondrial genes using the
three first singular values from SVD: the 13 gene families
are well separated in space, which facilitates classification.
Table 1 summarizes the results when cosine
among protein vectors is used to detect a biological
significance similarity. When is used a cut-off of
0.90 for the cosine, the sensitivity and specificity for
detecting biological significance were, respectively,
72% and 94%.
Figure 7: ROC curve built when SVD Euclidean distance
is used to detect biological significant similarity.
Figure 8: ROC curve built when SVD cosine is used to
detect biological significant similarity.
Table 1: Two-way contingency table: cosine higher than
0.90 between protein vectors has 72% sensitivity and 94%
specificity to detect biological significant similarities.
BLOSUM62
biological
significance?
Cosine biological significance?
(+)
(−)
Total
Yes 9,678 3,843 13,521
No 808 13,031 13,839
Total 10,486 16,874 27,360
During the analysis of the third protein
collection, a sample of 40,000 Swiss-Prot sequences
was randomly divided into two groups: 9,953
proteins were selected as queries (test set), and the
other 30,047 sequences (training set) were used to
generate the frequencies matrix of SVD and to
become the BLAST database for evaluating the
queries. All 9,953 unknown proteins were analyzed
by SVD and BLAST (actually, blastall program
with default parameters) and results of both methods
were compared in order to detect agreement. If the
Swiss-Prot mnemonic protein identification code of
SINGULAR VALUE DECOMPOSITION (SVD) AND BLAST - Quite Different Methods Achieving Similar Results
193

the most similar BLAST hit was identical as that
obtained by a SVD analysis, so we had an
agreement. When this happened, the matched
proteins are the same, from the same or different
species. Table 2 presents the percent agreement
between BLAST and SVD: the results were good,
except when the p-peptide matrix is built by using
just one amino-acid as the word-size.
Table 2: Agreement between SVD and BLAST for
classifying proteins from the Swiss-Prot dataset.
p-peptide
matrix
SVD similarity metric Percent agreement
with BLAST
p=1 Cosine 20%
Euclidean distance 30%
p=2 Cosine 79%
Euclidean distance 82%
p=3 Cosine 80%
Euclidean distance 82%
p=4 Cosine 69%
Euclidean distance 72%
4 CONCLUSIONS
We worked with quite different techniques and we
found important association among their metrics and
good agreement between both methods. Despite the
fact that is presumably not surprising that e.g.
BLAST bit score could be positively correlated to
cosine of angle, or negatively correlated to
Euclidean distance, the sizes of these correlations
are very interesting (Figure 5).
We achieved similar results between BLAST
and SVD in several protein analyses. The findings
strongly suggest that SVD can be used to protein-
protein comparisons with biological significance of
the similarities identified both for cosine and
Euclidean distance. The fact that SVD has a strong
correlation to BLAST results may represent a
possible core technique within a broader algorithm.
Besides, SVD has some characteristics that could
be an advantage over alignment algorithms. For
example, SVD analysis can be very rapid, it does not
use any heuristics to asses an unknown sequence, its
metrics are exact in a sense of direction and position
in a high-dimensional Euclidean space, it is not
affected by database redundancy because of rank
reduction, its similarity metrics do not depend on the
database size, and any analyze does not need a
substitution matrix nor gap penalties to produce
biological significant results.
An assessment of the singular value spectrum
visualized as scree plots (Zhu and Ghodsi, 2006) can
unreveals the main components, the process that
exists hidden in a database. This information can be
used in many applications as clustering, gene
expression analysis, immune response pattern
identification, characterization of protein molecular
dynamics and phylogenetic inference.
SVD can be also used to visualize the
relationships between sequences and even whole
genomes, which can be essential to better analyze
complex systems and can be very helpful to
categorize genes or species in phylogeny.
All results found in this work and the
characteristics described are important because SVD
can be a solution for the potential problems with
alignment algorithms and can be a substitute for
those methods, for example, in whole genome
analysis.
ACKNOWLEDGEMENTS
We are thankful to Professor Gary W. Stuart from
Indiana State University, Department of Life
Sciences, who sent us helpful data. We also thank
Marlon C. Souza from UNI-BH, who revised the
manuscript.
REFERENCES
Altman, D. G., 1991. Practical Statistics for Medical
Research. Chapman and Hall, London, UK.
Altschul, S. F. et al., 1990. Basic local alignment search
tool. J. Mol. Biol., 215, 403-410.
Berry, M. W. et al., 1995. Using linear algebra for
intelligent information retrieval. SIAM Review, 37,
573-595.
Couto, B. R. G. M. et al., 2007. Application of latent
semantic indexing to evaluate the similarity of sets of
sequences without multiple alignments character-by-
character. GMR, 6(4), 983-999.
Deerwester, S. et al., 1990. Indexing by Latent Semantic
Analysis. Journal of the American Society for
Information Science, 41(6), 1-13.
Eldén, L., 2006. Numerical linear algebra in data mining.
Acta Numerica, 327-384.
Everitt, B. S. and Dunn, G., 2001. Applied multivariate
data analysis. 2nd edn. Arnold, London, UK.
Holm, L. and Sander, C., 1998. Removing near-neighbour
redundancy from large protein sequence collections.
Bioinformatics, 14(5), 423-429.
Jun, S. R. et al., 2010. Whole-proteome phylogeny of
prokaryotes by feature frequency profiles: An
alignment-free method with optimal feature resolution.
Proc Natl Acad Sci U.S.A, 107(1):133-8.
BIOINFORMATICS 2011 - International Conference on Bioinformatics Models, Methods and Algorithms
194

Korf, I.; Yandell, M.; Bedell, J., 2003. An essential guide
to the Basic Local Align-ment Search Tool – BLAST.
O’Reilly & Associates Inc., Sebastopol, U.S.A.
Koski, L. B. and Golding, T. B., 2001. The closest BLAST
hit is often not the nearest neighbor. J. Mol. Evol., 52,
540-542.
Krawetz, A. S. and Womble, D. D., 2003. Introduction to
Bioinformatics: a theoretical and practical approach.
Humana Press, Totowa, USA.
Liu, B. et al., 2008. A discriminative method for protein
remote homology detection and fold recognition
combining top-n-grams and latent semantic analysis.
BMC Bioinformatics, 9, 510.
Pertsemlidis, A. and Fondon III, J. W., 2001. Having a
BLAST with bioinformatics (and avoiding
BLASTphemy). Genome Biology, 2(10), 1-10.
Stuart, G. W. et al., 2002. Integrated gene and species
phylogenies from unaligned whole genome protein
sequences. Bioinformatics, 18(1), 100-108.
Stuart, G. W. and Berry, M. W., 2004. An SVD-based
comparison of nine whole eukaryotic genomes
supports a coelomate rather than ecdysozoan lineage.
BMC Bioinformatics, 5: 204+.
The Mathworks, 1996. MATLAB: mathematical
computation, analysis, visualization, and algorithm
development (version 5.0). Natick, Massachusetts,
USA.
Teichert, F. et al., 2007. SABERTOOTH: protein
structural alignment based on a vectorial structure
representation. BMC Bioinformatics, 8, 425.
Vinga, S. and Almeida, J., 2003. Alignment-free sequence
comparison: a review. Bioinformatics, 19(4), 513-523.
Wu, C. et al., 1992. Protein classification artificial neural
system. Protein Science, I, 667-677.
Yuan, Y. et al., 2005. A Protein Classification Method
Based on Latent Semantic Analysis. Conf Proc IEEE
Eng. Med. Biol. Soc., 7, 7738-41.
Zhu, M. and Ghodsi, A., 2006. Automatic dimensionality
selection from the scree plot via the use of profile
likelihood. Computational Statistics and Data
Analysis, 51, 918-930.
SINGULAR VALUE DECOMPOSITION (SVD) AND BLAST - Quite Different Methods Achieving Similar Results
195
