
UNREVEALING BIOLOGICAL PROCESS
WITH LINEAR ALGEBRA
Extracting Patterns from Noisy Data
Bráulio Roberto Gonçalves Marinho Couto
Centro Universitário de Belo Horizonte / UNI-BH, Av. Professor Mário Werneck 1685, Belo Horizonte, Brazil
Marcelo Matos Santoro
Departamento de Bioquímica e Imunologia, UFMG, Av. Antonio Carlos 6627, Belo Horizonte, Brazil
Marcos Augusto dos Santos
Departamento de Ciência da Computação, UFMG, Av. Antonio Carlos 6627, Belo Horizonte, Brazil
Keywords: Linear algebra, Data mining, Information retrieval, SVD.
Abstract: Extracting patterns from protein sequence data is one of the challenges of computational biology. Here we
use linear algebra to analyze sequences without the requirement of multiples alignments. In this study, the
singular value decomposition (SVD) of a sparse p-peptide frequency matrix (M) is used to detect and
extract signals from noisy protein data (M = USV
T
). The central matrix S is diagonal and contains the
singular values of M in decreasing order. Here we give sense to the biological significance of the SVD: the
singular value spectrum visualized as scree plots unreveals the main components, the process that exists
hidden in the database. This information can be used in many applications as clustering, gene expression
analysis, immune response pattern identification, characterization of protein molecular dynamics and
phylogenetic inference. The visualization of singular value spectrum from SVD analysis shows how many
processes can be hidden in database and can help biologists to detect and extract small signals from noisy
data.
1 INTRODUCTION
Many bioinformatics tools are designed to detect
patterns in protein or DNA sequences by using
statistically based sequence similarity methods. The
patterns detected can be associated with the function
or structural protein stability, can predict family
genes or can be used to describe the evolving
relationship of group sequences (Hunter, 1993).
Such bioinformatics predictions help experimental
determination simpler and more efficient (King et
al., 2001). However, to evaluate how two proteins
are similar is a complex issue. The standard methods
quantify the similarity between two proteins using
global or local alignments with their primary
sequences. The goal is to find the optimal alignment,
quantifying it by some metric. In this work, instead
of using alignment analysis, the approach applied is
based on linear algebra algorithms, similar to that
used in systems for information retrieval in large
textual databases and by Google™ web search
engine. The ideas and linear algebra methods
applied here are important in several areas of data
mining, pattern recognition (for example,
classification of hand-written digits), and PageRank
computations for web search engines (Eldén, 2006).
Our objective is to use singular value decomposition
– SVD (Berry et al., 1995) of a sparse tripeptide
frequency matrix to detect and extract signals from
noisy protein data. Such analysis, when done in
micro array gene expression data, associates the
number of the most significant singular values from
SVD with the gene groups and the cell-cycle
structure (Wall et al., 2003).
We will analyze the singular value spectrum to
visualize them and to unreveal the main
313
Roberto Gonçalves Marinho Couto B., Matos Santoro M. and Augusto dos Santos M..
UNREVEALING BIOLOGICAL PROCESS WITH LINEAR ALGEBRA - Extracting Patterns from Noisy Data.
DOI: 10.5220/0003164103130317
In Proceedings of the International Conference on Bioinformatics Models, Methods and Algorithms (BIOINFORMATICS-2011), pages 313-317
ISBN: 978-989-8425-36-2
Copyright
c
2011 SCITEPRESS (Science and Technology Publications, Lda.)

components, the number of process that exists
hidden in the database. More specifically, as an
application of SVD, we want to show that the
number of the most significant singular values is
associate with the number of protein families in a
sequence database. Such prediction can be used in
phylogenetic inference, data mining, clustering etc,
making experimental tests more efficient, and
avoiding randomly determination for possible
outcomes.
2 SYSTEM AND METHODS
Programs implemented for this analysis were written
in MATLAB (The Mathworks, 1996), using its
inbuilt functions (SVD, sparse matrix manipulation
subroutines etc). Four datasets were used in this
paper. The first evaluated database had 64 vertebrate
mitochondrial genomes composed of 832 proteins
from 13 known gene families (ATP6, ATP8, COX1,
COX2, COX3, CYTB, ND1, ND2, ND3, ND4,
ND4L, ND5 and ND6). This curated protein
database was downloaded from online information
by Stuart et al. paper (Stuart et al., 2002). The
second database was composed by sequences from
proteins retrieved from GenBank in 19/04/2006. It is
a random 100 sequences sample of each protein
type: globin, cytochrome, histone, cyclohydrolase,
pyrophosphatase, ferredoxin, keratin and collagen
and 200 other proteins, totalling 1,000 sequences
from ten different types of genes. The third database
was the file "pdb_seqres.txt.gz", located in
http://bioserv.rpbs.jussieu.fr/PDB/. This file has
121,556 redundant protein sequences from PDB
(Protein Data Bank), which was reduced to 37,561
non-identical sequences. From this file we recovered
all sequences related to six types of enzymes:
Ligase, Isomerase, Lyase, Hydrolase, Transferase
and Oxidoreductase, which totalled 10,915 proteins.
We also recovered a sample of 219 globins from the
PDB file that was used as another test set. Besides,
we extracted 86 sequences of haemoglobin alpha-
chain and a sample from the PDB file with all
sequences higher than 47 amino acids (31,906
proteins from several types of genes). Each of the
above sequence files was analyzed by MATLAB
subroutines that generate twelve tripeptide sparse
matrices as described by Stuart (Stuart et al., 2002)
and adapted by Couto (Couto et al., 2007).
All sequences were recoded as 3-peptide
frequency values using all possible overlapping
tripeptide window. With 20 amino-acids it is
generated a matrix M (8,000 x n), where n is the
number of proteins to be analyzed. After the
generation of the tripeptide frequency matrix (M),
the matrix itself is subjected to SVD (Deerwester et
al., 1990; Berry et al., 1995) and factorized as M =
USV
T
. Where U is the p x p orthogonal matrix
having the left singular vectors of M as its columns,
V is the n x n orthogonal matrix having the right
singular vectors of M as its columns, and S is the p x
n diagonal matrix with the singular values
σ
1
≥ σ
2
≥
σ
3
... ≥ σ
r
of M in order along its diagonal (r is the
rank of M or the number of linearly independent
columns or rows of M). These singular values are
directly related to independent characteristics within
the dataset. Actually, the largest values of (S)
provide the meaning of the peptides and proteins in
the matrix (M). On the other hand, the smaller
singular values identify less significant aspects and
the noisy inside the dataset (Eldén, 2006).
In this work our focus is only in the matrix (S)
and its diagonal values (s
i
) that make up the singular
value spectrum. The magnitude of any singular
value is indicative to its importance in explaining the
data (Wall et al., 2003). Then, the objective here is
to visualize the singular value spectrum as plots that
help biologists to discover the main components, the
process, and the groups hidden in the database. Two
graphs were built:
a) the scree plot, with 25 bigger singular
values for each database;
b) the cumulative relative variance (V
i
)
captured by the ith-singular value:
V
i
= 1 − (S
i
)
2
/∑
k
(S
k
)
2
; S
i
= ith-singular
value; k = 1, 2, … n.
The visual examination of the scree plot looks
for a “gap” or an “elbow” that indicates how many
significant singular values exist in database. After
the “gap” there is no significant value. The second
graph helps to understand how much variance is
explained by each singular value. Despite the effort
for automatic analysis, graphic visual inspection still
is one of the most commonly used in practice for
dimensionality selection (Zhu and Ghodsi, 2006).
3 RESULTS
When there is only one specific type of protein in
database, as haemoglobin alpha-chain, the singular
value spectrum obtained shows a “big gap” after the
first eigenvalue (Figure 1). Such result is confirmed
by the second graph (Figure 2) that indicates more
than 90% variance is explained by the first singular
value, which is compatible with the database itself.
BIOINFORMATICS 2011 - International Conference on Bioinformatics Models, Methods and Algorithms
314
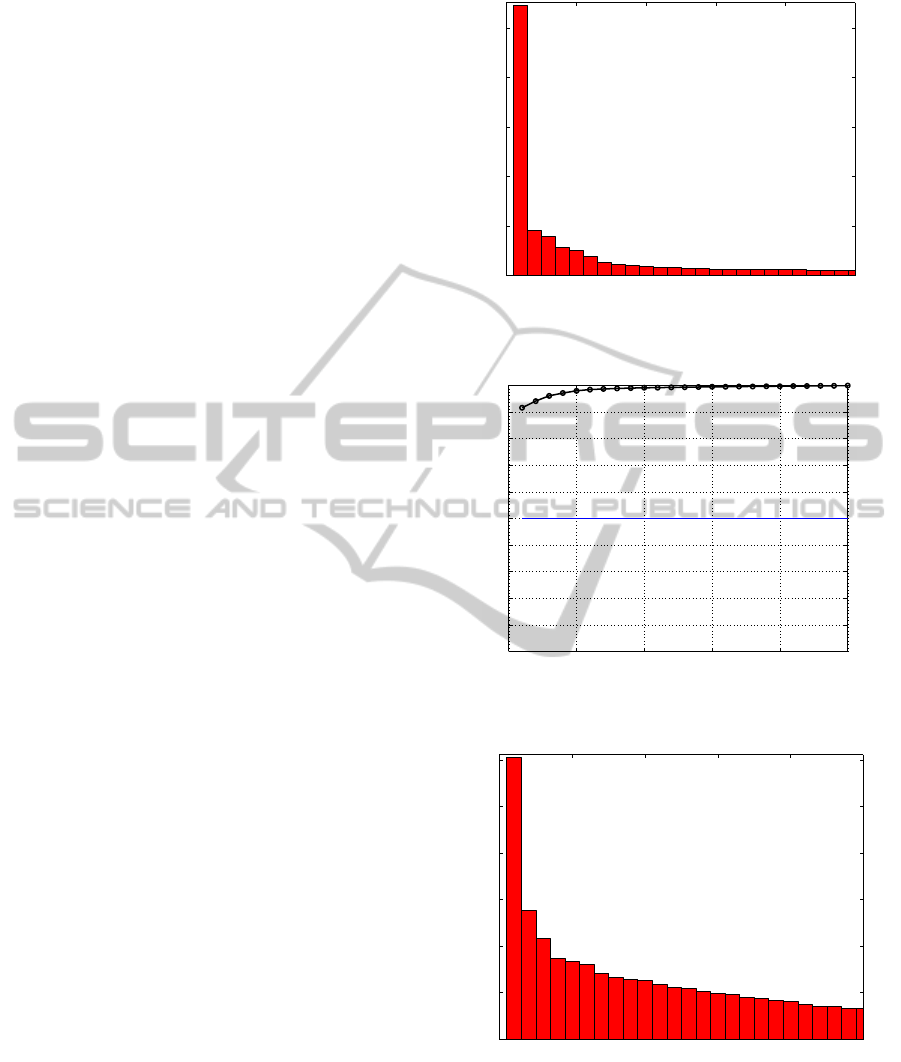
For the globin matrix (Figures 3 and 4) is more
difficult to define exactly where the “gap” or
“elbow” is, because there are more than one type
protein in database. However, the objective here is
not to be very precise, but sufficiently accurate to
help biologists in finding an interval with the
number of process or groups that exists hidden in the
database. Such predictions need validation by
experimental determination that becomes simpler. In
the globin database for example, is reasonable to
define between one and three groups that explains
about 60% of the variance in database (Figure 4).
After the third singular value there is stability in the
singular value spectrum (Figure 3).
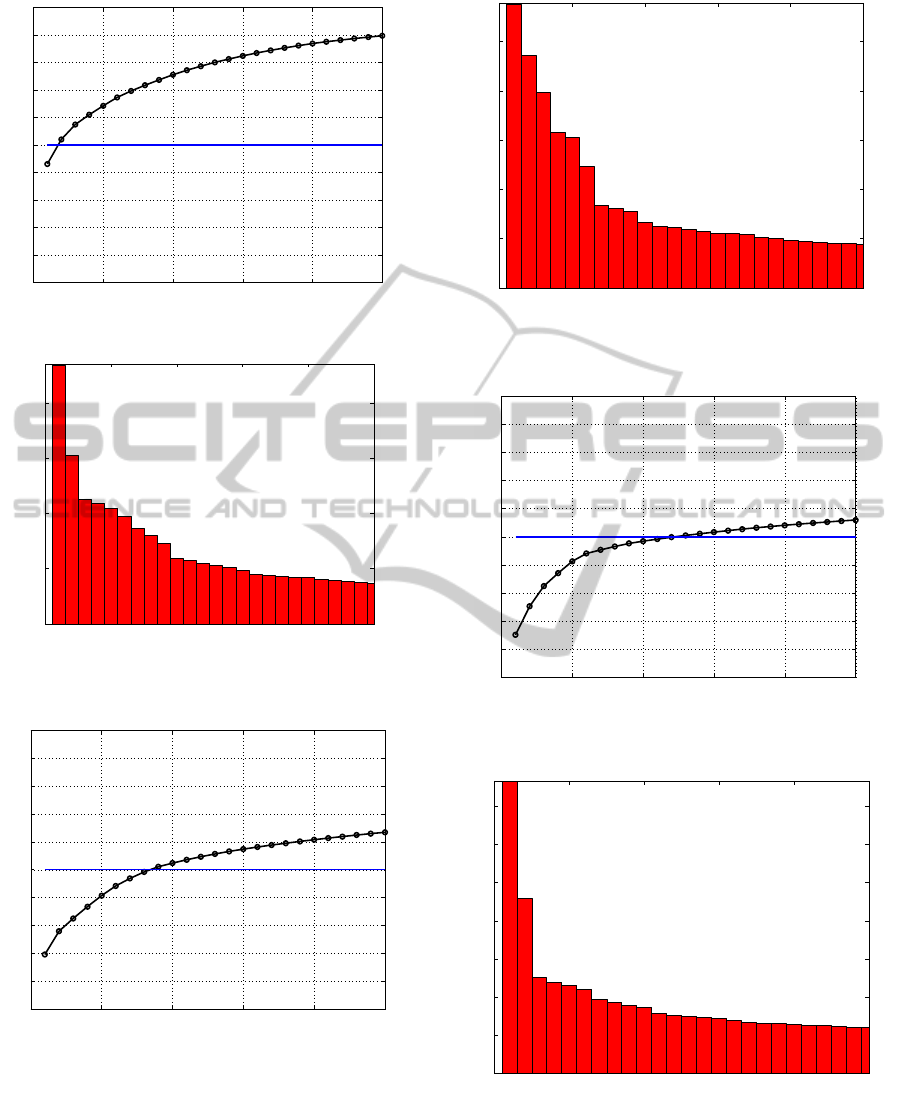
For the database with 13 mitochondrial genes
(Figures 5 and 6) it is possible to define the number
of groups around 10: after this interval the singular
value spectrum stabilizes and there is between 50%
and 60% explained variance. When the GenBank
matrix is analyzed, with ten different types of genes,
it is necessary carefully combine both graphs.
Despite the fact that there is a “gap” after the sixth
singular value (Figure 7), the variance explained
until this point is only about 40% (Figure 8). The
interval between 10 and 15 singular values
corresponds to about 50% of relative variance and
the spectrum becomes flat.
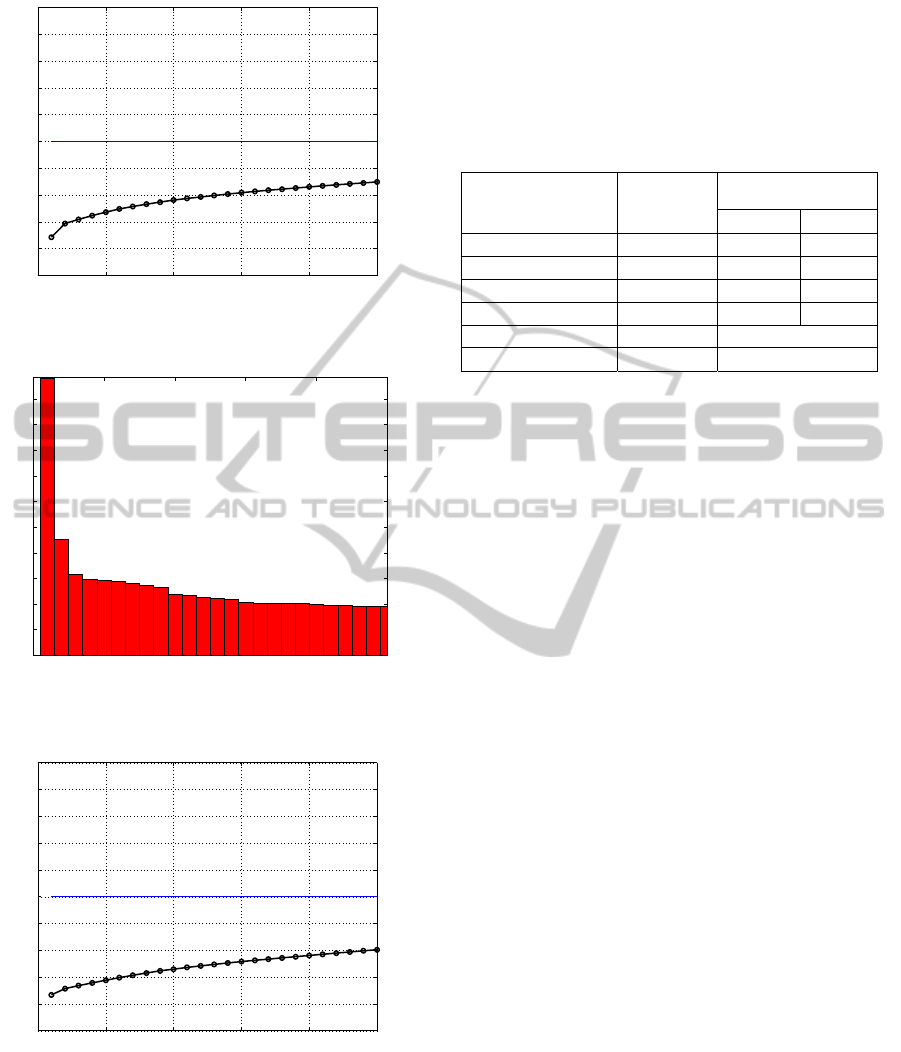
The PDB database, with more then 31,000
proteins from several types of genes, presents a
singular value spectrum where is necessary more
than 20 eigenvalues to explain about 30% of
variance. There is an “elbow” between the second
and third singular value (Figure 9) that is insufficient
to explain most data (Figure 10). Similar result is
obtained with the PDB enzymes database that
apparently had only 6 types of proteins. The visual
analysis of the scree plot and cumulative variance
graph (Figures 11 and 12) suggest more than 25
groups hidden under the six enzymes denomination.
This is a clue, a possibility that should be analyzed
by another bioinformatics tool.
Table 1 summarizes the visualization of all
singular value spectrums for each database, plotted
in the Figures 1 to 12. The suggested numbers of
significant singular values for each dataset is
coherent, except the enzymes database, which seems
to be actually formed by several quite different
sequences. SVD analysis unreveals biological
motives associated with biological processes and
other biological properties in each dataset.
0 5 10 15 20 2
5
0
20
40
60
80
100
Singular value
Rank
Figure 1: Scree plot showing singular values of
haemoglobin α-chain database.
0 5 10 15 20 25
0
0.1
0.2
0.3
0.4
0.5
0.6
0.7
0.8
0.9
1
Singular value
Relative variance (cumulative value)
Figure 2: Cumulative relative variance of haemoglobin α-
chain database.
0 5 10 15 20 25
0
20
40
60
80
100
120
Singular value
Rank
Figure 3: Scree plot showing singular values of globin
database.
UNREVEALING BIOLOGICAL PROCESS WITH LINEAR ALGEBRA - Extracting Patterns from Noisy Data
315
0 5 10 15 20 25
0
0.1
0.2
0.3
0.4
0.5
0.6
0.7
0.8
0.9
1
Singular value
Relative variance (cumulative value)
Figure 4: Cumulative relative variance of globin database.
0 5 10 15 20 2
5
0
50
100
150
200
Singular value
Rank
Figure 5: Scree plot showing singular values of
mitochondrial genes database.
0 5 10 15 20 25
0
0.1
0.2
0.3
0.4
0.5
0.6
0.7
0.8
0.9
1
Singular value
Relative variance (cumulative value)
Figure 6: Cumulative relative variance of mitochondrial
genes database.
0 5 10 15 20 2
5
0
50
100
150
200
250
Singular value
Rank
Figure 7: Scree plot showing singular values of sample
genes from GenBank.
0 5 10 15 20 25
0
0.1
0.2
0.3
0.4
0.5
0.6
0.7
0.8
0.9
1
Singular value
Relative variance (cumulative value)
Figure 8: Cumulative relative variance of sample genes
from GenBank.
0 5 10 15 20 2
5
0
100
200
300
400
500
600
700
Singular value
Rank
Figure 9: Scree plot showing singular values of random
PDB sequences dataset.
BIOINFORMATICS 2011 - International Conference on Bioinformatics Models, Methods and Algorithms
316
0 5 10 15 20 25
0
0.1
0.2
0.3
0.4
0.5
0.6
0.7
0.8
0.9
1
Singular value
Relative variance (cumulative value)
Figure 10: Cumulative relative variance of random PDB
sequences dataset.
0 5 10 15 20 2
5
0
50
100
150
200
250
300
350
400
450
500
Singular value
Rank
Figure 11: Scree plot showing singular values of PDB
enzymes database.
0 5 10 15 20 25
0
0.1
0.2
0.3
0.4
0.5
0.6
0.7
0.8
0.9
1
Singular value
Relative variance (cumulative value)
Figure 12: Cumulative relative variance of PDB enzymes
dataset.
4 CONCLUSIONS
A biologist could ask: “What is the biological
significance of the SVD?” We answered this
question: the visualization of singular value
spectrum from SVD analysis shows how many
process can be hidden in database. The singular
value plot is a suggestion, a clue that helps biologists
to detect and extract small signals from noise data.
Table 1: Suggested number of significant singular values.
Dataset Predefined #
groups
Suggested number
singular values
Min Max
Haemoglobin α-chain
1 1 1
Globin
1 1 3
Mitochondrial genes
13 9 15
GenBank
10 10 15
PDB sequences
Several > 20
Enzymes
6 > 25
REFERENCES
Berry, M. W. et al., 1995. Using linear algebra for
intelligent information retrieval. SIAM Review, 37,
573-595.
Couto, B. R. G. M. et al., 2007. Application of latent
semantic indexing to evaluate the similarity of sets of
sequences without multiple alignments character-by-
character. GMR, 6(4), 983-999.
Deerwester, S. et al., 1990. Indexing by Latent Semantic
Analysis. Journal of the American Society for
Information Science, 41(6), 1-13.
Eldén, L., 2006. Numerical linear algebra in data mining.
Acta Numerica, 327-384.
Hunter, L., 1993. Artificial Intelligence and Molecular
Biology. American Association for Artificial
Intelligence, MIT Press, Cambridge.
King, R. D. et al., 2001. The utility of different
representations of protein sequence for predicting
functional class. Bioinformatics, 17(5): 445-454.
Stuart, G. W. et al., 2002. Integrated gene and species
phylogenies from unaligned whole genome protein
sequences. Bioinformatics, 18(1), 100-108.
The Mathworks, 1996. MATLAB: mathematical
computation, analysis, visualization, and algorithm
development (version 5.0). Natick, Massachusetts,
USA.
Wall, M. E. et al., 2003. Singular value decomposition
and principal component analysis. In: Berrar, D.P. et
al. (eds.), A practical approach to microarray data
analysis, Kluwer, Norwell, pp. 91-109.
Zhu, M. and Ghodsi, A, 2006. Automatic dimensionality
selection from the scree plot via the use of profile
likelihood. Computational Statistics and Data
Analysis, 51, 918-930.
UNREVEALING BIOLOGICAL PROCESS WITH LINEAR ALGEBRA - Extracting Patterns from Noisy Data
317
