
EVALUATING STRAIN SENSOR PERFORMANCE FOR MOTION
ANALYSIS
Giancarlo Orengo, Giovanni Saggio, Stefano Bocchetti and Franco Giannini
Università “Tor Vergata”, Dipartimento Ingegneria Elettronica, via Politecnico 1, 00133, Roma, Italy
Keywords: Piezoresistivity, Bend sensor, Motion analysis, Posture recognition.
Abstract: Investigation on the more suitable technologies to register human body movements in 3D space with great
spatial accuracy is a very challenging task, because a wide range of applications are concerned, from
registration of post-stroke rehabilitation or sports performance, to monitoring of movement of disabled or
elderly people, etc. In this paper the possibilities offered by piezoresistive bend sensors applied as wearable
devices, integrated on body garments, have been explored. Piezoresistive sensors can be usefully adopted to
recover human joint bend angles for body movement tracking. Due to their pliability, sensitivity and
cheapness, they could be a valid alternative to movement analysis systems based on optoelectronic devices
or inertial electronic sensors. This paper suggests a new approach to model their electrical behavior during
bending and extension movements, in order to predict their real-time performance during different kinds of
applications.
1 INTRODUCTION
Technology progress in the last decades has
provided the opportunity to observe human behavior
in 3D space with great spatial accuracy, thanks to
image-based methods or virtual reality tools. This is
a very challenging task, because a wide range of
applications are concerned, from registration of post-
stroke rehabilitation and sports performance, to
monitoring of movement of disabled and elderly
people, only to give some examples.
Optoelectronic techniques, based on infrared
cameras with reflective markers, for measurements
of human motions and gait analysis, have been
developed. However, these methods are conceived
for maximum reliability and precision in equipped
environments, such as a laboratory, and therefore are
usually expensive and/or not readily transportable,
complicated to set up, and finally do not guarantee
the visibility under all circumstances.
On the other hand, inertial and electromagnetic
sensors, such as accelerometers and gyroscopes, and
new technologies in the field of strain and bend
sensors can lead to the development of wearable
devices to solve the relevant outdoor application
problems in human posture recognition. Special
applications in the field of telerehabilitation are
under study (Draicchio F. et al., 2010 - Giorgino T.
et. al, 2009 - Dipietro L., 2008). Adoption of
wireless technologies allows the removal of wire
ties, which hinder the human motion (Saggio G. et
al., 2009).
In order to measure human body kinematics it is
convenient to adopt sensors, which can measure
bending angles with good precision despite a low
cost. Piezoresistive sensors can be made of a
polyester base material printed on with a special
carbon ink. The polyester acts as a support while the
ink's resistance increases the more it is bent. The ink
is screen printed so it can be applied on virtually any
custom shape and size film to fit to each body joint.
The substrate film material is usually formed by
Kapton and/or Mylar for their properties, stands the
fact that substrate must be able to bend repeatedly
without failure for the sensor to work. The sensor
can be over-molded (for instance with silicon or
urethane) and it can work in dirty environments (oil,
dust). This kind of sensors are available on the
market (Images SI Inc. Staten Island NY, Flexpoint
Sensor Systems Inc. South Draper UT, USA). They
can be applied to body joints as electronic
goniometers, to realize goniometric sock for rotation
assessment of body segments in human posture
recognition, or to goniometric gloves, which enable
multiple finger joint positions to be acquired
244
Orengo G., Saggio G., Bocchetti S. and Giannini F..
EVALUATING STRAIN SENSOR PERFORMANCE FOR MOTION ANALYSIS.
DOI: 10.5220/0003168402440249
In Proceedings of the International Conference on Biomedical Electronics and Devices (BIODEVICES-2011), pages 244-249
ISBN: 978-989-8425-37-9
Copyright
c
2011 SCITEPRESS (Science and Technology Publications, Lda.)
simultaneously, and allow hand patterns to be
recognized (Giorgino T. et al, 2009 - Dipietro L.,
2008).
In order to useful exploit sensor's properties, a
complete electromechanical characterization is
mandatory. For this purpose a fully automated
measurement bench was realized and sensors
modeled from both mechanical and electrical point
of view. We propose and designed the bench
ourselves because sensor modeling stands lacks in
literature in that sense. Sensor's characteristics were
exploited to reproduce their movements inside
instrumented garment revealing human motions.
Moreover, a new modeling technique will be
developed. Available piezoresistor models, in fact,
continue to incorrectly employ a merely variable
resistance to model the sensor electrical properties
under a bending stress. Little experimental study and
theoretical analysis has been undertaken on the
effect of a range of bend angles and rates on sensor
response. One perceived problem is to calibrate
sensor performance in terms of prediction error in
the foreseen applications. As a result, in order to use
piezoresistive sensors in high precision and/or high
speed applications, an electrical model is required
that not only models the static piezoresistive effect,
but also characterizes the electrical behavior during
bending transitions. A logical choice seems to
investigate on sensor behavioral models, as a
consequence of the most important manufacturers of
commercial bend sensors do not provide any
description of their own technological process.
In Section 2 the experimental apparatus is
described. In Section 3 the static characterization is
accomplished. In Section 4 a dynamic
characterization is presented. In Section 5 a RF
characterization is attempted to explain the observed
delays. In Section 6 a new approach to extract an
electrical behavioral model is described. Finally, in
Section 7 the behavioral model is applied to predict
sensor performance in tracking slow and fast knee
rotations, whereas some conclusions are drawn in
Section 8.
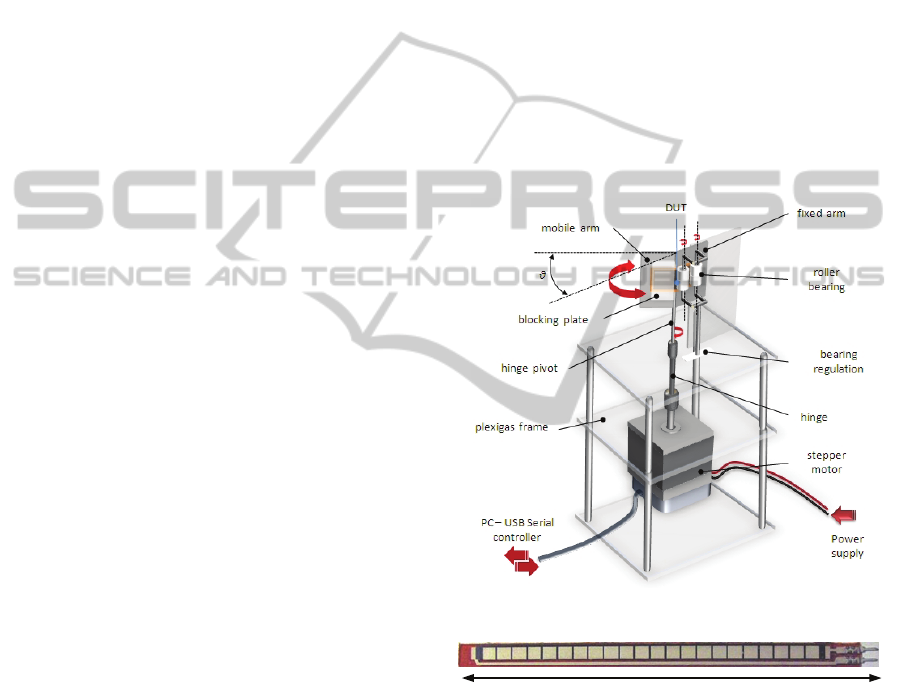
2 EXPERIMENTAL APPARATUS
The apparatus employed for this analysis was
designed to emulate, in a controlled environment,
the behavior of commercial carbon-ink bend sensors,
printed on pet strip substrates, when applied to body
joints to track segment rotations. Figure1 shows a
schematic of the experimental set-up. Figure 2
provides a photo of a sensor strip sample. The sensor
sample was laid as a cantilever beam on a metal
hinge. In order to bend the sensor from -60 to +180
degrees (for setup mechanical constraints) with
different bending rates, the sample side connected to
the electrodes was locked in a stationary clamp,
fixed to a rotating platform operated by a step motor.
The other side of the sensor strip was put in a sliding
clamp to avoid the sample stretching. Bending angle
step amplitude was changed reliably from a Labview
serial interface connected to a PC. The step motor is
a PD-109-57 sample from Trinamic, connected to
the PC through a RS-232 cable. Motor speed rate
can be set changing the
TMLC (Trinamic Motion
Control Language) units (1000 TMCL units
correspond to 9.537 RPS or rounds-per-second). In
this way, the sensor resistance can be characterized
in terms of the expected bending angles at different
speed rates.
Figure 1: Schematic of the experimental set-up.
Figure 2: Photograph of a piezoresistive sensor strip
(Images SI Inc. Staten Island NY USA).
3 QUASI-STATIC BENDING
RESPONSE
Using the described test set-up, the sensor resistance
value was measured through a digital multimeter,
sweeping rotation amplitude of the mobile arm of
the hinge, at ten degree steps. For the particular
sensor size under test, a quasi-static characterization
curve for inward and outward bending angles,
8.5 c
m
EVALUATING STRAIN SENSOR PERFORMANCE FOR MOTION ANALYSIS
245

corresponding to negative and positive rotation
degrees, respectively, was produced. Results are
plotted in Figure 3, together with the parasitic
capacitance, which will be evaluated in a following
section. It can be observed that the sensor resistance
changes not linearly with bending rotation degrees,
even if efforts were spent to enhance linearity
(Gentner R. Classen J., 2009). More sensitivity
resulted for outward bending. Since body segment
rotations approximately range from 0 to 150
degrees, they will be tracked exploiting only
outward rotations. In this case, the piezoresistive
material must be external with respect to the body
joint.
The repeatability of measurement was evaluated
comparing the same bending angles during quasi-
static forward and back rotation. Forward and back
values succeeded to be superimposed in this case,
due to the elasticity of the sensor strip substrate,
although temporary memory effects cannot be
evaluated under quasi-static stimulation, but they
were analyzed in the next section.
-60 -30 0 30 60 90 120 150 180
3
4
5
6
7
8
9
10
11
12
13
14
15
16
resistance
capacitance
bending degrees
Sensor Resistance (k
Ω
)
-60 -30 0 30 60 90 120 150 180
8
10
12
14
16
18
20
22
24
26
28
30
32
34
Parasitic Capacitance (pF)
Figure 3: Electrical resistance from quasi-static
measurements, and parasitic capacitance from S-parameter
measurements, of a piezoresistive sensor, under ten degree
stepped bending rotation increments.
4 STEP-BENDING TRANSITION
ANALYSIS
In order to know the sensor dynamic behavior
during flexion and extension, the response to fast
rotations was analyzed through time-domain
characterization performed with the same
experimental apparatus, using this time an Agilent
TDS210 digital oscilloscope. The electrical
schematic is shown in Figure 4, where a series
reference resistor is inserted to measure the current.
Probes connected to oscilloscope channel 1 and 2
read node voltages v
in
and v
out
, respectively. The
aim was to analyze transitions in sensor resistance,
when subjected to fast flexions and extensions for
different amplitudes of the rotation step.
Stimulating the circuit with a constant DC
voltage, the sensor resistance can be easily obtained
from
()
(
)
(
)
in out
p
vt v t
it
R
−
=
(1)
()
(
)
()
(
)
() ()
out out
sens p
in out
vt vt
Rt R
it v t v t
==
−
(2)
To evaluate the resistance transition times, the
sensor was subjected to trapezoidal stimulations,
each composed of a one-step rotation from 0 to 50,
100 and 150 degrees, respectively, and a one-step
back rotation to restore the flat position, delayed of
220 ms.
Figure 4: Electrical schematic of the transition
characterization set-up.
The rotations were operated setting the
maximum allowed motor speed rate, corresponding
to 2040 TMCL, which is theoretically close to 20
RPS, that is to say 7 degree/ms. The input and
output voltage waveforms were captured in real time
from a PC by the Labview interface, setting different
delays to the command signal sent to the motor with
respect to the trigger signal sent to the oscilloscope
to discriminate multiple traces, stopping the
acquisition at the end of the selected time-base (0.5
s), and saving the input/output voltage waveforms
on a file.
Figure 6 exhibits the resistance waveforms as
resulted from (2), together with the ideal response,
which would result from the motor rotation, and a
model simulation, which will be developed in a
following section. It can be observed the rise/fall and
relaxation times in the sensor resistance during
step
motor
TekTDS210oscilloscope
CH1CH2
R
p
V
in
V
out
+
V
S
−
i
LabView
set‐up
control
Step‐motor
command
interface
R
sens
DUT
RS‐232
BIODEVICES 2011 - International Conference on Biomedical Electronics and Devices
246
flexions and extensions. Comparing specified motor
and experimental sensor transition times, except for
friction delays during sensor strip extension, it can
be concluded that the motor rotation speed seems to
contribute for less than 20% to transition times in
sensor response.
Owing that transition delays cannot be
eliminated, authors believe that it is useful to
provide a sensor electrical model, which can predict
the sensor performance, especially in those
applications where high speed movements have to
be monitored.
Figure 5: RLC behavioral circuit (t>0).
0 0.05 0.1 0.15 0.2 0.25 0.3 0.35 0.4 0.45 0.5
-20
-10
0
10
20
30
40
50
60
70
80
90
100
110
120
130
140
150
160
170
180
time [sec]
Rotation [deg]
5200
8733
11817
14400
motor
sensor meas
sensor model
under rotation
Resistance [k
Ω
]
Figure 6: Comparison of measured sensor resistance
response with the RLC model simulation, for 50,100 and
150 degrees of bending and extension step amplitudes
(darker trace segments correspond to response during
motor rotation).
5 RF CHARACTERIZATION
To investigate whether electrical parasitic elements
could be the source of transient times, parasitic
series inductance and shunt capacitance were
extracted by mean of RF characterization. Although
transient times are too long to be explained only by
circuit elements, authors believed that to extract
their values and investigate whether they are
correlated to bending angle is of some interest to
understand the device behavior. To this aim a further
experiment was conducted, accomplishing a one-
port RF characterization with an HP8150 network
analyzer, while the sensor strip was subjected to
quasi-static rotations by the step motor using the
same test jig, with rotation angles ranging from -60
to 180 degrees. Using the DC resistance values, the
parasitic series inductance and shunt capacitance
values were obtained from the sensor complex
admittance extracted from S-parameter
measurements from 50 to 200 MHz. The inductance
value resulted too low and was neglected, whereas
the parasitic capacitance rated about 20 pF, as also
reported in Figure 3. It is clear that the measured
transient times cannot be on account of such a low
parasitic value.
6 BEHAVIORAL MODELS
As a matter of fact, it can be supposed that
piezoresistive material relaxation times should be
the source of transition times. Investigation on the
physical nature of material relaxation, however, is
not the target of this work. The most important
manufacturers of commercial sensors, in fact, do not
provide any description of their technological
process, and, in any case, this kind of investigation
does not concern design engineers of sensor
cognitive systems.
A behavioral model is here represented by a low-
pass RLC circuit, where circuit elements were
optimized to fit the model simulation to the
electrical behavior shown by measurements, with no
account on their physical meaning. The circuit used
to simulate the sensor electrical behavior under
resistance variation is shown in Figure 5, where the
resistance was supposed to change simultaneously
with the rotation degrees, while the transition delay
was modeled by the LC resonant circuit. The sensor
response was analyzed in the Laplace domain, even
if, in this case, the voltage source is constant and the
stimulus should be represented by the sensor
resistance variation itself, in response to a bending
stress. Given the Laplace circuit analysis does not
allow element variations, the sensor resistance was
represented as a piecewise-constant model, where
the ramp, whose slope corresponds to the motor
rotation speed, was divided into small steps. The
sensor response was therefore obtained from an
iterative routine, which performs circuit analysis
computing successive step solutions, where the
initial conditions at each step are the last values of
R
p
Sensor
model
+
V
c
(s)
−
V
g
/s
+
−
1/sC
sL
R
I
L
(s)
I
c
(s)
t=t
i
EVALUATING STRAIN SENSOR PERFORMANCE FOR MOTION ANALYSIS
247

the previous one. The global sensor response is
obtained connecting the successive solutions.
Referring to a single step, the system was
analyzed solving the following linear system:
()
()
ccci
LLLi
cLiLLi Li
cg cLp
IsCVCv
V sLI Li
VIRVIRsLLi
VVsIIR
=−
⎧
⎪
=−
⎪
⎨
=+= +−
⎪
⎪
=−+
⎩
(3)
where v
ci
and i
Li
represent the initial conditions at
step i.
The solution is
()
()
()
22
00
1
++−
=
++
g
pci i pLi
c
p
ii i
VsCRvRsLsLRi
V
LC R
ss s Q
ωω
(4)
()
()
()
22
00
1
++−
=
++
g
pci i pLi
c
p
ii i
VsCRvRsLsLRi
V
LC R
ss s Q
ωω
(5)
2
0
ip
p
i
RR
LCR
β
ω
+
==
(6)
The constant circuit parameters L and C were
found from (5) and (6), assigning a reasonable value
to the sensor resistance R (14k
Ω
), the resonant
frequency f
0
(10Hz) and the resonant factor Q (1.23),
even if they actually change at each step. A
reasonable value for the resonant frequency f
0
can be
obtained from the equation
≈=
0rise
f
1t 10Hz
for a
rise time of 100ms. It is worth to note that, for a
RLC low-pass circuit, f
0
is close to the 3dB cutoff
frequency, which therefore represents an upper limit
to the speed of the movements to be tracked by the
sensor. The resistance time behavior can be yield
from the equation
()
(
)
()
(
)
()
_
==
−
pci
sens
sens i
sens g ci
Rv t
vt
Rt
itVvt
(7)
Transition simulations with the equivalent circuit
model were performed and compared with the
corresponding measurements, for 50, 100 and 150
degrees of bend step amplitudes, as also plotted in
Figure 6. The modeling result is satisfactory.
7 SENSOR PERFORMANCE
SIMULATION
An interesting application of piezoresistive sensor is
the development of wearable devices for tracking
and recording physiological movements, such as
sensing garments for knee rotation, gloves for hand
and finger movement, etc. These devices can be
typically applied to telerehabilitation protocols. If
associated to virtual reality software, these devices
enable to monitor human posture and movements in
real time.
The extracted sensor models can be very useful to
predict sensor performance in different applications.
For example Table 1 shows typical knee rotation
parameters for walkers and runners (Saggio G. et al.,
2009).
Table 1: Typical knee rotation parameters for walker and
runner.
man
speed
v
man
step
length
l
s
te
p
knee rotation
amplitude
φ
max
knee rotation
frequency
f
knee
walker 5 km/h 1 m 60 deg 1.4 Hz
runner 10 m/s 2 m 150 deg 5 Hz
Figure 7 shows the model simulation of sensor
performance in tracking knee rotation, obtained
modeling the knee rotation movements of a walker
and a runner, as sinusoidal cycles with the typical
amplitude and frequency provided by Table 1, where
the knee rotation frequency was yield from the
equation
=
knee man step
f
vl
(8)
The sensor resistance response was mapped in
the corresponding bending angles through
interpolation of static characterization shown in
Figure 3. To perform piecewise-linear simulations,
the rotation movement was modeled as one degree
successive rotation steps.
To calibrate the sensor response for a sinusoidal
stimulus, a constant time delay for a given rotation
frequency, which can be yield from the low-pass
RLC frequency response as
()
2
0
22
00
=
+⋅ −
LP
f
Hf
f
jf f Q f
(9)
(
)
2
=
π
d
phase H
t
f
(10)
BIODEVICES 2011 - International Conference on Biomedical Electronics and Devices
248

was incorporated into the equations. In this way,
running the model simulation, the sensor model is
able to reply the knee rotation with good accuracy
even for a runner, as it can be seen in Figure 7.
Hence, it can be concluded that, if accurately
modeled, the piezoresistive sensors under test can
accurately monitor also the fastest body segment
rotations.
0 0.5 1 1.5 2
0
10
20
30
40
50
60
Walker knee rotations
rotation [deg]
0 0.1 0.2 0.3 0.4 0.5 0.6
0
30
60
90
120
150
Runner knee rotations
time [sec]
rotation [deg]
knee rotation
RLC model
calibrated model
Figure 7: RLC model simulation of sensor performance in
tracking the knee rotations of a walker and a runner.
8 CONCLUSIONS
This paper aims to demonstrate that wearable
devices instrumented with commercial piezoresistive
sensors can be applied for human posture and
motion recognition, as
a valid alternative to
movement analysis systems based on optoelectronic
devices or inertial electronic sensors. Static and
dynamic characterization revealed that piezoresistive
sensors change their resistance with bending rotation
degrees, even if transition delays from 50 to 100 ms
were measured when monitoring fast bending and
extension movements. Given that transition delays
were due to piezoresistive material relaxation times,
in order to predict the sensor electrical capability to
recover rotation angles, the transition behavior under
bending and extension movements was simulated by
extracted behavioral models based on fictitious RLC
equivalent circuits, with no physical meaning
associated to the circuit parameters. The device
model simulation allowed to evaluate that sensor
tracking of the human knee fastest rotation was
accurate. To give an example the extracted models
were applied to simulate and evaluate the sensor
behavior in tracking human knee movements either
of a walker and a runner.
This findings represent a sound benchmark, by
which others can gauge the accuracy and suitability
of bend sensors for different applications.
ACKNOWLEDGEMENTS
This work was mostly supported by the DCMC
Project of the Italian Space Agency (ASI).
REFERENCES
Dipietro L., Sabatini A. M. and Dario P., “A Survey of
Glove-Based Systems and their Applications” IEEE
Transactions on Systems, Man, and Cybernetics-Part
C: Applications and Reviews, Vol. 38, No. 4, July
2008.
Draicchio F. et al., “Global biomechanical evaluation
during work and daily-life activities”, Biodevices conf.
Proceed., Valencia, January 2010.
Gentner R. Classen J., “Development and evaluation of a
low-cost sensor glove for assessment of human finger
movements in neurophysiological settings” Journal of
Neuroscience Methods 178 (2009) 138–147
Giorgino T., Tormene P., Lorussi F., De Rossi D., and
Quaglini S., “Sensor Evaluation for Wearable Strain
Gauges in Neurological Rehabilitation”, IEEE
Transactions on Neural Systems and Rehabilitation
Engineering, vol. 17, no. 4, pp. 409-415, August 2009.
Saggio G., Cavallo P., Bianchi L., Quitadamo L. R. and
Giannini F., “UML model applied as a useful tool for
Wireless Body Area Networks”, Proc. of Wireless
VITAE’09 conf., Aalborg (DK), 2009.
Saggio G., De Sanctis M., Cianca E., Latessa G., De
Santis F. and Giannini F., “Long term measurement of
human movements for health care and rehabilitation
purposes”, Proc. of Wireless VITAE’09 conf., Aalborg
(DK), 2009.
EVALUATING STRAIN SENSOR PERFORMANCE FOR MOTION ANALYSIS
249
