
OPTIMUM CORE-WINDING RATIO FOR A RECEIVER
COIL IN A BIOMEDICAL INDUCTIVE POWER SYSTEM
Furqan Noor
1
and Maeve Duffy
2
1
Bioelectronics Research Cluster, National University of Ireland Galway, Galway, Ireland
2
Power Electronics Research Centre, National University of Ireland Galway, Galway, Ireland
Keywords: Biomedical inductive power systems, Transplants, coils, Maximum power transfer, Magnetic cores.
Abstract: The relation of the structure of a cylindrical coil used on the receiver side of an inductive power system to
the level of power that can be delivered is investigated. It is found that for a given fixed receiver coil size,
an optimum design can be defined in which the cross sectional area of the core equals that of the winding.
Results of circuit simulation, Finite Element Analysis and measurements of five test coils are presented to
verify the proposed theory for the case of coils having 5 mm diameter and 10 mm length.
1 INTRODUCTION
Wireless power links have been widely applied in
biomedical applications, for their advantages of
reduced infection, reduced size and simplified or
reduced surgical procedures. However, in proven
systems it is generally true that power transmitter
and receiver coils are located in close proximity and
the power requirements are relatively low
(Clements, Vichienchom et al. 1999; Ahmadian,
Flynn et al. 2005; Atluri and Ghovanloo 2005;
Fotopoulou and Flynn 2006; Harrison, Watkins et al.
2006; Ali, Ahmad et al. 2009). Furthermore, most of
the biomedical inductive power transfer (IPT)
systems developed so far do not have such strict
constraints of physical dimensions of the transmitter
and receiver coils and the spacing between them
(Clements, Vichienchom et al. 1999; Atluri and
Ghovanloo 2005; Hmida, Dhieb et al. 2006; Furse,
Harrison et al. 2007; Mounaim, Sawan et al. 2009).
In this work, transmitter and receiver coils that have
significantly different sizes (50 mm vs. 5 mm
diameter), and which are located at a large distance
apart (when compared to the size of the received
coil) are investigated. Both primary and receiver
coils are assumed to be located inside the body, with
the battery powered transmitter coil located so that it
can provide power to a receiver coil located in a
more inaccessible part of the body.
Initially, the case of air-core coils was
investigated, but it was found that low coupling
between transmitter and receiver coils seriously
limits the power transfer capability. The inclusion of
a magnetic core in the receiver coil was found to
enhance the power transfer efficiency by increasing
the mutual coupling between the coils (Noor and
Duffy 2009). Cores have been used in the receiver
coils of biomedical applications like BION implants
(J. H. Schulman 2004; Djordje Popovic 2007),
biomedical sensors (Flynn), and wireless powering
of implantable devices (Kihyun Jung 2008).
However, no detail is available on how the design of
receiver coils with cores should be optimised, and
therefore this work addresses this issue.
The design and construction of 5 test receiver
coils for a given air-core transmitter coil is described
in section 2. Resonant circuits used to compensate
for the high leakage inductance associated with a
loosely coupled system are described in section 3.
The design of a suitable resonant circuit in terms of
the inductances, resistances and coupling factor for a
given pair of transmitter and receiver coils is
described so that the results can be investigated for
other systems. Results of power and voltage levels
are predicted for the five test coils over frequencies
from 100 – 600 kHz. It is found that the maximum
power is provided with a coil in which the core and
winding cross sectional areas are approximately
equal, where the increase in coupling factor
provided by the core is offset by the reduction in
winding turns that can be fit for larger core areas.
The translation of power levels achieved in terms of
electromagnetic field regulations for safe human
74
Noor F. and Duffy M..
OPTIMUM CORE-WINDING RATIO FOR A RECEIVER COIL IN A BIOMEDICAL INDUCTIVE POWER SYSTEM.
DOI: 10.5220/0003169500740086
In Proceedings of the International Conference on Biomedical Electronics and Devices (BIODEVICES-2011), pages 74-86
ISBN: 978-989-8425-37-9
Copyright
c
2011 SCITEPRESS (Science and Technology Publications, Lda.)

50
51
5
10
OD
exposure (IEEEStandard 1999) is discussed in
section 4. Both cases of continuous and pulsed
powering are considered. Finally, measurement
results of power and voltage produced for the test
coils are presented in section 5, where it is shown
that continuous power levels of up to 3.6 μW can be
provided within the electromagnetic field
regulations, thereby also confirming predicted pulse
power levels of up to 12 mW.
2 TRANSMITTER & RECEIVER
COILS
It was previously confirmed that the placement of a
magnetic core in the receiver coil of the inductive
power system provides amplification in the power
transfer (Noor and Duffy 2009). The application of
ferrite rod cores is investigated in this paper, where
the main aim is to identify an optimum core-winding
combination for the receiver coil that maximizes
power delivery to the load within the
electromagnetic field regulations. In all cases, a
transmitter coil with outer diameter of 51 mm and
N
tx
= 10 turns is assumed; practically the coil was
wound using wire with a diameter, d
wtx
, of 0.5 mm
over an axial length of 5 mm.
Power available from a receiver coil in an
inductive power system is proportional to the square
of the voltage induced on it, V
ind
2
= (jωMI
tx
)
2
, and
inversely proportional to the coil resistance, R
2
,
where M is the mutual inductance between the
transmitter and receiver coils and I
tx
is current
flowing in the transmitter coil. In terms of a
cylindrical receiver coil with a rod shaped core, the
induced voltage may be given as:
4/BCDNjV
2
rxind
πω=
(1)
where N
rx
is the number of receiver turns, CD is
the diameter of the core and B is the magnetic flux
density established in the area of the core for a given
transmitter current, I
tx
. Similarly, the DC resistance
of the coil can be given in terms of the physical
parameters of the winding as:
4/d
2/)CDOD(N
R
2
wrx
rx
2
π
+
π
ρ
=
(2)
Where ρ is the resistivity of the coil wire, OD is the
outer diameter of the coil and d
wrx
is the wire
diameter. Combining (1) and (2), a relationship
between the available output power, P
avail
, and the
coil parameters is found as:
)CDOD(N
d)BCDN(
P
rx
2
wrx
22
rx
avail
+ρ
ω
∝
(3)
For the purpose of comparing different receiver coil
geometries, it is assumed that ω, d
wrx
, B and ρ are all
constant. Furthermore, the coils are compared for a
fixed outer coil diameter, OD, and a fixed coil
length. Finally, recognising that there is a
proportional relationship between the number of
winding turns and the space available in a given
winding width, (OD – CD)/2, (3) can be expressed
entirely in terms of the coil radial dimensions:
)CDOD(
CD)CDOD(
P
4
avail
+
−
∝
(4)
Differentiating P
avail
in terms of CD, the
condition for an optimum receiver coil design is
identified as:
CD = 0.781 OD (5)
Further investigation confirms that this condition is
approximately the same as found by equating the
cross sectional areas of the core, πCD
2
/4, and the
winding, π(OD
2
– CD
2
)/4; i.e. there is a trade off
between the number of winding turns that can be fit
and the flux linkage area provided by the core.
In order to confirm this theory, wire with a
diameter, d
wrx
= 0.16 mm, was used to wind five
receiver coils over a length, l
rx
, of 10 mm. The coils
were wound on five different ferrite rod cores with
diameter, CD, varying from 4 mm to 1.5 mm. All
windings were wound to produce an overall coil
diameter OD = 5 mm. The corresponding number of
turns, N
rx
, ranges from 106 to 330 respectively. The
core material has an initial magnetic permeability of
2300 (fair-rite) in all cases. A cross section of the
coils is shown in Figure 1 and a photograph of the
transmitter and receiver coils is shown in Figure 2.
CD
Figure 1: Cross section of test transmitter and receiver
coils. (Dimensions in mm, not to scale).
OPTIMUM CORE-WINDING RATIO FOR A RECEIVER COIL IN A BIOMEDICAL INDUCTIVE POWER SYSTEM
75

Figure 2: Transmitter Coil (large) with 5 (small) receiver
coils of different turn-core ratio.
The core dimensions and turns specifications of
the five receiver coils are compared in Table 1,
along with predicted and measured inductance
values. Predicted values L
FEA
, were found using
Finite Element Analysis (FEA) (Maxwell2d), and
measurements, L
meas
, were performed using an
impedance analyser (Agilent 4395A). Results of DC
winding resistance and coupling factor, k, are also
included in Table I, where FEA modelling was used
to predict k between transmitter and receiver coils
when separated by an axial distance of 5.5 cm.
Table 1: Receiver Coils’ Specifications.
Coil # 1 2 3 4 5
CD 4 3 2.5 2 1.5
N 106 208 231 285 330
L
FEA
(μH)
134 410 430 800 590
L
meas
(μH)
@ 200
kHz
146 425 420 873 396
R
DC
(Ω)
2.5 3.8 4.2 4.4 4.8
k 0.0041 0.0032 0.0031 0.0027 0.0025
There is generally agreement among the two
methods used for determining receiver coil
inductance, L
2
. Predicted values are generally higher
and this may be explained by the tolerance of the
core permeability and by the difference between
modelled and practical winding dimensions. As
might be expected, coupling factor increases with
increasing core diameter. These values will be
compared with measurements later in section 3.
3 RESONANT CIRCUIT DESIGN
In order to investigate the maximum power transfer
capability of an inductive link it is necessary to
determine the relationship between different circuit
parameters. These expressions eventually lead to an
optimum load resistance for a given coil operating at
a given frequency. In the case of links with low
coupling it is found that it’s more appropriate to first
aim for a maximum level of power transfer, and then
to try to optimize for maximum efficiency.
The impedance of the receiver leakage
inductance is quite large at weak coupling, and
therefore requires a high induced voltage on the
receiver coil. This in turn requires high transmitter
coil voltage and current and thus induces losses and
depreciates the efficiency of the inductive link. In
order to cancel the leakage inductance, the receiver
coil can be compensated by a series or parallel
capacitor. This process induces resonance in the
receiver circuit and the link operates at the phase
resonance frequency of the receiver coil. As a result,
real power transmission can be increased while
keeping the product of voltage and current (VA)
requirements low. A parallel compensated receiver
coil as shown in Figure 3 acts as a current source
and is usually preferred as the controllability of the
design is straight forward by employing short circuit
control (Stielau and Covic 2000). A receiver coil can
also be compensated by a series capacitor.
Compensation of the transmitter coil is also
essential to compensate not only the transmitter coil
inductance but also any reflected impedance from
the receiver; this is particularly important if there is
a lot of variation in the inductive parameters of the
system due to deformation or movement of the coils.
Just like the receiver coil, the transmitter coil can
also be compensated with a series or parallel
capacitor.
3.1 Circuit Analysis
An inductive link with both coils compensated using
parallel capacitors as in Figure 3 is analyzed to
determine an expression for maximum power
transfer in terms of the electrical parameters of the
transmitter and receiver coils The total impedance
acting against the voltage induced on the receiver
side, Z
2
, can be written as:
2
2
222
1
Cj
R
Cj
R
LjRZ
L
L
ω
ω
ω
+
++=
(6)
At the receiver resonant frequency the imaginary
component of Z
2
becomes zero, thereby defining the
resonant frequency, ω
o
, as:
2
222
0
)(
11
L
RCCL
−=
ω
(7)
Thus at resonance the total impedance of the
receiver side of the circuit is real and Z
2
can be
written as
BIODEVICES 2011 - International Conference on Biomedical Electronics and Devices
76

2
20
22
)(
L
L
RC
R
RZ
ω
+=
(8)
Figure 3: Transformer model of a parallel compensated
inductive power system.
For simplicity, the impedance presented at the
terminals of the transmitter coil in Figure 3 can be
given in terms of the impedance of the receiver
circuit referred to the transmitter side as shown in
Figure 4 (Schuylenbergh 1999), where Z
ref
is Z
rx
referred to the transmitter side:
rxref
Z
n
k
Z
2
)(=
with
2
1
L
L
n =
(9)
and Z
rx
, is the impedance of the receiver circuit other
than the coil self inductance L
2
.
L
L
rx
RCj
R
RZ
2
2
1
ω
+
+=
(10)
The transmitter circuit model can be further reduced
to an equivalent impedance Z
tot
acting in
series with
the primary coil inductance L
1
as shown in Figure 4.
Figure 4: Simplified transmitter coil circuit.
At the receiver resonant frequency, it is found
that Z
tot
is a real quantity which can be defined as
R
tot
given by:
)(
)(
2222
2
2
21
2
LRRCRC
LRCLk
R
LL
L
tot
+
−
=
(11)
Therefore, at resonance, the primary link
efficiency can be written as
1
RR
R
tot
tot
tx
+
=
η
(12)
which is given in terms of the circuit components by
substituting (11) into (12):
)())((
))((
222122
2
21
2
2
2
21
2
LRRCRRCLRCLk
LRCLk
LLL
L
tx
++−
−
=
η
(13)
Note that this expression holds true regardless of
whether or not a resonant capacitor, C
1
, is included
on the transmitter side. In most practical systems
however, a resonant capacitor is included so that a
lower source voltage can be applied. For loosely
coupled systems, it is found that C
1
is given simply
in terms of the transmitter coil inductance and
resonant frequency:
1
2
o
1
L
1
C
ω
=
(14)
The receiver link efficiency can be defined as the
ratio of useful power dissipated in the equivalent ac
load, P
L
, to the power transmitted to the receiver
circuit, P
rx
.
rx
L
rx
P
P
=
η
(15)
In turn, load power may be given as:
L
L
L
R
V
P
2
=
, with
L
Lrx
L
ZR
ZV
V
+
=
2
(16)
V
rx
is the load voltage driving Z
rx
across the ideal
circuit model of the receiver coil, and Z
L
is the
parallel combination of R
L
and C
2
:
jRC
jR
Z
L
L
L
−
−=
2
ω
(17)
Substituting (17) into (16) the resulting
expression for load voltage is given as:
2
2
2
22
222
)()(
)(
LL
LLLrx
L
RRRRC
RRCjRRRV
V
++
+
+
=
ω
ω
(18)
and the power delivered to the load resistor can be
written as
2
2
2
22
2
)()(
LL
Lrx
L
RRRRC
RV
P
++
=
ω
(19)
Similarly, the total power delivered to the
receiver circuit can now be written in terms of V
rx
as:
2
2
L2
rx
L2
2
L
L
Lrx
R
ZR
V
PR
Z
V
PP
+
+=+=
(20)
OPTIMUM CORE-WINDING RATIO FOR A RECEIVER COIL IN A BIOMEDICAL INDUCTIVE POWER SYSTEM
77

That is:
2
2
2
22
2
2
22
2
)()(
)]()([
LL
LLrx
rx
RRRRC
RRRCRV
P
++
++
=
ω
ω
(21)
Substituting for P
L
and P
rx
into (15), the
efficiency of the receiver circuit can be determined
as follows
)()(
2
2
22 LL
L
rx
RRRCR
R
++
=
ω
η
(22)
At the resonant frequency (22) reduces to
222
2
RRCL
L
L
rx
+
=
η
(23)
And the total link efficiency is given by:
rxtxlink
ηηη
=
(24)
Power transfer to the load is the product of the link
efficiency and the total real power delivered by the
driver of the transmitter coil:
txlinkL
PP
η
=
(25)
Given that one limitation to the power level that
can be transmitted in biomedical applications is the
maximum magnetic field intensity, H, that can be
applied, it is convenient to express load power in
terms of the transmitter current, I
tx
, to which the H
field is in direct proportion. More details of the H
field limitation are given in section 4. At resonance,
the total power delivered from the driver is given in
terms of I
tx
as:
)RR(IP
tot1
2
txtx
+=
(26)
where R
1
is the equivalent resistance of the
transmitter coil. Substituting for R
tot
from (11) the
total power transfer to the load can be written as:
2
2
222
2
2
201
2
)(
))((
tx
L
L
L
I
RRCL
RCLLk
P
+
=
ω
(27)
Clearly, power transfer is proportional to the
square of the reactance of the receiver coil and of
current flowing in the transmitter coil. This
relationship is used to scale power levels according
to the maximum current that can be applied within
the field regulations for different transmitter coil
excitation options in section 4.
Finally, the rms value of the load voltage at
resonance, V
L
, can be deduced as:
2
tx
2
2L22
L2
2
201
2
L
2
L
I
)RRCL(
RC)L)(Lk(
R
V
+
ω
=
(28)
to give:
tx
L
L
L
I
RRCL
RCLkL
V
222
2
21
2
20
))(()(
+
=
ω
(29)
Analysing (28), it is found that each receiver coil
has an optimum load resistor, R
Lopt
, at a given
resonance frequency. This optimum value can be
found by differentiating P
L
with respect to R
L
, where
it is found that:
22
2
RC
L
R
Lopm
=
(30)
Substituting for C
2
from (7), R
Lopm
is defined
entirely in terms of the receiver coil impedances:
2
2
2
2
20
)(
R
RL
R
Lopm
+
=
ω
(31)
Substituting (31) into (27), the expression for
maximum power transfer to the optimum load is
found as:
2
22
2
201
2
)(4
))((
txLopm
I
RL
LLk
P
ω
=
(32)
For illustration, the optimum load resistor is
verifed for coil 2 (with a 3 mm core) resonating at
320 kHz with C2 = 470 pF and R2 measured as 23.6
Ω (at 320 kHz). Using (30), the optimum load
resistor for maximum power transfer is predicted as
38.4 kΩ with measured values of L1 and L2. The
graph of PL vs. RL predicted using (27) in Figure 5
verifies the maximum power transfer at the
calculated load.
0
0.1
0.2
0.3
0.4
0.5
0.6
0 20 40 60 80 100 120 140 160 180 200
Load Resistor R
L
(k
Ω
)
Power (mW)
Figure 5: Maximum power transfer at optimum load.
3.2 Circuit Design for Given
Transmitter and Receiver Coils
In order to enable a comparison of the different
receiver coils under investigation, the circuit of
Figure 3 was designed over a range of frequencies
BIODEVICES 2011 - International Conference on Biomedical Electronics and Devices
78
(100 – 600 kHz) for each of the five test coils
described in section 2. The main aim of circuit
design is to determine the maximum power that can
be transmitted to each coil for a given transmitter
current, and the frequency at which this transfer
occurs.
For each coil, the first step in design is to
determine the resonant capacitance value, C
2
,
required for a given operating frequency, ω
0
, using
(7), with the optimum value of R
L
determined from
(31). For this purpose, values of R
2
and L
2
vs.
frequency were measured using an impedance
analyser so that their variation with frequency was
accounted for. It was found that while inductance
values remain practically constant with frequency,
resistance values increase by up to one order of
magnitude. This is explained by the combination of
skin and proximity effects in the windings and the
contribution of core losses from the ferrite rods, both
of which are difficult to predict. Corresponding
predicted results of R
Lopm
are plotted vs. frequency
for each of the 5 test coils in Figure 6.
The first thing to note is that R
Lopm
increases with
frequency for all coils. This is explained largely by
increasing inductive impedance with frequency, and
may be applied to tune a given system for maximum
output power at a particular load resistance. The
same effect applies in relation to the trends in R
Lopm
predicted for different coils, where coil 4 has the
largest inductance and coil 1 has the smallest.
0
10
20
30
40
50
60
70
0 100 200 300 400 500 600
Frequency (kHz)
R
Lopm
( k
Ω
)
Coil 1
Coil 2
Coil 3
Coil 4
Coil 5
Figure 6: R
Lopm
vs. frequency for the test receiver coils.
At this stage, the receiver circuit design is
complete, and the only remaining parameter needed
to complete circuit analysis is the coil coupling
factor, k. This can be deduced from FEA models of
the transmitter and coil structures. However, due to
the large distance between the coils and the
differences in their sizes in this case, it was found
that the accuracy of FEA models is limited. As a
second method, coupling factor was deduced from
measurements of the voltage induced on the receiver
coil. Due to the low level of these voltages,
measurements needed to be performed under
resonant conditions and this first required that the Q-
factor of each coil be determined.
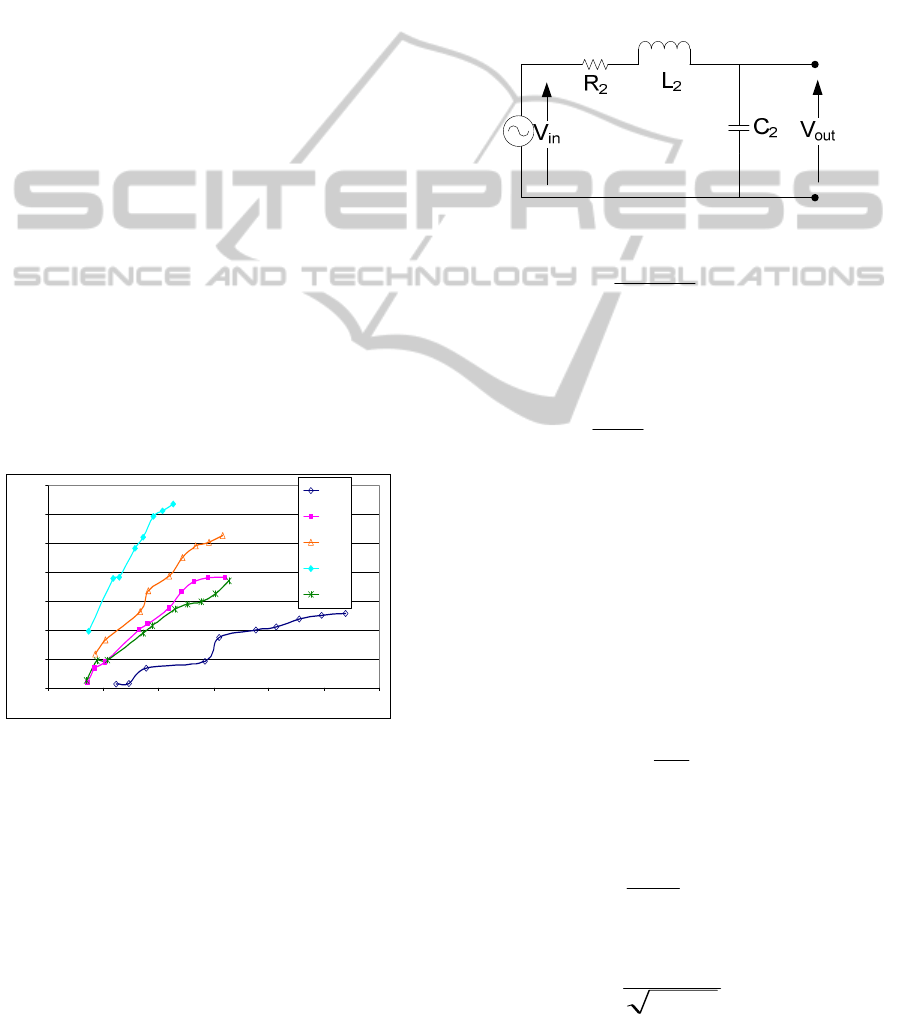
For a given receiver coil, the input voltage, V
in
,
applied to the series combination of the coil and its
resonant capacitor, C
2
, as shown in Figure 7 can be
related to a larger valued output resonant voltage,
V
out
, to give the coil Q-factor. In this case, the
resonant capacitor is given simply in terms of the
resonant frequency, f
res
, as:
Figure 7: Setup for the measurement of Q
2.
2
2
2
)2(
1
Lf
C
res
π
=
(33)
V
out
and V
in
are then found to be related in terms
of the Q-factor of the receiver coil, Q
2
= ω
ο
L
2
/R
2
=
1/ω
o
C
2
R
2
:
ininout
VjQ
RC
VjV
2
22
1
−=−=
ω
(34)
Using the function generator as a supply voltage,
values of Q
2
were calculated using (34) for each of
the test coils over a range of frequencies from 100 –
600 kHz. Values of coupling factor were then
deduced from measurements of the voltage produced
across the same resonant capacitor, V
C2
, with the
transmitter and receiver coils separated axially by
5.5 cm, and a given current, I
tx
, supplied to the
transmitter coil, as in the circuit of Figure 18. The
voltage induced on the receiver coil V
ind
was then
calculated as:
2
2
Q
V
V
C
ind
=
(35)
and the value of mutual inductance, M, between
transmitter and receiver coils was found as:
tx
ind
Ij
V
M
ω
=
(36)
Finally, the coupling factor k was calculated as:
21
LL
M
k
=
(37)
OPTIMUM CORE-WINDING RATIO FOR A RECEIVER COIL IN A BIOMEDICAL INDUCTIVE POWER SYSTEM
79
using measured values of L
1
and L
2
. The measured
coupling factor for the five test coils is shown in
Figure 8. Ideally, the coupling factors should not
vary with frequency however; the measured values
show a little variation because of the non ideal
measurement conditions.
0.003
0.004
0.005
0.006
0.007
0.008
0.009
0 100 200 300 400 500 600
Frequency (kHz)
Coupling factor "k"
Coil1
Coil2
Coil3
Coil4
Coil5
Figure 8: Measured coupling factors of test coils.
Coils 3, 4 and 5 have similar levels of coupling,
all of which are lower than 0.005. The core area is
smallest in these cases. It is interesting to note that
when compared with FEA simulation, the maximum
value of k is found with coil 2 rather than with coil 1
which has the largest core area. On further
investigation, it is found that the core and winding
cross sectional areas are approximately equal in coil
2, and this seems to confirm the optimum receiver
structure identified in section 2, in which the
reduction in core area is traded against an increasing
number of turns. Work is ongoing to explain the
difference in values of k deduced from FEA models
and measurements.
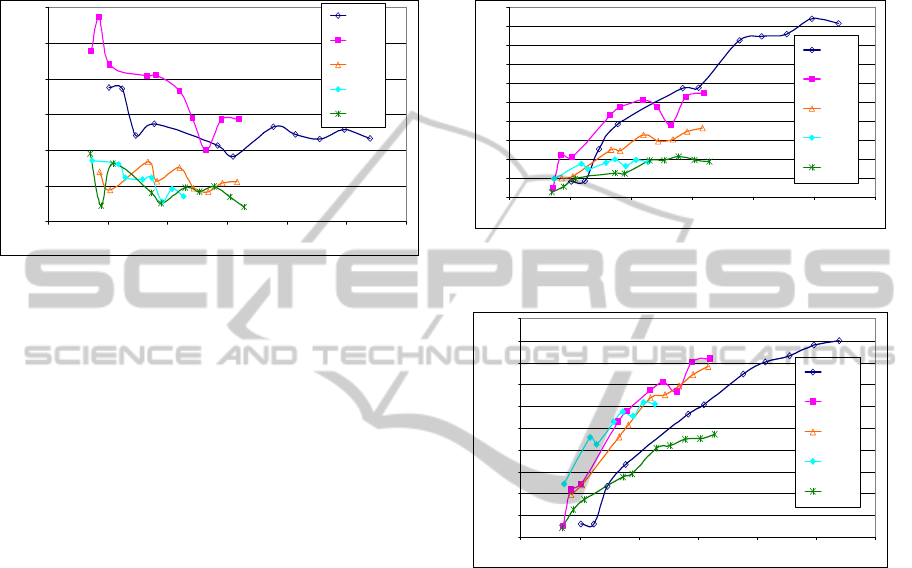
3.3 Predicted Performance of Test
Coils
Using (32), results of P
Lopm
are predicted and plotted
vs. frequency for each of the receiver coils at a
transmitter coil current, I
tx
, of 1 A in Figure 9.
Corresponding values of V
Lopm
are plotted in Figure
10. Note that these values correspond to the
measured values of R
Lopm
plotted in Figure 6. It is
seen that as given by (32) and (31), both P
Lopm
and
V
Lopm
increase with frequency, respectively. The
factor of increase is lower than given by ω
o
2
and ω
0
respectively,
due to the reduction in inductance and
increase in resistance values with frequency.
Comparing P
Lopm
for the different test coils, it is
clear that coil 2 produces the highest power levels
for most of the frequencies tested. This relates to
coil 2 having the highest coupling factor as
confirmed above and it supports the relationship to
the core: winding ratio identified in section 2; i.e. the
cross sectional areas of the core and winding are
closest for coil 2. Coil 5 has the lowest power over
all frequencies, and is most likely explained by its
highest coil resistance due to the largest number of
coil turns.
0
1
2
3
4
5
6
7
8
9
10
0 100 200 300 400 500 600
Frequency (kHz)
P
Lopm
at I
tx
= 1 A ( mW )
Coil1
Coil2
Coil3
Coil4
Coil5
Figure 9: P
Lmax
vs. frequency for the test receiver coils (I
tx
= 1 A).
0
5
10
15
20
25
30
35
40
45
50
0 100 200 300 400 500 600
Frequency (kHz)
pk-pk V
Lopm
for I
tx
= 1 A (V)
Coil1
Coil 2
Coil 3
Coil 4
Coil5
Figure 10: V
Lopm
vs. frequency for the test receiver coils
(I
tx
= 1 A).
In relation to load voltages, coils 2, 3, and 4
produce similar levels, with the two extreme coil
designs (having largest and smallest core areas)
having the lowest levels. In this case the trend is
explained approximately by the ratio of k/Q
2
, so that
the voltage of coil 1 is limited by high Q-factor and
that of coil 5 is limited by low k.
These results are translated into power levels
corresponding to the maximum transmitter current
levels allowed according to the field regulations in
section 4, and they are then verified by measurement
in section 5.
4 IMPACT OF
ELECTROMAGNETIC FIELD
REGULATIONS
In biomedical applications there are restrictions
BIODEVICES 2011 - International Conference on Biomedical Electronics and Devices
80

imposed by the ICNIRP for safe levels of
electromagnetic fields for human exposure
(IEEEStandard 1999). For a given set of inductive
coils, this translates to a maximum transmitter coil
current that must not be exceeded. Using this value
of current, the question of how much power can be
transmitted to a load connected on the receiver side
without exceeding the electromagnetic field
limitation is analyzed, to compare the performance
of the different receiver coils under investigation.
Results of voltage and power levels predicted in
section 3 are scaled in terms of I
tx
for this purpose.
Magnetic field intensity, H, at a distance of 2
mm from the transmitter coil is considered as a
measure of the safe level of electromagnetic fields
for human exposure. As shown in Figure 11, the 2
mm distance represents a box containing the
transmitter coil and relevant circuitry, and so this is
the H field that will be exposed to the body tissues.
The allowed limit for occupational exposure to
magnetic field intensity for frequencies between
.065 - 1 MHz is 1.6/f (f in MHz); i.e. the maximum
allowed field intensity decreases with increasing
frequency. Therefore, for an operating frequency of
260 kHz for example, the rms H field is limited to
only 6.15 A/m. This H-field limit holds true for
continuous sinusoidal current, or for any other
waveform that produces the same rms current over a
6 minute interval (IEEEStandard 1999).
4.1 Continuous Powering
From FEA, it is deduced that a sinusoidal rms
current of 1 A in the test ten turn transmitter coil
corresponds a maximum rms H field, H
max(1A)
, of
420 A/m at an axial distance of 2 mm from the coil.
As magnetic field intensity is proportional to current
in the transmitter coil, it is calculated for example
that the maximum allowed rms transmitter current,
I
tx(reg)
, corresponding to a H-field limit, H
reg
, of 6.15
A/m at 260 kHz is 15 mA using:
)1max(
)(
A
reg
regtx
H
H
I =
(38)
The corresponding maximum continuous power
that can be transmitted to the load is then given by
(32) with I
tx
= I
tx(reg)
.
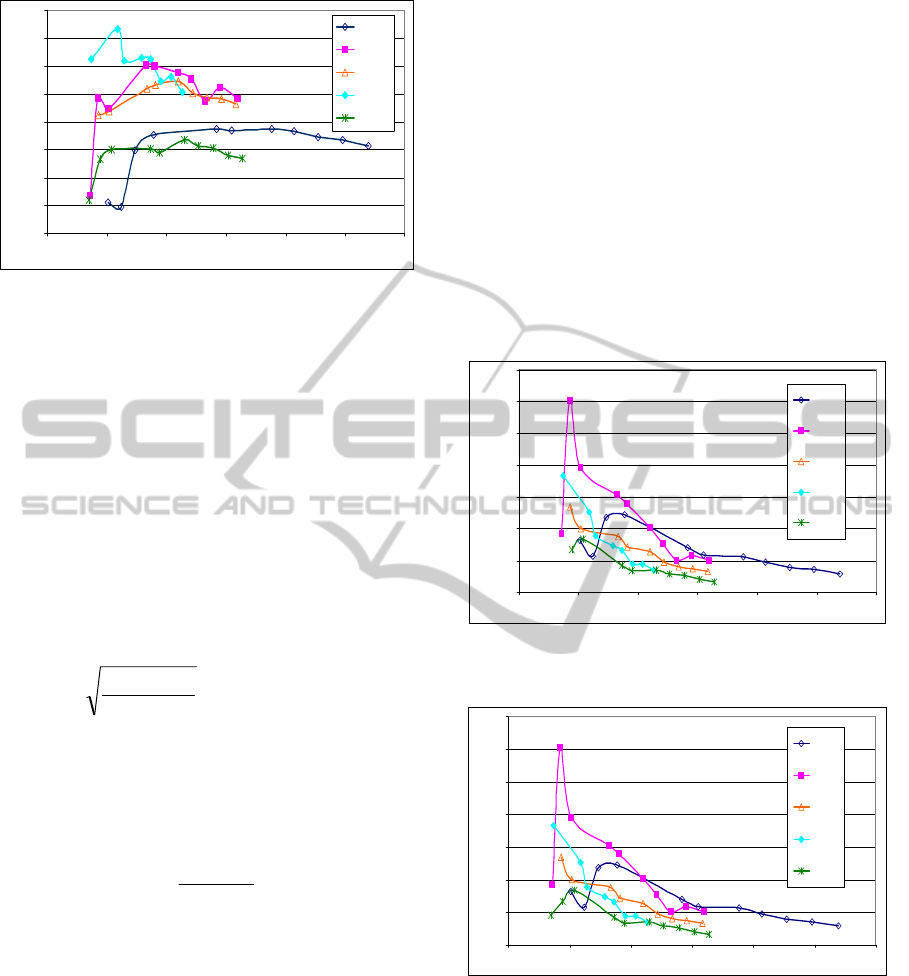
For the given 10 turn transmitter coil, results of
I
tx(reg)
are calculated using (38) for frequencies
ranging from 100 – 600 kHz, with H
reg
calculated as
1.6/f (f in MHz). Clearly, I
tx(reg)
decreases with
frequency in the same way as H
reg
. Equation (32) is
then applied to predict the corresponding maximum
power levels possible, as given in Figure 12, where
the system is designed according to the procedure
described in section 3.3. In effect, the results of
Figure 12 are scaled versions of those given in
Figure 9 according to I
tx(reg)
2
. Corresponding values
of pk-pk voltage are presented in Figure 13.
Figure 11: Magnetic field intensity around the transmitter
coil for a current of 1 A rms.
0
0.5
1
1.5
2
2.5
3
3.5
4
4.5
5
0 100 200 300 400 500 600
Frequency (kHz)
regulated P
Lopm
(
μ
W )
Coil 1
Coil 2
Coil 3
Coil 4
Coil 5
Figure 12: Predicted maximum continuous power within
field limitations.
In the same way as in Figure 9, coil 2 provides the
highest output power when Itx is limited according
to electromagnetic regulations. A mximum power
level of 4.3 µW is predicted at 100 kHz. Due to the
allowance for higher currents at lower frequencies, it
is seen that the relative performance of coil 2 is
enhanced over all other coils, and it provides the
maximum power over all frequencies considered.
Trends in pk-pk voltage levels in Figure 13 are
similar to those presented in Figure 10 , with a pk-pk
voltage of 0.5 V achieved for the maximum power
point of coil 2.
2mm outer box
TX coil
OPTIMUM CORE-WINDING RATIO FOR A RECEIVER COIL IN A BIOMEDICAL INDUCTIVE POWER SYSTEM
81
0
0.1
0.2
0.3
0.4
0.5
0.6
0.7
0.8
0 100 200 300 400 500 600
Frequency (KHz)
pk-pk regulated V
Lopm
(V )
Coil 1
Coil 2
Coil 3
Coil 4
Coil 5
Figure 13: Predicted pk-pk load voltage within field
limitations.
4.2 Pulse Powering
In biomedical applications, power is often required
in short bursts of time over a longer repetitive
period. Therefore, it is possible to provide power
through an inductive link by driving high current in
the transmitter coil for short intervals of time. The
maximum value of allowed current in the transmitter
coil is a function of the repetition frequency, f = 1/T,
and the width of the pulse, PW, used. The maximum
allowed sinusoidal H field amplitude, H
pk(reg)
,
applied during the pulse time, PW, can be calculated
in terms of its rms value as:
reg
pk
H
T
PWH
=
2
.
2
(39)
The maximum instantaneous transmitter peak
current, I
pk(reg)
, is proportional to H
pk(reg)
as before.
For an rms current of 1 A the simulated rms H field
is 425 A/m as described earlier; thus the allowed
peak current amplitude can be scaled as:
425
)(
)(
regpk
regpk
H
I =
(40)
The corresponding peak instantaneous power
that can be transmitted during pulsed operation can
then be calculated using (32) with I
tx
= I
pk(reg)
. The
performance of the five test coils for pulse durations
of 0.5 ms and 1 ms is shown in Figures 14, 15, 16
and 17 in terms of the maximum instantaneous
power levels and the maximum pk-pk load voltages.
The time period used for pulse powering is 0.833
seconds in all cases.
As in the case of continuous powering, there is
an optimum frequency at which the maximum
instantaneous power occurs for every test coil.
Obviously, instantaneous pulse power and voltage
levels are significantly higher than corresponding
average values (shown in Figure 12 and 13), and the
levels of power and load voltage increase with
decreasing pulse time.
These power and voltage levels are sufficient for
performing periodic sensing and communication
functions in a range of biomedical applications. It
should be noted that the average power requirement
for some applications can be minimised by varying
the pulse width. For example, in cardiac pacing, it
has been found that lower power is required for
pulses of long duration with relatively low output
voltage, rather than for pulses with shorter durations
and commensurately higher output voltages (W E
Hill 1988). Work is ongoing to demonstrate the coil
performance in such applications.
0
2
4
6
8
10
12
14
0 100 200 300 400 500 600
Frequency (kHz)
Instantaeous P
Lopm
for 0.5 ms
Pulse
(
mW
)
Coil 1
Coil 2
Coil 3
Coil 4
Coil 5
Figure 14: Maximum instantaneous power possible with in
regulations for test coils for 0.50 ms pulse powering.
0
1
2
3
4
5
6
7
0 100 200 300 400 500 600
Frequency (kHz)
Instantaneous P
Lopm
fo r 1 m s
Pulse
(
mW
)
Coil 1
Coil 2
Coil 3
Coil 4
Coil 5
Figure 15: Maximum instantaneous power possible with in
regulations for test coils for 1 ms pulse powering.
BIODEVICES 2011 - International Conference on Biomedical Electronics and Devices
82
0
10
20
30
40
50
60
70
80
90
0 100 200 300 400 500 600
Frequency (kHz)
pk-pk Regulated V
Lopm
fo r
0.5 ms Pulse (V)
Coil 1
Coil2
Coil 3
Coil 4
Coil 5
Figure 16: Peak-peak Load voltage possible for 0.5ms
pulse powering.
0
10
20
30
40
50
60
70
0 100 200 300 400 500 600
Frequency (kHz)
pk-pk regulated V
Lopm
for
1 ms Pulse (V)
Coil 1
Coil2
Coil 3
Coil 4
Coil 5
Figure 17: Peak-peak Load voltage possible for 1 ms pulse
powering.
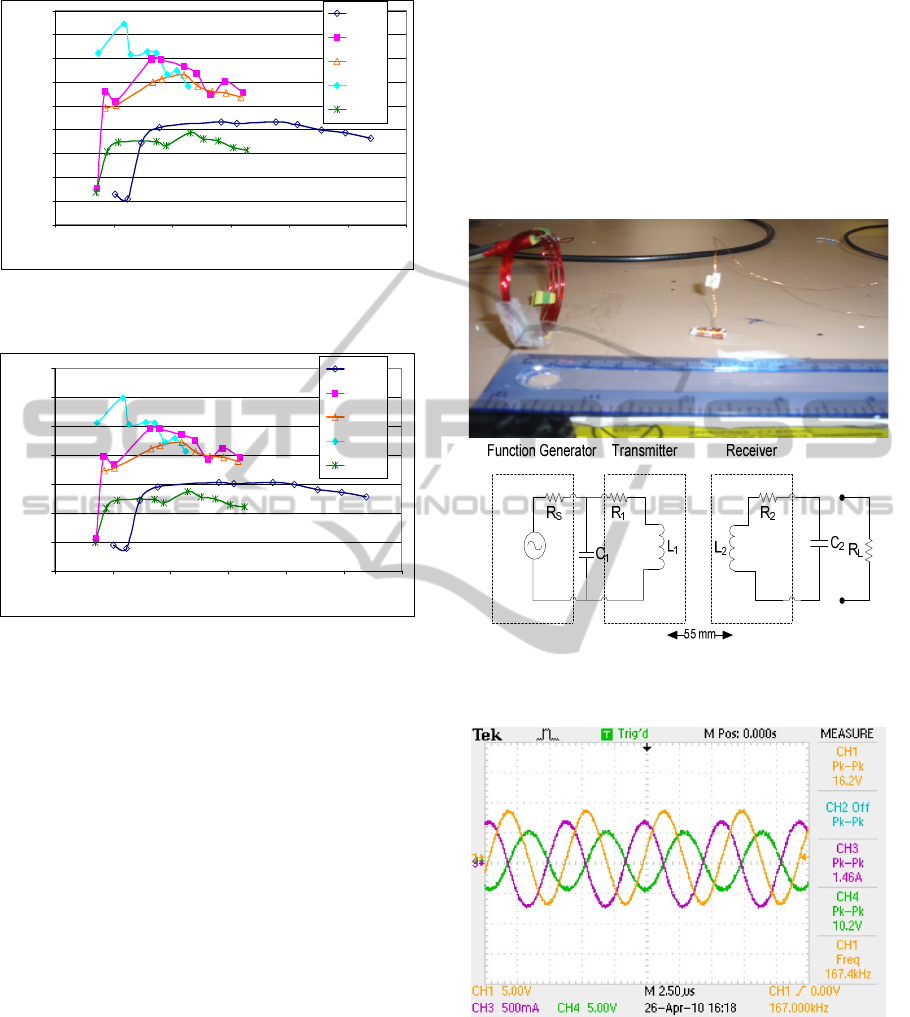
5 MEASUREMENTS
The five receiver coils were tested in the laboratory
using a set-up as described by the circuit diagram in
Figure 18. Each coil was measured for power
transmission to a matched load for a range of
frequencies. With the transmitter in a fixed position,
the position of the receiver was set equal to 5.5 cm
to make it comparable to a typical loosely coupled
inductive implant. The function generator acts as a
power supply feeding the transmitter coil through a
parallel resonant tank, and a second resonant
capacitor is connected across the receiver coil in
parallel with a load resistor. A photograph of the test
setup is shown in Figure 18a while its circuit
diagram is shown in Figure 18b.
For each coil, the design procedure described in
section 3.2 was used to determine values of the
resonant capacitor and optimum load resistance for
each test point. With the specified circuit values
connected, a voltage of 20V pk-pk was applied from
the function generator, and waveforms of pk-pk
voltages across transmitter coil (CH 1) and matched
load resistor (CH 4) were recorded. Note that a
resonant capacitor was also applied on the
transmitter side to compensate the high leakage
inductance of the transmitter coil, thereby providing
an enhanced transmitter coil current (Q
1
I
in
), I
tx
(CH
3). For example, results of transmitter coil and load
resistance pk-pk voltages along with transmitter coil
current are given for coil 3 at 167 kHz in Figure 19.
Figure 18: (a) Photograph (b) Circuit diagram of the
inductive power system test set-up.
Figure 19: Measured transmitter coil and load voltage for
coil 3 at 167 kHz.
To illustrate the low level of voltages induced on
the receiver coils with no resonant capacitor
included, measured values of open circuit pk-pk
voltage induced on the receiver coils over the test
frequency range according to the test setup in Figure
20 are shown in Figure 21.
OPTIMUM CORE-WINDING RATIO FOR A RECEIVER COIL IN A BIOMEDICAL INDUCTIVE POWER SYSTEM
83
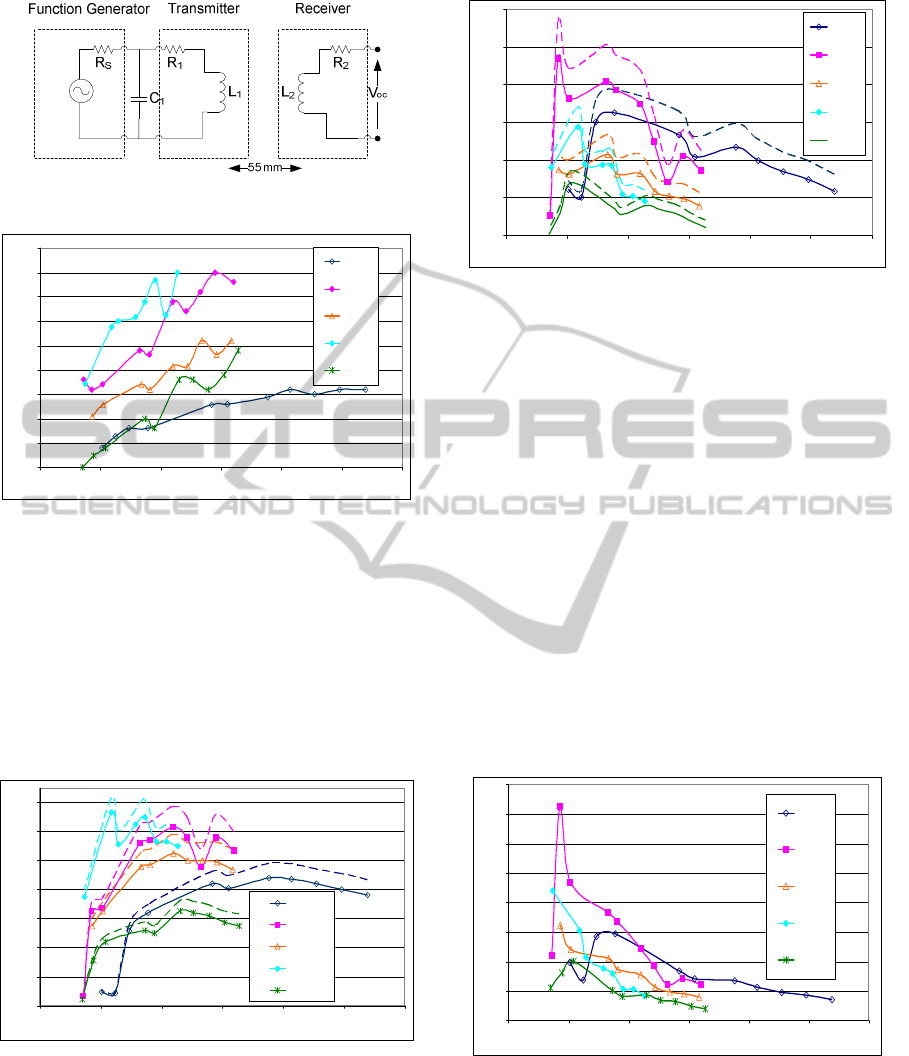
Figure 20: Measurement of open circuit induced voltage.
0.2
0.25
0.3
0.35
0.4
0.45
0.5
0.55
0.6
0.65
0 100 200 300 400 500 600
Frequency (kHz)
pk-pk open circuit Induced Voltage (V)
Coil1
Coil 2
Coil 3
Coil 4
Coil5
Figure 21: Measured pk-pk open circuit induced Voltages.
For comparison, theoretical (predicted according
to (29)) and measured load voltages with a resonant
capacitor included (according to test setup in Figure
18) are presented in Figure 22 for the five test coils
over the frequency range from 100 – 600 kHz. In
this case, the voltage source was set at 20 V pk-pk
and the primary resonant capacitor was tuned so that
the maximum current available was drawn from the
supply for all measurement points.
1
3
5
7
9
11
13
15
0 100 200 300 400 500 600
Frequency (kHz)
pk-pk V
Lopm
(V)
Coil1
Coil 2
Coil 3
Coil 4
Coil5
Figure 22: Theoretical (dashed) Vs Measured Load
Voltages.
To validate the theoretical expression of maximum
power transfer for the optimum load resistance, the
results of load voltage were applied to predict
corresponding values of load power in Figure 23.
0.1
0.3
0.5
0.7
0.9
1.1
1.3
0 100 200 300 400 500 600
Frequency (kHz)
P
Lopm
(mW)
Coil1
Coil2
Coil3
Coil4
Coil5
Figure 23: Predicted (dashed) vs. Measured continuous
Power transfer to matched load.
The predicted and measured values of voltage
and power match each other closely. However, there
are deviations due to the unknown parasitic elements
involved that have not been accounted for in the
theoretical analysis. Moreover, it is impossible to
compensate the transmitter and receiver coils fully
because of the accuracy limitations of impedance
measurements. The tolerances of capacitors, the self
capacitance of the coils and the approximate values
of the coil resistances at different frequencies cause
deviations in the measured results. Nonetheless, the
measurements confirm the trends in voltage and
power levels predicted, and the same optimum
receiver coil design is identified. Measurements of
the continuous power scaled according to maximum
field regulated current are shown in Figure 24,
where again coil 2 is confirmed as the optimum
design.
0
0.5
1
1.5
2
2.5
3
3.5
4
0 100 200 300 400 500 600
Frequency (kHz)
regulated measured P
Lopm
(
μ
W )
Coil 1
Coil 2
Coil 3
Coil 4
Coil 5
Figure 24: Measured continuous Power scaled according
to field regulated transmitter current.
6 ANALYSIS & CONCLUSIONS
The design of an optimized receiver coil for
providing sufficient power to a remote biomedical
BIODEVICES 2011 - International Conference on Biomedical Electronics and Devices
84

implant within field regulations is the ultimate goal
of this work. In order to determine this, five different
coils were wound with different winding-core ratios
and their behaviour was investigated at different
frequencies. The performance of the system was
determined through circuit design, analysis and
experimentation. Practically, the transmitter coil was
supplied with current from a function generator,
where current levels were limited so that their
associated magnetic fields were lower than specified
by regulatory bodies. The receiver coil was placed at
a distance (55 mm) from the transmitter coil, and
voltage levels were measured under different
operating frequencies.
The results of this work indicate that an optimum
coil-core ratio for a certain receiver coil size is one
in which the cross sectional area of the winding is
approximately equal to that of the core. Average
power levels of up to 4.3 μW are demonstrated
within electromagnetic field regulations for a 5 mm
diameter / 10 mm long receiver coil when located 55
mm from a transmitter coil. Pulsed power levels of
up to 12 mW are illustrated.
Conditions for maximum power transfer are
analyzed on the basis of matching the load with the
receiver circuit impedance. It was found that there is
significant variation in coil resistance with
frequency and that this impacts on the maximum
power that can be transmitted. The power transfer
capability of each coil is illustrated in terms of the
maximum power it can transmit to matched loads at
different frequencies. Work is ongoing to customise
the receiver and transmitter coil designs for specified
load impedance values, which are typical of those
encountered in biomedical applications. The impact
of different core materials and wire dimensions will
also be investigated both for the transmitter and
receiver coils.
ACKNOWLEDGEMENTS
This work is supported by Enterprise Ireland and
Brivant Ltd. under the Innovation Partnership
Programme, Grant no. IP/2007/0447.
REFERENCES
Ahmadian, M., B. W. Flynn, et al. (2005). "Data
transmission for implantable microsystems using
magnetic coupling." communications, IEEE
proceedings- 152(2): 247-250.
Ali, H., T. J. Ahmad, et al. (2009). Inductive link design
for medical implants. Industrial electronics &
applications, 2009. ISIEA 2009. IEEE symposium.
Atluri, S. And M. Ghovanloo (2005). Design of a
wideband power-efficient inductive wireless link for
implantable biomedical devices using multiple
carriers. Neural engineering, 2005. Conference
proceedings. 2nd international IEEE EMBS
conference.
Clements, M., K. Vichienchom, et al. (1999). An
implantable power and data receiver and neuro-
stimulus chip for a retinal prosthesis system. Circuits
and systems, 1999. ISCAS '99. Proceedings of the
1999 IEEE international symposium.
Djordje Popovic, l. L. B., and Gerald E. Loeb, senior
member, IEEE (2007). "recruitment and comfort of
Bion implanted electrical stimulation: implications for
FES applications." IEEE transactions on neural
systems and rehabilitation engineering 15(4).
Fair-rite. "fair-rite products corp. PO box J,One
commercial row, Wallkill, NY 12589-0288", 2010,
from www.fair-rite.com.
Flynn, K. F. A. B. W. Wireless powering of implanted
sensors using RF inductive coupling.
Fotopoulou, K. And B. W. Flynn (2006). Wireless
powering of implanted sensors using RF inductive
coupling. Sensors, 2006. 5th IEEE conference.
Furse, C. M., R. Harrison, et al. (2007). Recent advances
in biomedical telemetry. Electromagnetics in advanced
applications, 2007. ICEAA 2007. International
conference.
Harrison, R., P. Watkins, et al. (2006). A low-power
integrated circuit for a wireless 100-electrode neural
recording system. Solid-state circuits conference,
2006. ISSCC 2006. Digest of technical papers. IEEE
international.
Hmida, G. B., M. Dhieb, et al. (2006). Transcutaneous
power and high data rate transmission for biomedical
implants. Design and test of integrated systems in
nanoscale technology, 2006. DTIS 2006. International
conference.
IEEE standard. (1999). "IEEE standard for safety levels
with respect to human exposure to radio frequency
electromagnetic fields, 3 kHz to 300 GHz, 1999."
J. H. Schulman, J. P. M., J. Wolfe, E. Regev, C. Y. Perron,
R. Ananth, E. Matei, A. Glukhovsky, R. Davis (2004).
Battery powered Bion FES network. 26th annual
international conference of the IEEE EMBS San
Francisco, CA, USA.
Kihyun Jung, Y.-H. K., Euy Jung Choi, Hyun Jun Kim,
and Yong-Jun Kim (2008). Wireless power
transmission for implantable devices using inductive
component of closed-magnetic circuit structure. IEEE
international conference on multisensor fusion and
integration for intelligent systems. Seoul, Korea.
Maxwell2d. "ansoft maxwell 2d." from www.ansoft.com.
Mounaim, F., M. Sawan, et al. (2009). Integrated
inductive power and data recovery front-end dedicated
to implantable devices. Biomedical circuits and
systems conference, 2009. BIOCAS 2009. IEEE.
OPTIMUM CORE-WINDING RATIO FOR A RECEIVER COIL IN A BIOMEDICAL INDUCTIVE POWER SYSTEM
85

Noor, F. And M. Duffy (2009). Effect of a magnetic core
in the receiver coil of a biomedical inductive power
system. Engineering in medicine and biology society,
2009. EMBC 2009. Annual international conference of
the IEEE.
Schuylenbergh, K., Puers, Robert (1999). Inductive
powering , basic theory and application to biomedical
systems.
Stielau, O. H. And G. A. Covic (2000). Design of loosely
coupled inductive power transfer systems. Power
system technology, 2000. Proceedings. POWERCON
2000. International conference.
W E Hill, A. M., J P Bourke, l Howell and R G Gold
(1988). "Minimum energy for cardiac pacing." clinical
physics and physiological measurement.
BIODEVICES 2011 - International Conference on Biomedical Electronics and Devices
86
